Quadtrees
Tree codes sort particles into nested squares: every cell holding more than a
few particles splits into four. plasma_plots.plot_quadtree draws that
hierarchy from plain arrays, so it works with any tree code and with none at
all. The functions are in
plasma_plots.trees.
Cells by depth
Section titled “Cells by depth”from plasma_plots.trees import build_quadtree, plot_quadtree
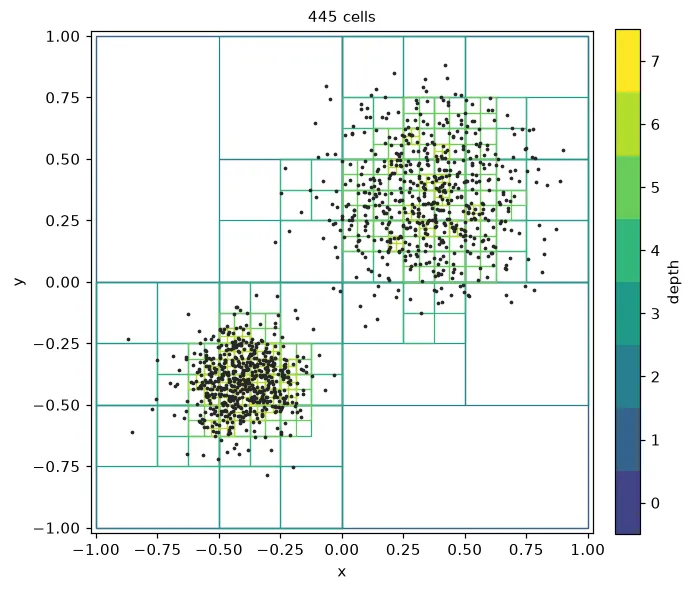
cells = build_quadtree(points, leaf_capacity=8, bounds=(0.0, 0.0, 1.0))plot_quadtree(cells, points=points)build_quadtree splits every cell with more than leaf_capacity points;
points is (2, N) or (N, 2). Without a tree, plot_quadtree(points=points)
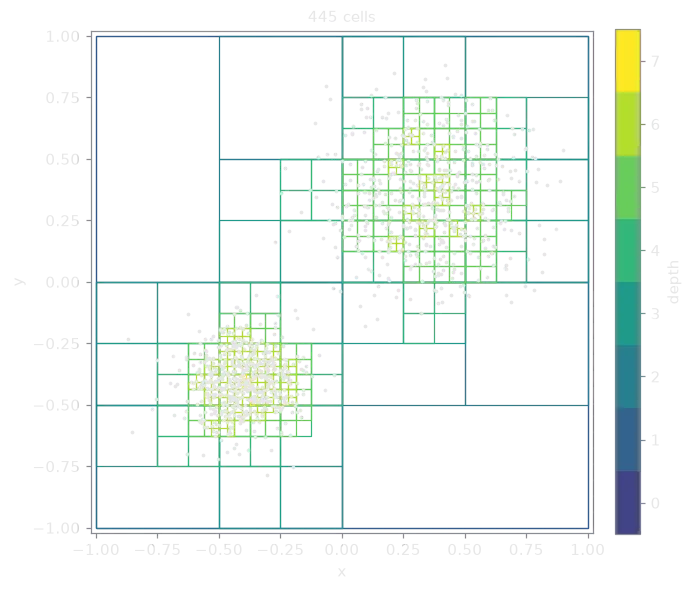
builds one with the defaults. The outlines are colored by depth, with one color
per level, and the particles are drawn on top.
Occupancy of the leaves
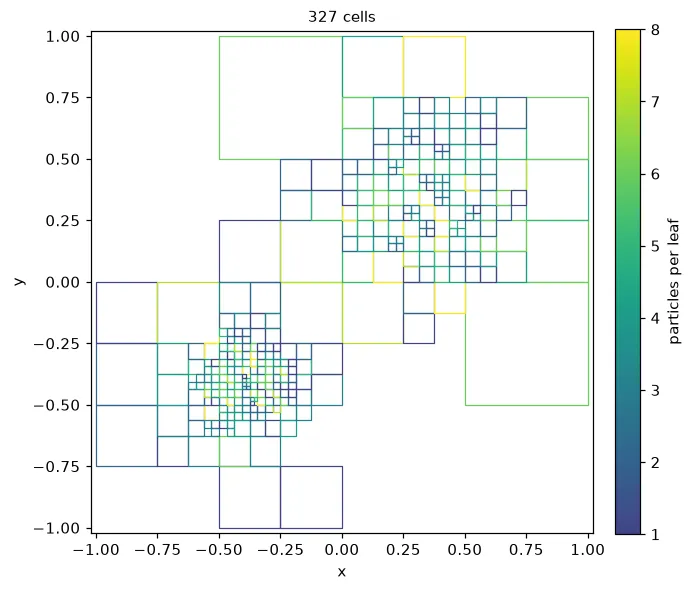
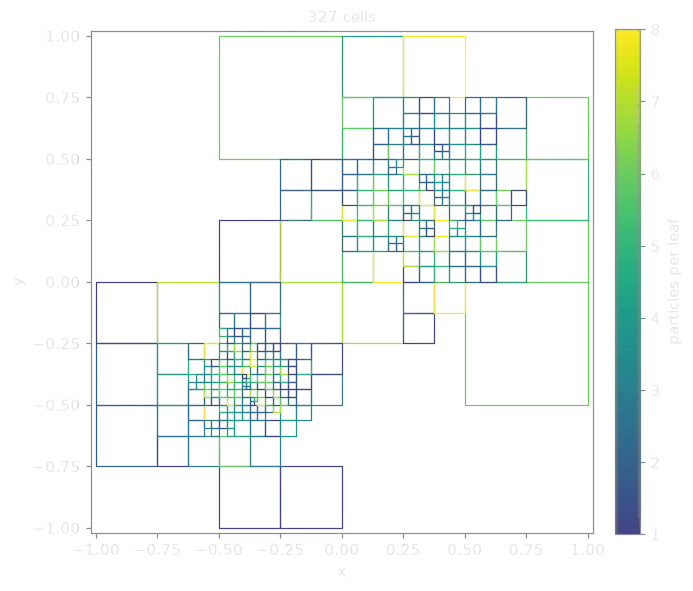
Section titled “Occupancy of the leaves”plot_quadtree(cells, color="count")color="count" draws only the leaves, colored by the particles each holds: a
quick check of leaf_capacity and of how evenly the tree splits the
particles. leaves_only=True and max_depth= thin out a deep tree with either
coloring, and color=None draws every outline in one gray.
A Barnes-Hut walk
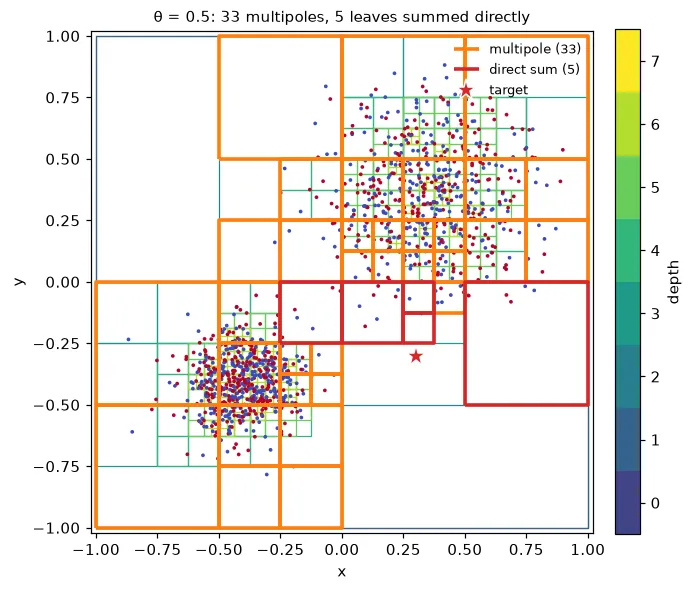
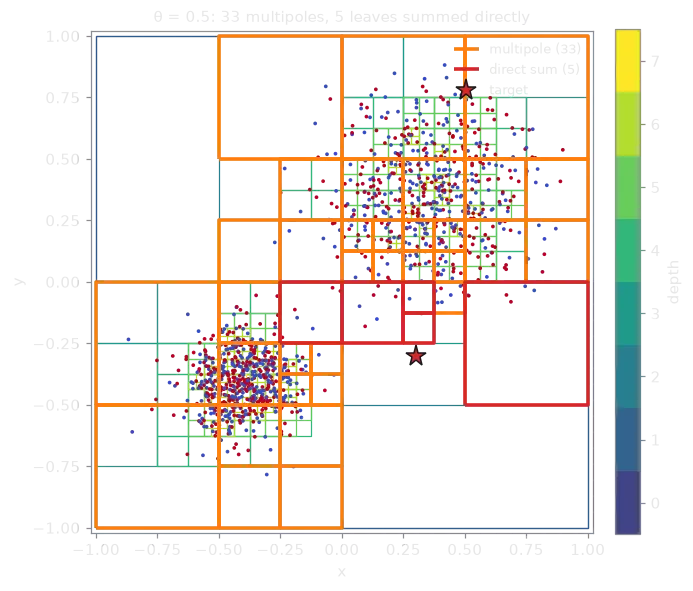
Section titled “A Barnes-Hut walk”plot_quadtree( cells, points=points, point_color=charges, target=(0.3, -0.3), theta=0.5)For a target, the walk starts at the root. A cell of side at distance
is taken as one multipole when and it does not hold the
target; otherwise a leaf is summed particle by particle and any other cell is
opened. The multipoles and the leaves summed directly are outlined in bold, and
the title counts them. point_color= colors the particles by a value such as
their charge, on a diverging scale centred on zero.
plasma_plots.trees.barnes_hut_walk(cells, target, theta) returns the same
classification as masks over the cells.
The same plot with Plotly
plot_quadtree(cells, points=points, target=(0.3, -0.3), backend="plotly")
 Loading figure…
A tree that follows the particles
Section titled “A tree that follows the particles”from plasma_plots import animate_quadtree
animate_quadtree( points=history, times=t, point_color=charges, backend="plotly")animate_quadtree draws one tree per frame: give it the trees of a simulation
(one per saved step) or only the positions, history, a list of (2, N)
arrays (or one array with a leading frame axis), and it builds a tree for each
with leaf_capacity and bounds. The depths share one color scale over the
whole animation and the axes stay fixed (extent= sets them). With Matplotlib
it returns a FuncAnimation; with Plotly a figure with a slider and Play and
Pause buttons. leaves_only=True keeps a large tree light, and
max_frames= thins out a long history. The tree-d-3d examples
diocotron instability and
Coulomb explosion use it on
real simulations.

 Loading figure…
Trees from a tree code
Section titled “Trees from a tree code”plot_quadtree also takes a tree object with the attribute names of
tree-d-3d’s FlatQuadtree: node_center, node_half, node_depth,
node_child (the first of four consecutive children, or an (n, 4) array),
and node_start and node_end for the particles of each cell. Empty
quadrants of a split cell are left out. Arrays from another code go in through
quadtree_cells(centers=..., half_widths=..., depths=..., children=..., counts=...).
from tree_d_3d import FlatQuadtree, Quad
tree = FlatQuadtree(points, charges, Quad(0.0, 0.0, 1.0), leaf_capacity=8)plot_quadtree(tree, points=points, target=(0.3, -0.3))