Paschen breakdown curves
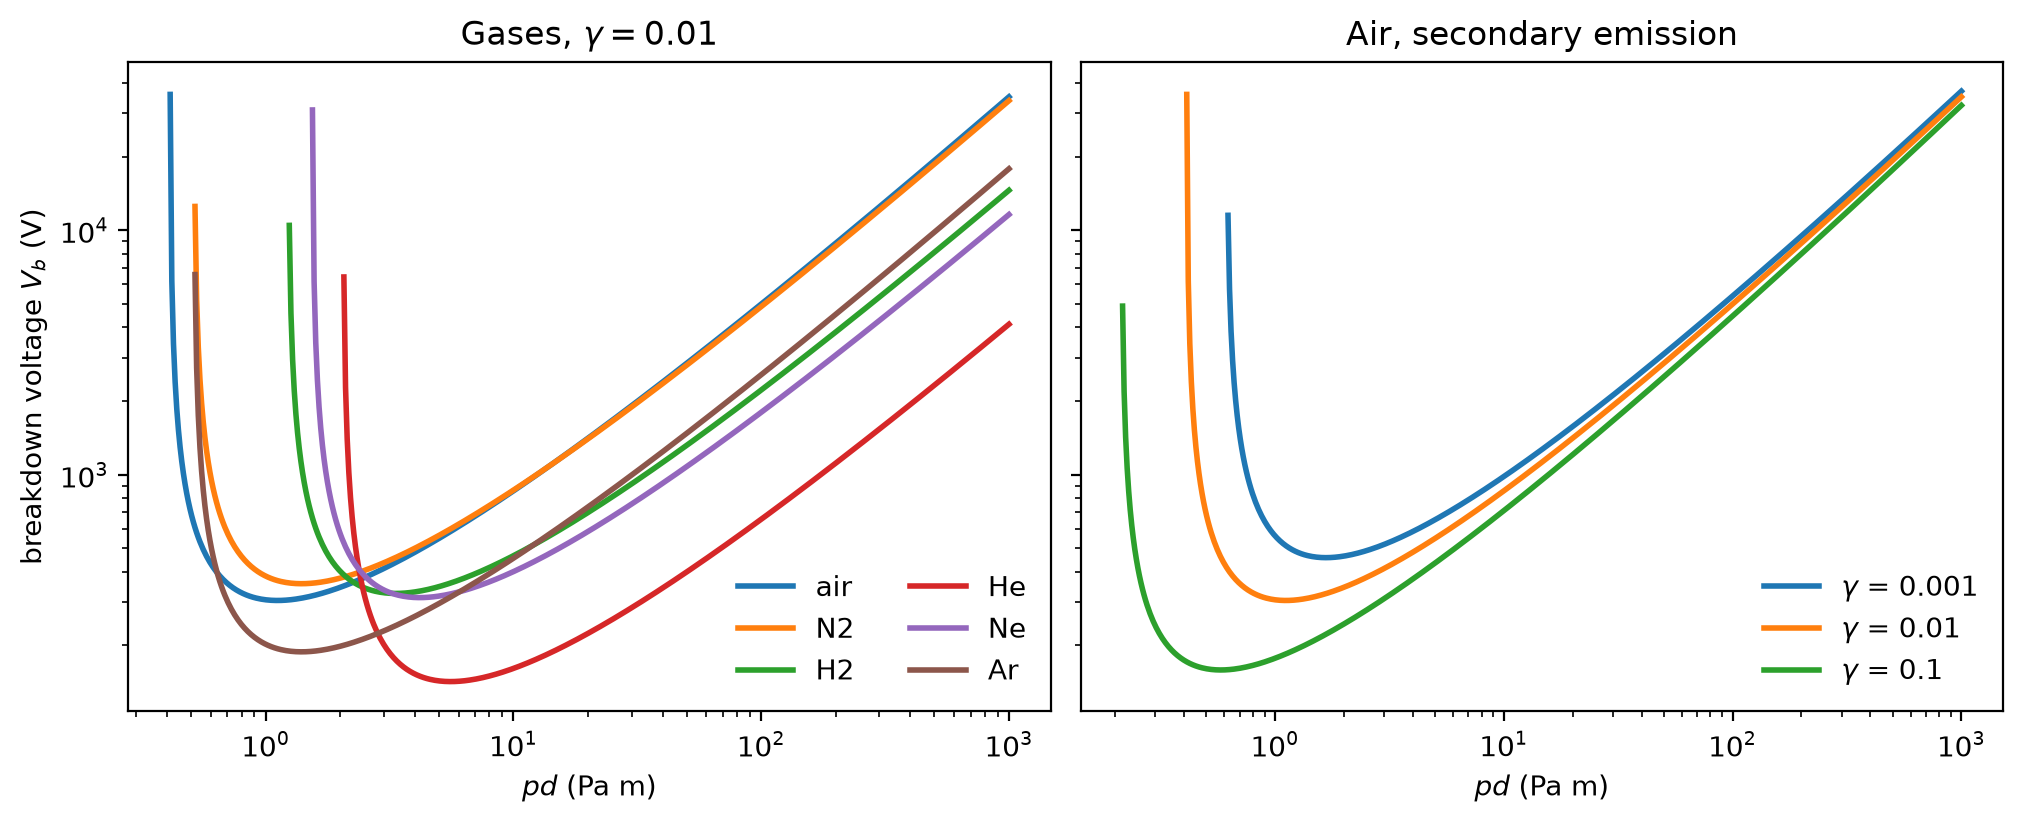
Breakdown voltage of a gas gap against the product of pressure and gap width, for several gases and cathode materials.
The breakdown voltage has a minimum near Pa m: to the right the electrons collide too often to gain energy, to the left too rarely to ionise. Left of the asymptote no voltage breaks the gap down. A lower secondary-emission coefficient raises the whole curve.
Source code
Section titled “Source code”import matplotlib.pyplot as pltimport numpy as np
from plasma_plots.theory import sheaths
gap = 1e-2 # mpd = np.geomspace(0.1, 1e3, 600) # Pa mpressure = pd / gap
fig, (ax_g, ax_s) = plt.subplots( 1, 2, figsize=(10, 4), layout="constrained", sharey=True)for gas in sheaths.PASCHEN_GASES: ax_g.loglog(pd, sheaths.paschen_breakdown(pressure, gap, gas=gas), lw=2, label=gas)ax_g.set( xlabel="$pd$ (Pa m)", ylabel=r"breakdown voltage $V_b$ (V)", title=r"Gases, $\gamma = 0.01$",)ax_g.legend(frameon=False, ncols=2)
for gamma in (0.001, 0.01, 0.1): ax_s.loglog( pd, sheaths.paschen_breakdown(pressure, gap, gas="air", secondary_emission=gamma), lw=2, label=rf"$\gamma$ = {gamma}", )ax_s.set(xlabel="$pd$ (Pa m)", title="Air, secondary emission")ax_s.legend(frameon=False)
v_air = sheaths.paschen_breakdown(pressure, gap, gas="air")i = np.nanargmin(v_air)print(f"Air minimum: {v_air[i]:.0f} V at pd = {pd[i]:.2f} Pa m")plt.show()Printed output
Air minimum: 305 V at pd = 1.12 Pa m