Gantt Charts
Gantt charts are useful for showing a project plan, a publication
timeline, or any other schedule organized along a numeric time axis.
tikzfigure provides a small structured wrapper around LaTeX’s
pgfgantt package.
The package is added automatically when you create a chart, so the same
figure can be exported with generate_standalone() or compiled with
show().
from tikzfigure import TikzFigureA simple project plan
Section titled “A simple project plan”Pass the first and last time slot to gantt() and describe rows with
small dictionaries. The supported row types are title, titlelist,
group, bar, milestone, link, and raw.
fig = TikzFigure()fig.gantt(    1,    12,    options=["hgrid", "vgrid"],    rows=[        {"type": "titlelist", "content": "1,2,3,4,5,6,7,8,9,10,11,12"},        {"type": "group", "content": "Discovery", "start": 1, "end": 3},        {"type": "bar", "content": "Research", "start": 1, "end": 2},        {"type": "bar", "content": "Requirements", "start": 2, "end": 3},        {"type": "group", "content": "Delivery", "start": 4, "end": 12},        {"type": "bar", "content": "Implementation", "start": 4, "end": 8},        {"type": "bar", "content": "Testing", "start": 8, "end": 10},        {"type": "milestone", "content": "Release", "at": 12},    ],)
print(fig.generate_tikz())
% --------------------------------------------- %% Tikzfigure generated by tikzfigure v0.3.1 %% https://github.com/max-models/tikzfigure %% --------------------------------------------- %\begin{tikzpicture} \begin{ganttchart}[hgrid, vgrid]{1}{12} \gantttitlelist{1,2,3,4,5,6,7,8,9,10,11,12}{1}\\ \ganttgroup{Discovery}{1}{3}\\ \ganttbar{Research}{1}{2}\\ \ganttbar{Requirements}{2}{3}\\ \ganttgroup{Delivery}{4}{12}\\ \ganttbar{Implementation}{4}{8}\\ \ganttbar{Testing}{8}{10}\\ \ganttmilestone{Release}{12}\\ \end{ganttchart}\end{tikzpicture}Call fig.show() in a notebook to compile and display the chart, or
save it with fig.savefig("project-plan.pdf").
Dependencies between tasks
Section titled “Dependencies between tasks”Give bars and milestones a name and connect them with link rows. The
names are passed to pgfgantt and are used by ganttlink.
fig = TikzFigure()chart = fig.add_gantt_chart(    1,    8,    options=["hgrid", "vgrid"],)
chart.add_row("titlelist", content="Jan,Feb,Mar,Apr,May,Jun,Jul,Aug", width=1)chart.add_row(    "bar",    content="Design",    start=1,    end=3,    name="design",    options=["progress=100"],)chart.add_row(    "bar",    content="Build",    start=3,    end=6,    name="build",    options=["progress=60"],)chart.add_row("milestone", content="Launch", at=8, name="launch")chart.add_row("link", source="design", target="build")chart.add_row("link", source="build", target="launch")
fig.show()
warning: The `fitz` API is deprecated and will be removed in future. Use `import pymupdf` instead.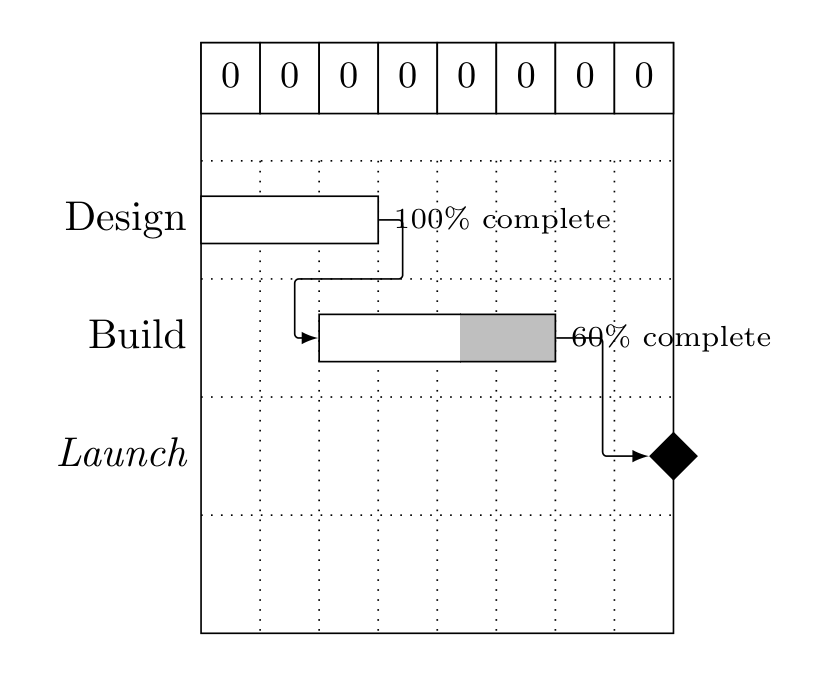
add_gantt_chart() is the explicit spelling; gantt() and
add_gantt() are short aliases. The returned GanttChart can be
extended incrementally with add_row(), which is convenient when rows
come from application data.
A multi-phase project timeline
Section titled “A multi-phase project timeline”This example mirrors a common plotting API: task names, starts, and durations are kept in parallel Python lists. Convert each phase into Gantt rows and use per-bar options to give the phases distinct colors.
phase1_tasks = ["Requirements", "Architecture", "UI Design"]phase1_starts = [0, 3, 6]phase1_durations = [3, 3, 4]
phase2_tasks = ["Backend Dev", "Frontend Dev", "Integration"]phase2_starts = [10, 10, 20]phase2_durations = [10, 10, 5]
phase3_tasks = ["Unit Tests", "Integration Tests", "UAT"]phase3_starts = [25, 28, 32]phase3_durations = [3, 4, 3]

def phase_rows(title, tasks, starts, durations, fill, draw):    rows = [{"type": "group", "content": title, "start": min(starts), "end": max(        start + duration for start, duration in zip(starts, durations)    )}]    rows.extend(        {            "type": "bar",            "content": task,            "start": start,            "end": start + duration,            "options": [f"fill={fill}", f"draw={draw}"],        }        for task, start, duration in zip(tasks, starts, durations)    )    return rows

rows = [{"type": "titlelist", "content": ",".join(str(i) for i in range(36))}]rows += phase_rows(    "Planning", phase1_tasks, phase1_starts, phase1_durations, "lightblue", "blue")rows += phase_rows(    "Development", phase2_tasks, phase2_starts, phase2_durations, "lightgreen", "green")rows += phase_rows(    "Testing", phase3_tasks, phase3_starts, phase3_durations, "lightyellow", "orange")
fig = TikzFigure()fig.gantt(0, 35, rows=rows, options=["hgrid", "vgrid", "bar height=.6"])fig.show()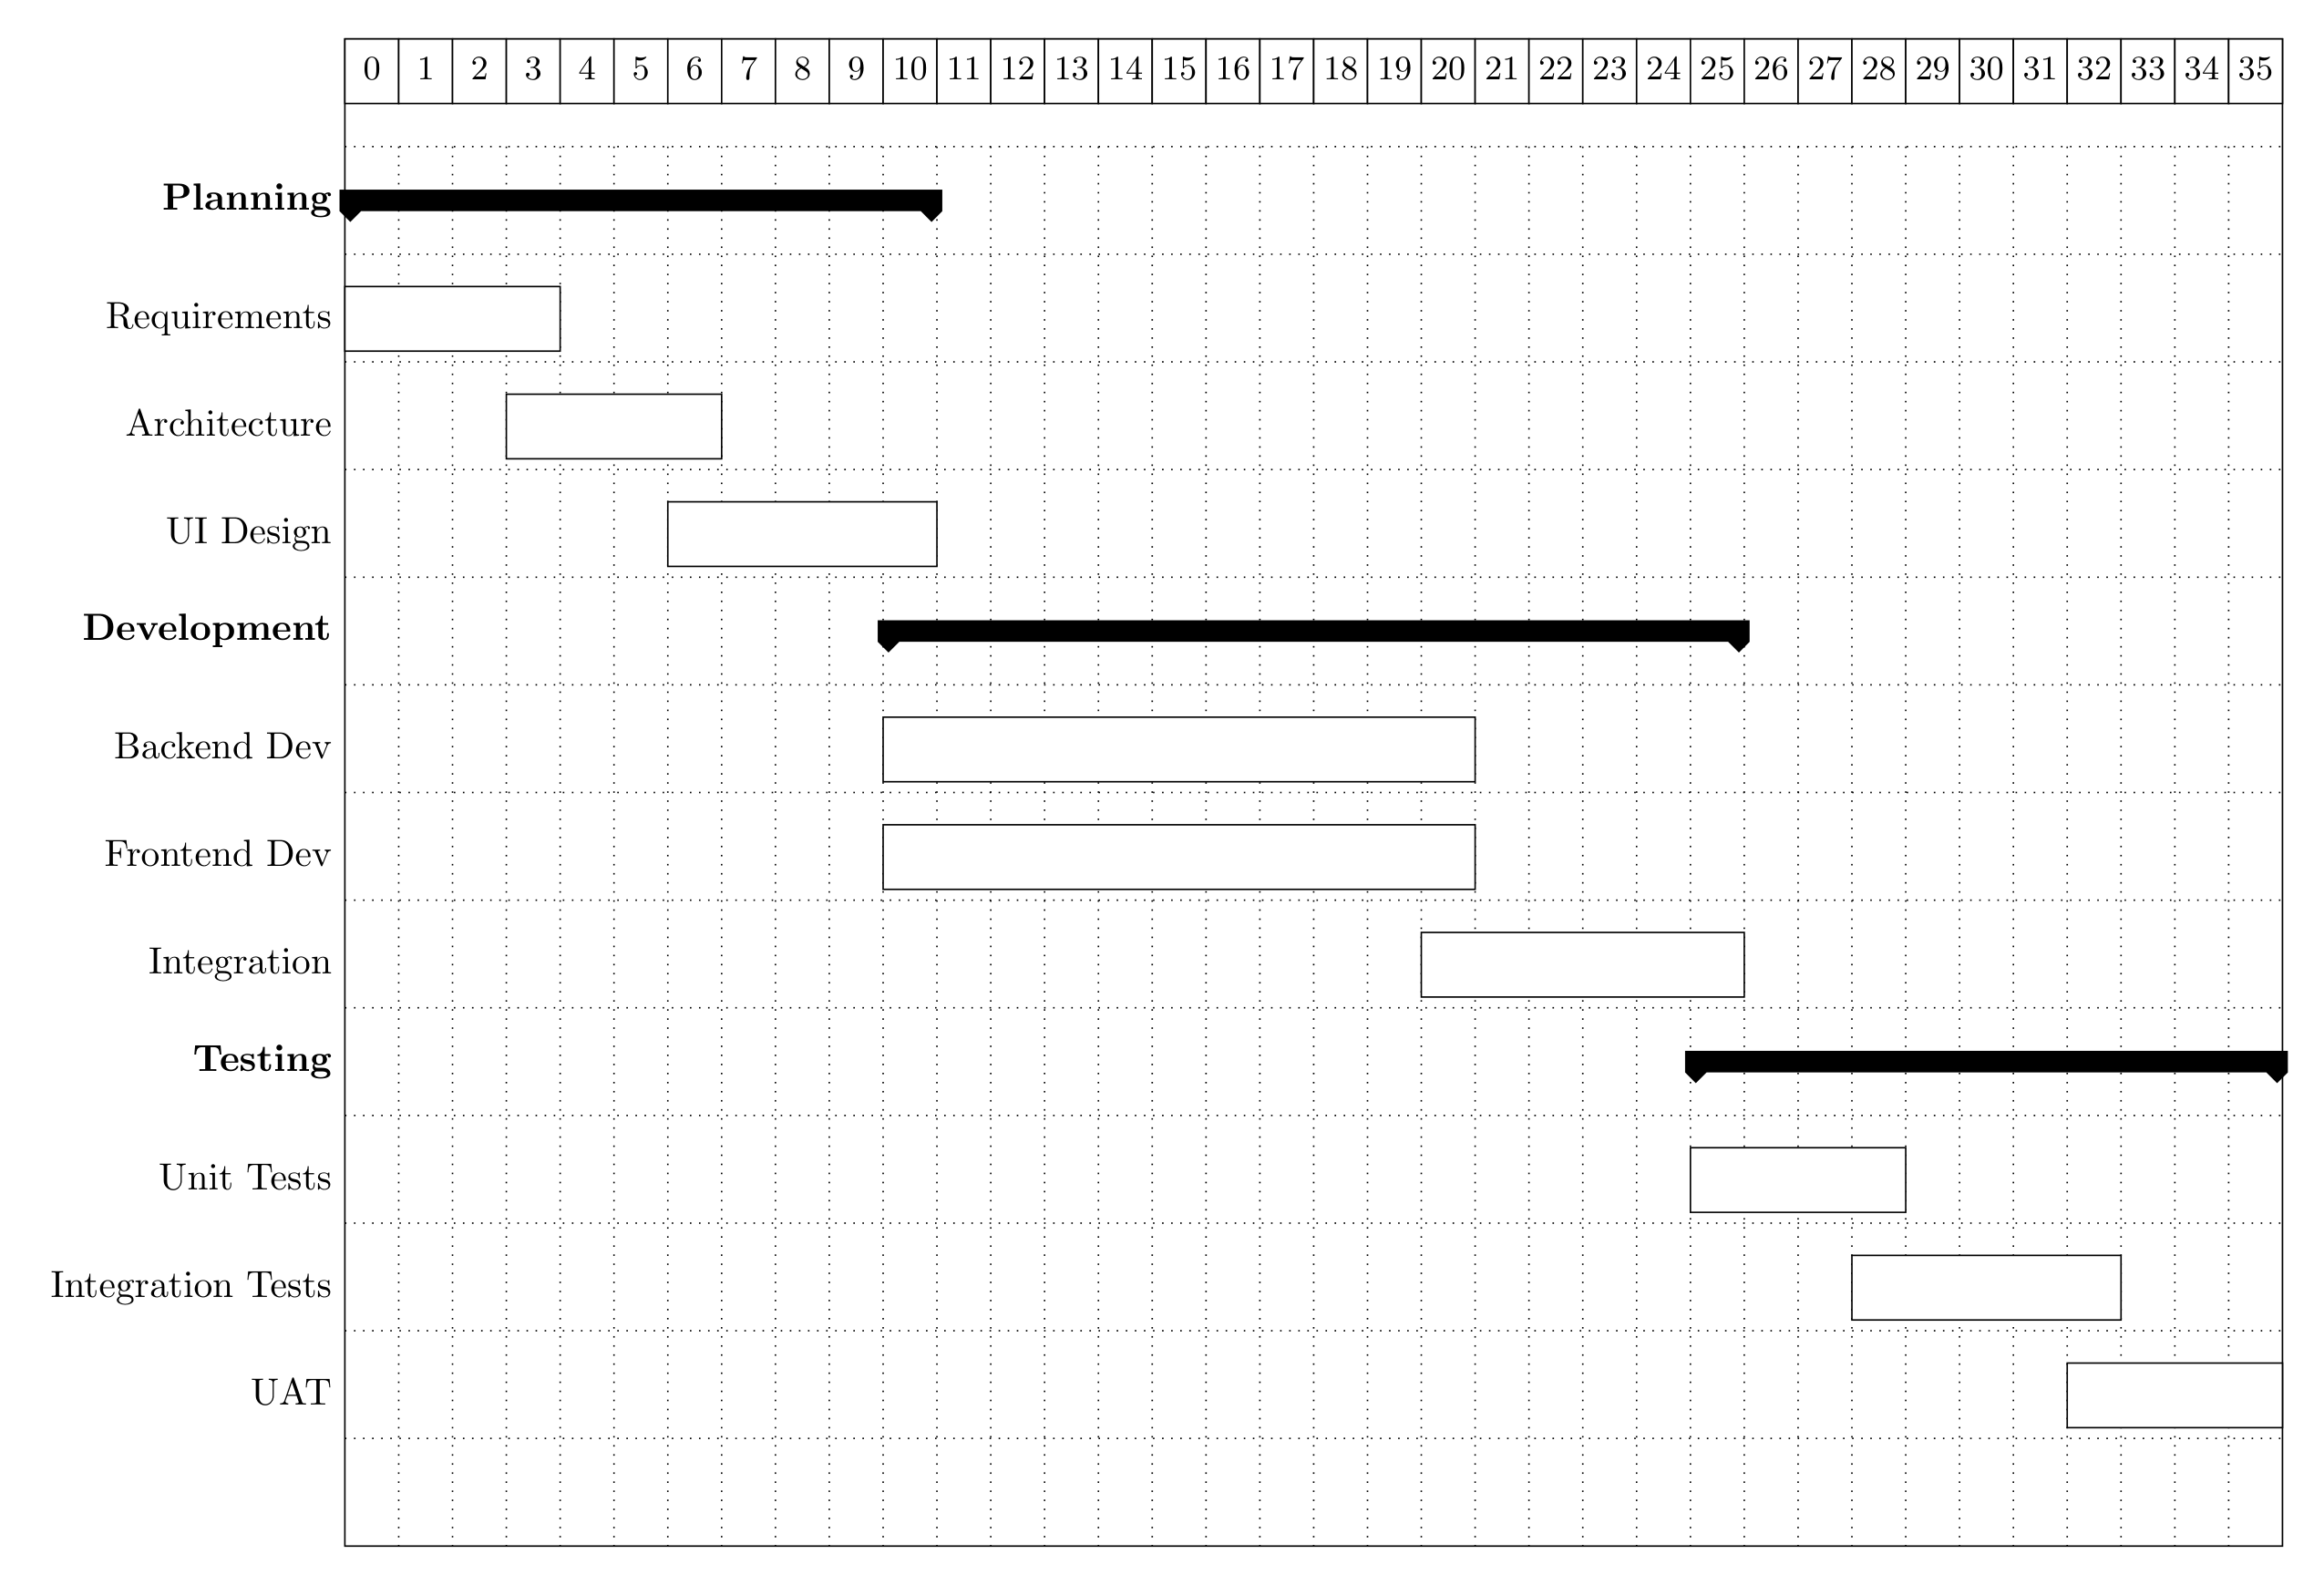
Team resource allocation
Section titled “Team resource allocation”The same row-building pattern works when each row represents a person rather than a project phase.
team_members = ["Alice", "Bob", "Charlie", "Diana", "Eve"]task_starts = [0, 5, 3, 8, 10]task_durations = [8, 6, 10, 7, 5]
team_rows = [{"type": "titlelist", "content": ",".join(str(i) for i in range(19))}]team_rows.extend(    {        "type": "bar",        "content": member,        "start": start,        "end": start + duration,        "options": ["fill=coral", "draw=darkred", "fill opacity=.7"],    }    for member, start, duration in zip(team_members, task_starts, task_durations))
fig = TikzFigure()fig.gantt(0, 18, rows=team_rows, options=["hgrid", "vgrid"])fig.show()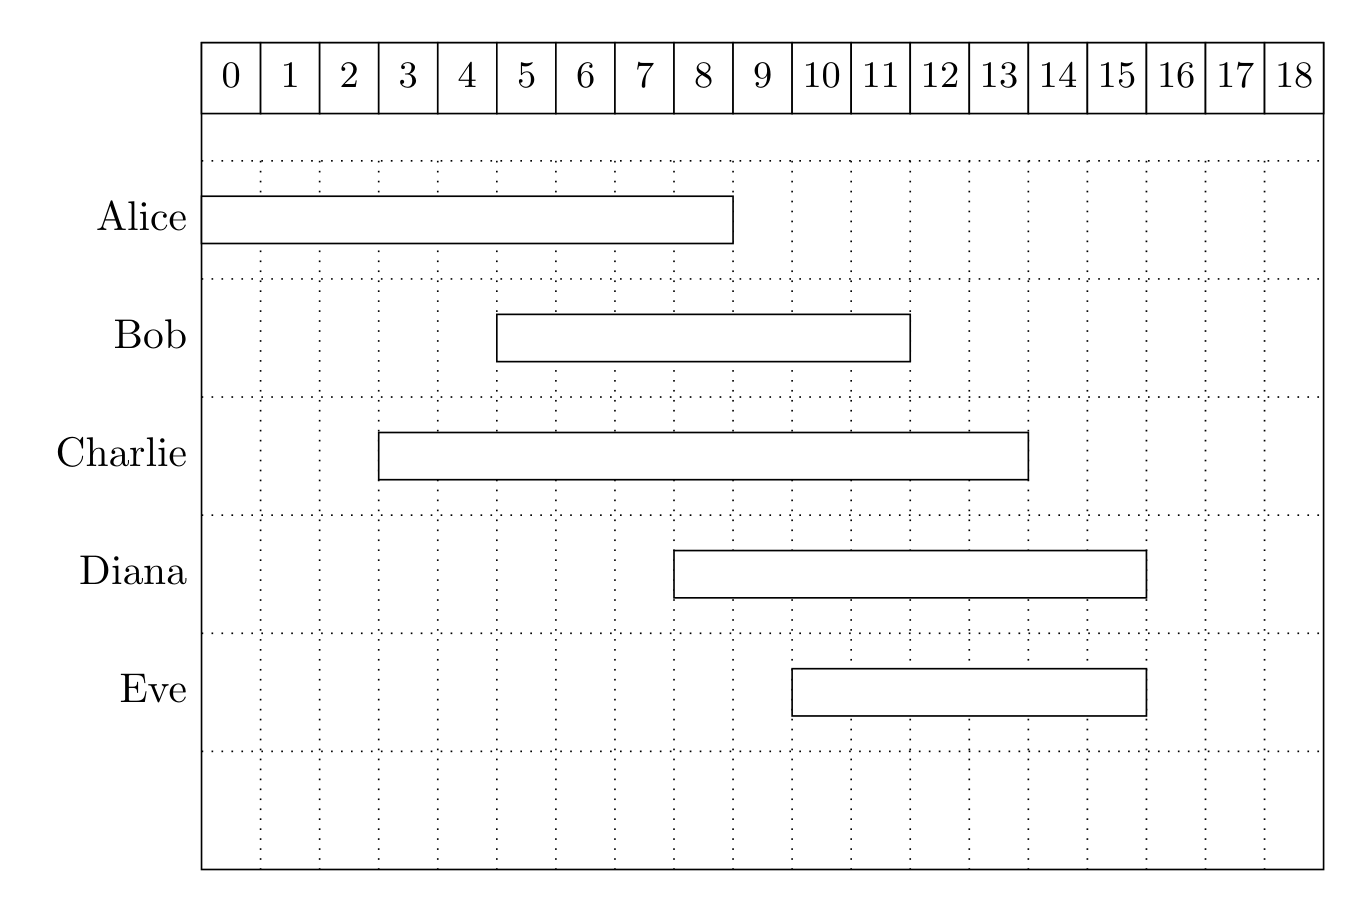
Rows are ordinary dictionaries, so they can be generated from CSV files,
database records, or any other application data. Use a raw row when a
pgfgantt command is not covered by the structured row types.