Raw TikZ
tikzfigure covers the most common TikZ operations through its Python
API, but TikZ is a vast language. fig.raw(string) injects an arbitrary
LaTeX/TikZ snippet directly into the generated code - giving you a full
escape hatch.
A key pattern: create nodes with the Python API (to get auto-generated
labels), then reference them in raw TikZ commands via {node.label}.
This tutorial covers: - basic raw insertion - flowcharts with decision diamonds - mathematical annotations and axis drawing - network graphs with curved edges - timeline visualizations
import math
from tikzfigure import TikzFigure
Basic raw insertion
Section titled “Basic raw insertion”Pass any TikZ string to raw. Node labels created by node can be
interpolated into the string.
fig = TikzFigure()
n1 = fig.node(    (0, 0),    shape="circle",    color="white",    fill="blue",    content="Hello!",)n2 = fig.node(    (5, 0),    shape="circle",    color="white",    fill="red",    content="Hi!",)
# A raw commentfig.raw("% --- raw TikZ below ---")
# A plain text node at a fixed coordinatefig.raw(    "\\node at (2.5, 1.2) {raw TikZ node};",)
# A dashed arrow referencing the Python-created node labelsfig.raw(    f"\\draw[->, thick, dashed] ({n2.label}) -- ({n1.label});",)
fig.show()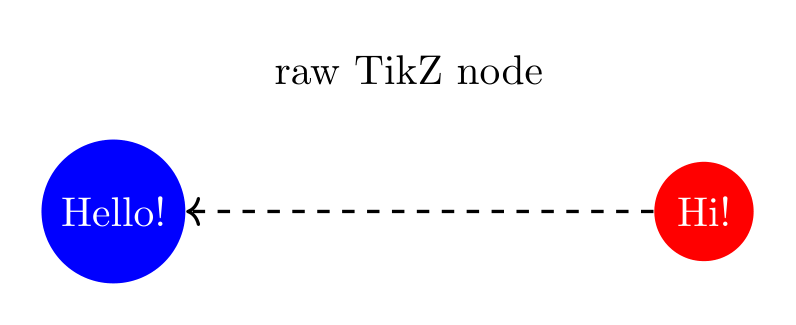
Show Tikz code
print(fig)% --------------------------------------------- %% Tikzfigure generated by tikzfigure v0.3.1 %% https://github.com/max-models/tikzfigure %% --------------------------------------------- %\begin{tikzpicture} \node[shape=circle, color=white, fill=blue] (node0) at ({0}, {0}) {Hello!}; \node[shape=circle, color=white, fill=red] (node1) at ({5}, {0}) {Hi!}; % --- raw TikZ below --- \node at (2.5, 1.2) {raw TikZ node}; \draw[->, thick, dashed] (node1) -- (node0);\end{tikzpicture}print(fig.generate_standalone())\documentclass[border=10pt]{standalone}\PassOptionsToPackage{dvipsnames,svgnames,x11names}{xcolor}\usepackage{tikz}\usepackage{pgfplots}\pgfplotsset{compat=newest}\usepgfplotslibrary{groupplots}\usetikzlibrary{arrows.meta}\begin{document}% --------------------------------------------- %% Tikzfigure generated by tikzfigure v0.3.1 %% https://github.com/max-models/tikzfigure %% --------------------------------------------- %\begin{tikzpicture} \node[shape=circle, color=white, fill=blue] (node0) at ({0}, {0}) {Hello!}; \node[shape=circle, color=white, fill=red] (node1) at ({5}, {0}) {Hi!}; % --- raw TikZ below --- \node at (2.5, 1.2) {raw TikZ node}; \draw[->, thick, dashed] (node1) -- (node0);\end{tikzpicture}
\end{document}Flowchart
Section titled “Flowchart”Flowcharts need diamond decision nodes and labelled arrows - both easy
with raw TikZ.
fig = TikzFigure()
start = fig.node(    (2, 4),    shape="ellipse",    fill="green!30",    content="Start",)process = fig.node(    (2, 2),    shape="rectangle",    fill="blue!20",    content="Process",)decision = fig.node(    (2, 0),    shape="diamond",    fill="orange!30",    content="Decision?",)yes_node = fig.node(    (0, -2),    shape="rectangle",    fill="red!20",    content="Action A",)no_node = fig.node(    (4, -2),    shape="rectangle",    fill="green!20",    content="Action B",)end = fig.node(    (2, -4),    shape="ellipse",    fill="red!30",    content="End",)
fig.raw(    f"\\draw[->, thick] ({start.label})    -- ({process.label});",)fig.raw(    f"\\draw[->, thick] ({process.label})  -- ({decision.label});",)fig.raw(    f"\\draw[->, thick] ({decision.label}) -- node[left]  {{Yes}} ({yes_node.label});",)fig.raw(    f"\\draw[->, thick] ({decision.label}) -- node[right] {{No}}  ({no_node.label});",)fig.raw(    f"\\draw[->, thick] ({yes_node.label}) -- ({end.label});",)fig.raw(    f"\\draw[->, thick] ({no_node.label})  -- ({end.label});",)
fig.show()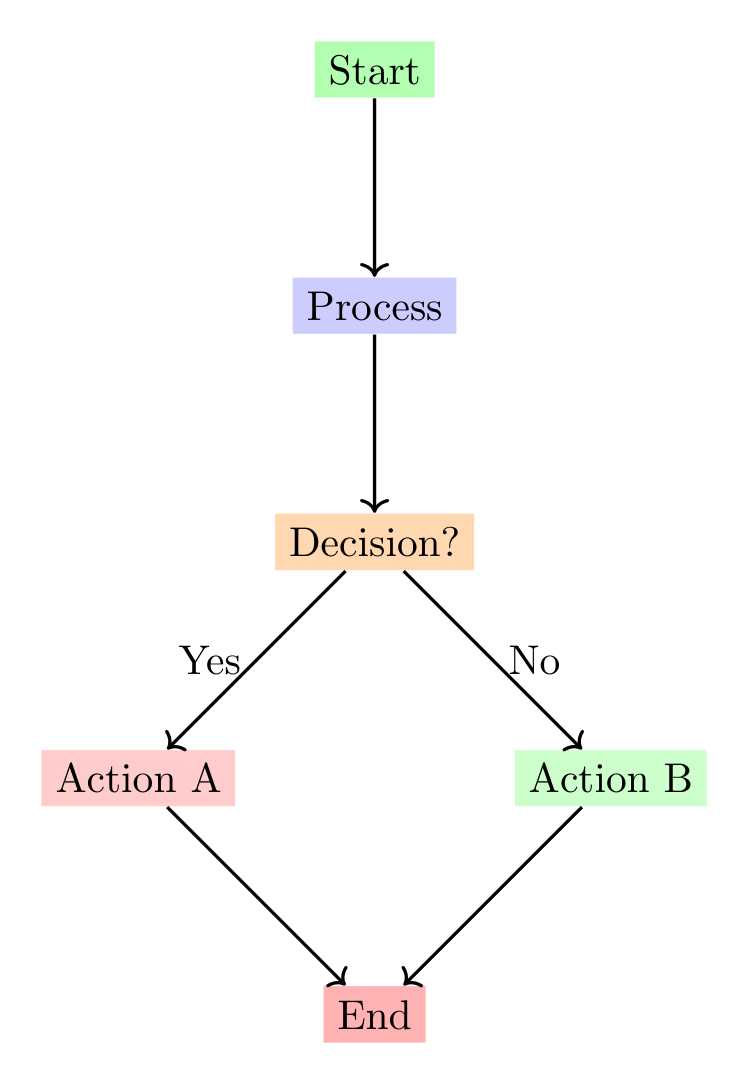
Show Tikz code
print(fig)% --------------------------------------------- %% Tikzfigure generated by tikzfigure v0.3.1 %% https://github.com/max-models/tikzfigure %% --------------------------------------------- %\begin{tikzpicture} \node[shape=ellipse, fill=green!30] (node0) at ({2}, {4}) {Start}; \node[shape=rectangle, fill=blue!20] (node1) at ({2}, {2}) {Process}; \node[shape=diamond, fill=orange!30] (node2) at ({2}, {0}) {Decision?}; \node[shape=rectangle, fill=red!20] (node3) at ({0}, {-2}) {Action A}; \node[shape=rectangle, fill=green!20] (node4) at ({4}, {-2}) {Action B}; \node[shape=ellipse, fill=red!30] (node5) at ({2}, {-4}) {End}; \draw[->, thick] (node0) -- (node1); \draw[->, thick] (node1) -- (node2); \draw[->, thick] (node2) -- node[left] {Yes} (node3); \draw[->, thick] (node2) -- node[right] {No} (node4); \draw[->, thick] (node3) -- (node5); \draw[->, thick] (node4) -- (node5);\end{tikzpicture}print(fig.generate_standalone())\documentclass[border=10pt]{standalone}\PassOptionsToPackage{dvipsnames,svgnames,x11names}{xcolor}\usepackage{tikz}\usepackage{pgfplots}\pgfplotsset{compat=newest}\usepgfplotslibrary{groupplots}\usetikzlibrary{arrows.meta}\begin{document}% --------------------------------------------- %% Tikzfigure generated by tikzfigure v0.3.1 %% https://github.com/max-models/tikzfigure %% --------------------------------------------- %\begin{tikzpicture} \node[shape=ellipse, fill=green!30] (node0) at ({2}, {4}) {Start}; \node[shape=rectangle, fill=blue!20] (node1) at ({2}, {2}) {Process}; \node[shape=diamond, fill=orange!30] (node2) at ({2}, {0}) {Decision?}; \node[shape=rectangle, fill=red!20] (node3) at ({0}, {-2}) {Action A}; \node[shape=rectangle, fill=green!20] (node4) at ({4}, {-2}) {Action B}; \node[shape=ellipse, fill=red!30] (node5) at ({2}, {-4}) {End}; \draw[->, thick] (node0) -- (node1); \draw[->, thick] (node1) -- (node2); \draw[->, thick] (node2) -- node[left] {Yes} (node3); \draw[->, thick] (node2) -- node[right] {No} (node4); \draw[->, thick] (node3) -- (node5); \draw[->, thick] (node4) -- (node5);\end{tikzpicture}
\end{document}Mathematical annotations and coordinate axes
Section titled “Mathematical annotations and coordinate axes”Raw TikZ handles axis arrows, tick marks, parabolas, and LaTeX math
($...$) naturally.
fig = TikzFigure()
p1 = fig.node((0, 0), content="")p2 = fig.node((3, 2), content="")p3 = fig.node((6, 0), content="")
fig.raw(    f"\\draw[thick, blue] ({p1.label}) parabola bend ({p2.label}) ({p3.label});",)fig.raw(    f"\\draw[->, dashed, red] ({p1.label}) -- ({p2.label}) node[midway, left=40pt] {{$\\Delta y$}};",)fig.raw(    f"\\draw[->, dashed, green!50!black] ({p1.label}) -- ({p3.label}) node[midway, below=10pt] {{$\\Delta x$}};",)fig.raw(    "\\node at (3, 3) {$y = ax^2 + bx + c$};",)
fig.raw(    "\\draw[->, thick] (-1, 0) -- (7, 0) node[right] {$x$};",)fig.raw(    "\\draw[->, thick] (0, -1) -- (0, 3.5) node[above] {$y$};",)
for i in range(1, 7):    fig.raw(        f"\\draw ({i}, -0.1) -- ({i}, 0.1) node[below=3pt] {{\\small {i}}};",    )
fig.show()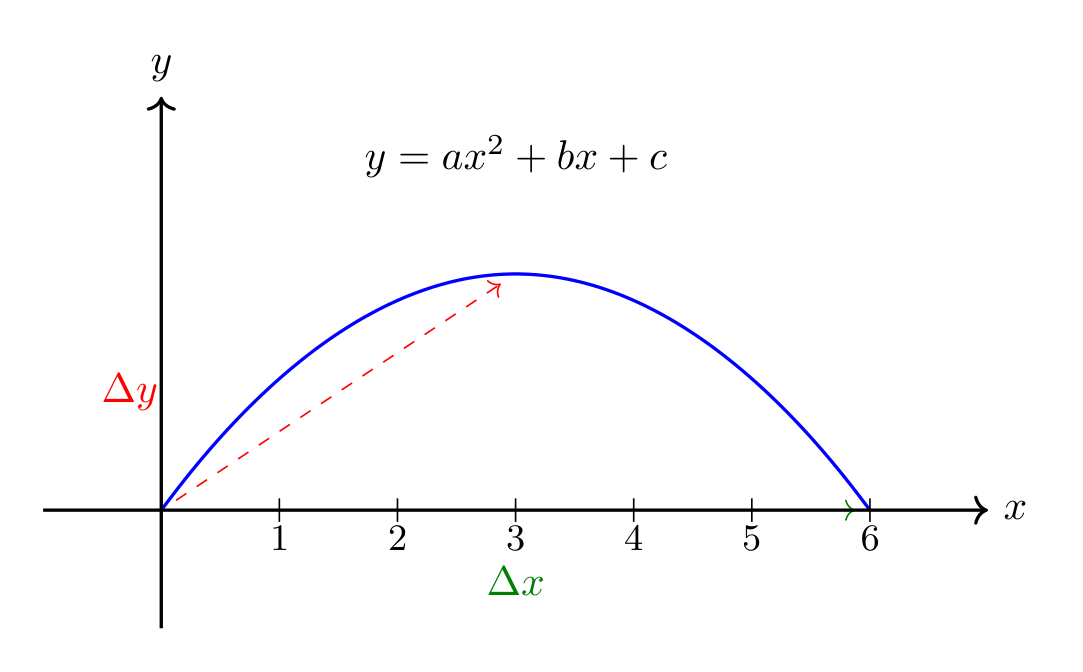
Show Tikz code
print(fig)% --------------------------------------------- %% Tikzfigure generated by tikzfigure v0.3.1 %% https://github.com/max-models/tikzfigure %% --------------------------------------------- %\begin{tikzpicture} \node (node0) at ({0}, {0}) {}; \node (node1) at ({3}, {2}) {}; \node (node2) at ({6}, {0}) {}; \draw[thick, blue] (node0) parabola bend (node1) (node2); \draw[->, dashed, red] (node0) -- (node1) node[midway, left=40pt] {$\Delta y$}; \draw[->, dashed, green!50!black] (node0) -- (node2) node[midway, below=10pt] {$\Delta x$}; \node at (3, 3) {$y = ax^2 + bx + c$}; \draw[->, thick] (-1, 0) -- (7, 0) node[right] {$x$}; \draw[->, thick] (0, -1) -- (0, 3.5) node[above] {$y$}; \draw (1, -0.1) -- (1, 0.1) node[below=3pt] {\small 1}; \draw (2, -0.1) -- (2, 0.1) node[below=3pt] {\small 2}; \draw (3, -0.1) -- (3, 0.1) node[below=3pt] {\small 3}; \draw (4, -0.1) -- (4, 0.1) node[below=3pt] {\small 4}; \draw (5, -0.1) -- (5, 0.1) node[below=3pt] {\small 5}; \draw (6, -0.1) -- (6, 0.1) node[below=3pt] {\small 6};\end{tikzpicture}print(fig.generate_standalone())\documentclass[border=10pt]{standalone}\PassOptionsToPackage{dvipsnames,svgnames,x11names}{xcolor}\usepackage{tikz}\usepackage{pgfplots}\pgfplotsset{compat=newest}\usepgfplotslibrary{groupplots}\usetikzlibrary{arrows.meta}\begin{document}% --------------------------------------------- %% Tikzfigure generated by tikzfigure v0.3.1 %% https://github.com/max-models/tikzfigure %% --------------------------------------------- %\begin{tikzpicture} \node (node0) at ({0}, {0}) {}; \node (node1) at ({3}, {2}) {}; \node (node2) at ({6}, {0}) {}; \draw[thick, blue] (node0) parabola bend (node1) (node2); \draw[->, dashed, red] (node0) -- (node1) node[midway, left=40pt] {$\Delta y$}; \draw[->, dashed, green!50!black] (node0) -- (node2) node[midway, below=10pt] {$\Delta x$}; \node at (3, 3) {$y = ax^2 + bx + c$}; \draw[->, thick] (-1, 0) -- (7, 0) node[right] {$x$}; \draw[->, thick] (0, -1) -- (0, 3.5) node[above] {$y$}; \draw (1, -0.1) -- (1, 0.1) node[below=3pt] {\small 1}; \draw (2, -0.1) -- (2, 0.1) node[below=3pt] {\small 2}; \draw (3, -0.1) -- (3, 0.1) node[below=3pt] {\small 3}; \draw (4, -0.1) -- (4, 0.1) node[below=3pt] {\small 4}; \draw (5, -0.1) -- (5, 0.1) node[below=3pt] {\small 5}; \draw (6, -0.1) -- (6, 0.1) node[below=3pt] {\small 6};\end{tikzpicture}
\end{document}Network graph with curved edges
Section titled “Network graph with curved edges”Nodes placed in a ring with bend left edges and some
cross-connections.
fig = TikzFigure()
n = 6R = 3nodes = []for i in range(n):    angle = 360 / n * i    x = R * math.cos(math.radians(angle))    y = R * math.sin(math.radians(angle))    nodes.append(        fig.node(            x,            y,            shape="circle",            fill="cyan!40",            content=f"N{i}",        ),    )
# Ringfor i in range(n):    j = (i + 1) % n    fig.raw(        f"\\draw[->, thick, bend left=15] ({nodes[i].label}) edge ({nodes[j].label});",    )
# Cross-connectionsfig.raw(    f"\\draw[->, red,              thick, dashed, bend right=30] ({nodes[0].label}) edge ({nodes[3].label});",)fig.raw(    f"\\draw[->, blue,             thick, dotted, bend left=30]  ({nodes[1].label}) edge ({nodes[4].label});",)fig.raw(    f"\\draw[->, green!60!black,   thick,         bend right=30] ({nodes[2].label}) edge ({nodes[5].label});",)
fig.raw(    "\\node[font=\\Large\\bfseries] at (0, 4.5) {Network Graph};",)
fig.show()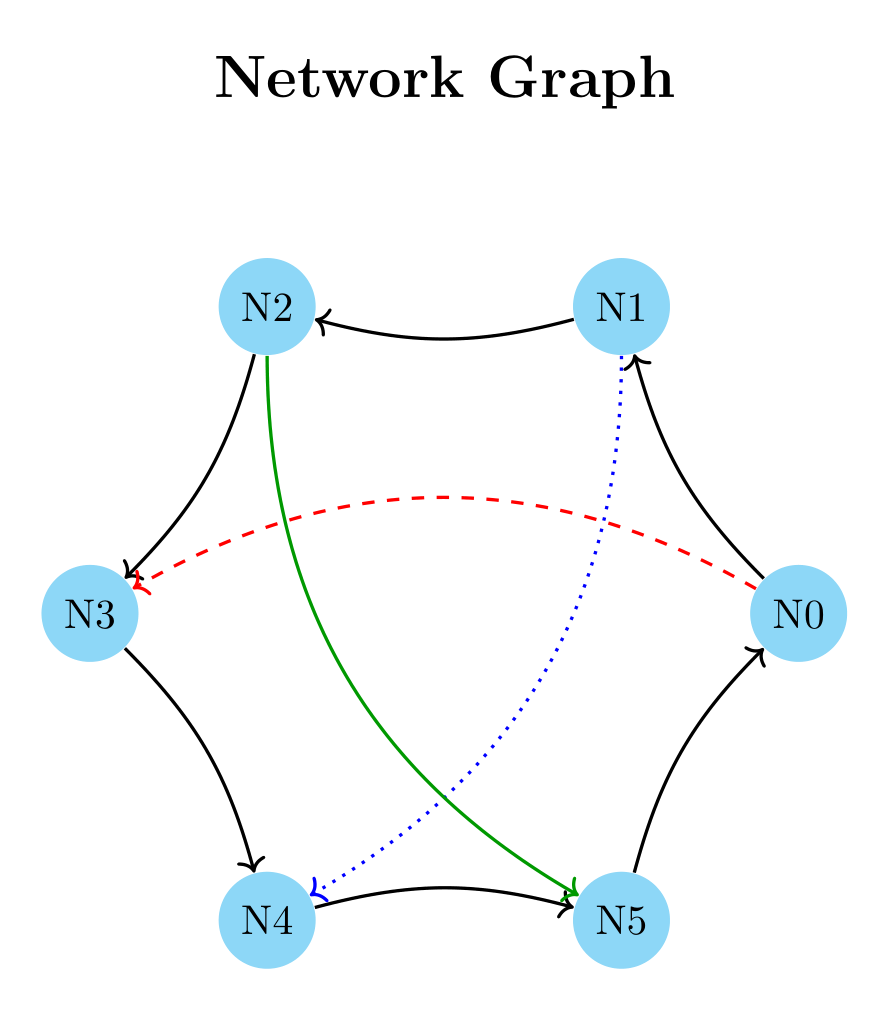
Show Tikz code
print(fig)% --------------------------------------------- %% Tikzfigure generated by tikzfigure v0.3.1 %% https://github.com/max-models/tikzfigure %% --------------------------------------------- %\begin{tikzpicture} \node[shape=circle, fill=cyan!40] (node0) at ({3.0}, {0.0}) {N0}; \node[shape=circle, fill=cyan!40] (node1) at ({1.5000000000000004}, {2.598076211353316}) {N1}; \node[shape=circle, fill=cyan!40] (node2) at ({-1.4999999999999993}, {2.598076211353316}) {N2}; \node[shape=circle, fill=cyan!40] (node3) at ({-3.0}, {3.6739403974420594e-16}) {N3}; \node[shape=circle, fill=cyan!40] (node4) at ({-1.5000000000000013}, {-2.598076211353315}) {N4}; \node[shape=circle, fill=cyan!40] (node5) at ({1.5000000000000004}, {-2.598076211353316}) {N5}; \draw[->, thick, bend left=15] (node0) edge (node1); \draw[->, thick, bend left=15] (node1) edge (node2); \draw[->, thick, bend left=15] (node2) edge (node3); \draw[->, thick, bend left=15] (node3) edge (node4); \draw[->, thick, bend left=15] (node4) edge (node5); \draw[->, thick, bend left=15] (node5) edge (node0); \draw[->, red, thick, dashed, bend right=30] (node0) edge (node3); \draw[->, blue, thick, dotted, bend left=30] (node1) edge (node4); \draw[->, green!60!black, thick, bend right=30] (node2) edge (node5); \node[font=\Large\bfseries] at (0, 4.5) {Network Graph};\end{tikzpicture}print(fig.generate_standalone())\documentclass[border=10pt]{standalone}\PassOptionsToPackage{dvipsnames,svgnames,x11names}{xcolor}\usepackage{tikz}\usepackage{pgfplots}\pgfplotsset{compat=newest}\usepgfplotslibrary{groupplots}\usetikzlibrary{arrows.meta}\begin{document}% --------------------------------------------- %% Tikzfigure generated by tikzfigure v0.3.1 %% https://github.com/max-models/tikzfigure %% --------------------------------------------- %\begin{tikzpicture} \node[shape=circle, fill=cyan!40] (node0) at ({3.0}, {0.0}) {N0}; \node[shape=circle, fill=cyan!40] (node1) at ({1.5000000000000004}, {2.598076211353316}) {N1}; \node[shape=circle, fill=cyan!40] (node2) at ({-1.4999999999999993}, {2.598076211353316}) {N2}; \node[shape=circle, fill=cyan!40] (node3) at ({-3.0}, {3.6739403974420594e-16}) {N3}; \node[shape=circle, fill=cyan!40] (node4) at ({-1.5000000000000013}, {-2.598076211353315}) {N4}; \node[shape=circle, fill=cyan!40] (node5) at ({1.5000000000000004}, {-2.598076211353316}) {N5}; \draw[->, thick, bend left=15] (node0) edge (node1); \draw[->, thick, bend left=15] (node1) edge (node2); \draw[->, thick, bend left=15] (node2) edge (node3); \draw[->, thick, bend left=15] (node3) edge (node4); \draw[->, thick, bend left=15] (node4) edge (node5); \draw[->, thick, bend left=15] (node5) edge (node0); \draw[->, red, thick, dashed, bend right=30] (node0) edge (node3); \draw[->, blue, thick, dotted, bend left=30] (node1) edge (node4); \draw[->, green!60!black, thick, bend right=30] (node2) edge (node5); \node[font=\Large\bfseries] at (0, 4.5) {Network Graph};\end{tikzpicture}
\end{document}Timeline
Section titled “Timeline”A horizontal timeline with event markers, year labels, and bracket annotations.
fig = TikzFigure()
events = [    (0, "2020", "Project Start", "blue!30"),    (2, "2021", "Alpha Release", "green!30"),    (4, "2022", "Beta Release", "yellow!40"),    (6, "2023", "v1.0", "orange!40"),    (8, "2024", "v2.0", "red!30"),]
fig.raw(    "\\draw[->, ultra thick, gray] (-0.5, 0) -- (8.5, 0) node[right] {Time};",)
for x, year, label, color in events:    event_node = fig.node(        (x, 1.2),        shape="rectangle",        fill=color,        content=label,        options=["rounded corners=3pt"],    )    fig.raw(        f"\\draw[thick] ({x}, 0) -- ({x}, 0.7);",    )    fig.raw(f"\\fill ({x}, 0) circle (0.1);")    fig.raw(        f"\\node[below] at ({x}, -0.3) {{\\textbf{{{year}}}}};",    )    fig.raw(        f"\\draw[->, dashed] ({x}, 0.7) -- ({event_node.label});",    )
fig.raw(    "\\node[font=\\Large\\bfseries] at (4, 2.5) {Project Timeline};",)fig.raw(    "\\draw[<->, red, thick] (0, -1) -- node[below] {4 years} (8, -1);",)
fig.show()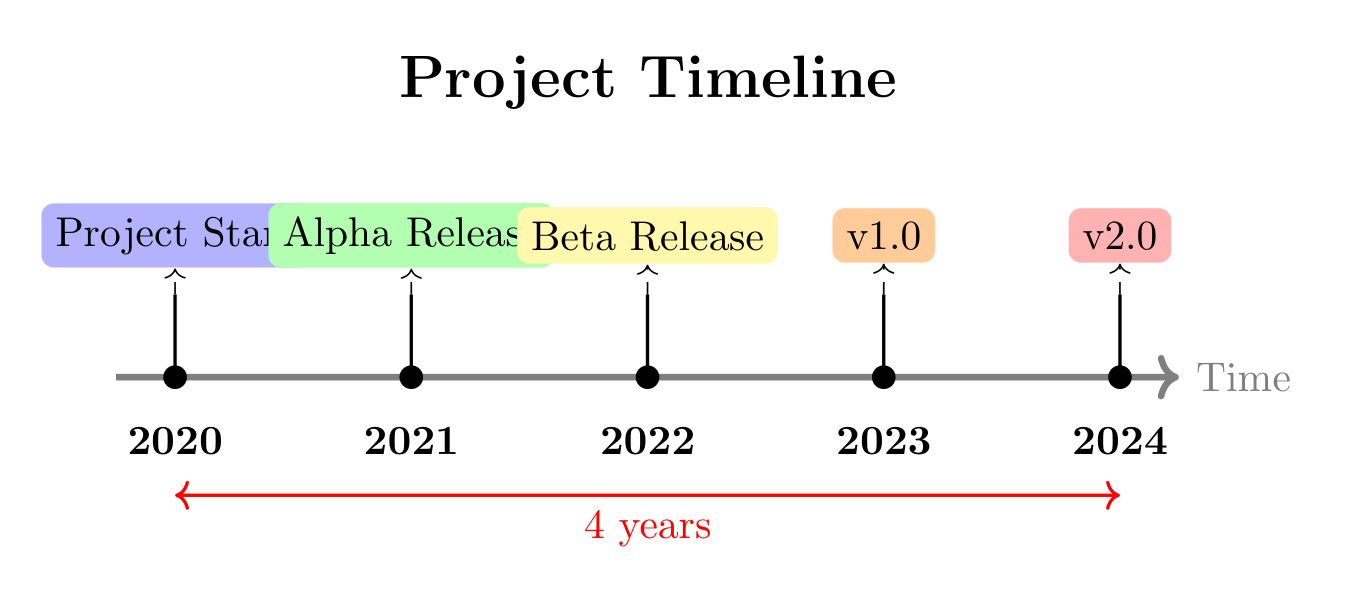
Show Tikz code
print(fig)% --------------------------------------------- %% Tikzfigure generated by tikzfigure v0.3.1 %% https://github.com/max-models/tikzfigure %% --------------------------------------------- %\begin{tikzpicture} \draw[->, ultra thick, gray] (-0.5, 0) -- (8.5, 0) node[right] {Time}; \node[rounded corners=3pt, shape=rectangle, fill=blue!30] (node0) at ({0}, {1.2}) {Project Start}; \draw[thick] (0, 0) -- (0, 0.7); \fill (0, 0) circle (0.1); \node[below] at (0, -0.3) {\textbf{2020}}; \draw[->, dashed] (0, 0.7) -- (node0); \node[rounded corners=3pt, shape=rectangle, fill=green!30] (node1) at ({2}, {1.2}) {Alpha Release}; \draw[thick] (2, 0) -- (2, 0.7); \fill (2, 0) circle (0.1); \node[below] at (2, -0.3) {\textbf{2021}}; \draw[->, dashed] (2, 0.7) -- (node1); \node[rounded corners=3pt, shape=rectangle, fill=yellow!40] (node2) at ({4}, {1.2}) {Beta Release}; \draw[thick] (4, 0) -- (4, 0.7); \fill (4, 0) circle (0.1); \node[below] at (4, -0.3) {\textbf{2022}}; \draw[->, dashed] (4, 0.7) -- (node2); \node[rounded corners=3pt, shape=rectangle, fill=orange!40] (node3) at ({6}, {1.2}) {v1.0}; \draw[thick] (6, 0) -- (6, 0.7); \fill (6, 0) circle (0.1); \node[below] at (6, -0.3) {\textbf{2023}}; \draw[->, dashed] (6, 0.7) -- (node3); \node[rounded corners=3pt, shape=rectangle, fill=red!30] (node4) at ({8}, {1.2}) {v2.0}; \draw[thick] (8, 0) -- (8, 0.7); \fill (8, 0) circle (0.1); \node[below] at (8, -0.3) {\textbf{2024}}; \draw[->, dashed] (8, 0.7) -- (node4); \node[font=\Large\bfseries] at (4, 2.5) {Project Timeline}; \draw[<->, red, thick] (0, -1) -- node[below] {4 years} (8, -1);\end{tikzpicture}print(fig.generate_standalone())\documentclass[border=10pt]{standalone}\PassOptionsToPackage{dvipsnames,svgnames,x11names}{xcolor}\usepackage{tikz}\usepackage{pgfplots}\pgfplotsset{compat=newest}\usepgfplotslibrary{groupplots}\usetikzlibrary{arrows.meta}\begin{document}% --------------------------------------------- %% Tikzfigure generated by tikzfigure v0.3.1 %% https://github.com/max-models/tikzfigure %% --------------------------------------------- %\begin{tikzpicture} \draw[->, ultra thick, gray] (-0.5, 0) -- (8.5, 0) node[right] {Time}; \node[rounded corners=3pt, shape=rectangle, fill=blue!30] (node0) at ({0}, {1.2}) {Project Start}; \draw[thick] (0, 0) -- (0, 0.7); \fill (0, 0) circle (0.1); \node[below] at (0, -0.3) {\textbf{2020}}; \draw[->, dashed] (0, 0.7) -- (node0); \node[rounded corners=3pt, shape=rectangle, fill=green!30] (node1) at ({2}, {1.2}) {Alpha Release}; \draw[thick] (2, 0) -- (2, 0.7); \fill (2, 0) circle (0.1); \node[below] at (2, -0.3) {\textbf{2021}}; \draw[->, dashed] (2, 0.7) -- (node1); \node[rounded corners=3pt, shape=rectangle, fill=yellow!40] (node2) at ({4}, {1.2}) {Beta Release}; \draw[thick] (4, 0) -- (4, 0.7); \fill (4, 0) circle (0.1); \node[below] at (4, -0.3) {\textbf{2022}}; \draw[->, dashed] (4, 0.7) -- (node2); \node[rounded corners=3pt, shape=rectangle, fill=orange!40] (node3) at ({6}, {1.2}) {v1.0}; \draw[thick] (6, 0) -- (6, 0.7); \fill (6, 0) circle (0.1); \node[below] at (6, -0.3) {\textbf{2023}}; \draw[->, dashed] (6, 0.7) -- (node3); \node[rounded corners=3pt, shape=rectangle, fill=red!30] (node4) at ({8}, {1.2}) {v2.0}; \draw[thick] (8, 0) -- (8, 0.7); \fill (8, 0) circle (0.1); \node[below] at (8, -0.3) {\textbf{2024}}; \draw[->, dashed] (8, 0.7) -- (node4); \node[font=\Large\bfseries] at (4, 2.5) {Project Timeline}; \draw[<->, red, thick] (0, -1) -- node[below] {4 years} (8, -1);\end{tikzpicture}
\end{document}