Styling: Colors, Shapes, and Line Styles
This tutorial explores the visual styling options available in tikzfigure: - node shapes - colors and color mixing - line styles and widths - arrow types - node anchors
from tikzfigure import TikzFigure, arrows, colors, styles, unitsDimension-like options can still be passed as plain strings such as
"1cm" or "4pt", but the units helpers make those values easier to
compose in Python: 1.0 * units.cm, 4 * units.pt, and so on.
Color options also accept objects from tikzfigure.colors, so you can
write colors.red, colors.process_blue, or xcolor-style mixes such as
colors.red.mix(colors.white) or colors.red.mix(colors.white, 0.25).
Node shapes
Section titled “Node shapes”The shape parameter accepts any TikZ node shape. Common built-in
shapes are circle, rectangle, ellipse, and diamond. The
minimum_size / minimum_width / minimum_height options control the
node size.
fig = TikzFigure()
fig.node(    (0, 0),    shape="circle",    fill="blue!30",    content="circle",)fig.node(    (3, 0),    shape="rectangle",    fill="red!30",    content="rectangle",)fig.node(    (6, 0),    shape="ellipse",    fill="green!30",    content="ellipse",)fig.node(    (9, 0),    shape="diamond",    fill="orange!30",    content="diamond",)
fig.show()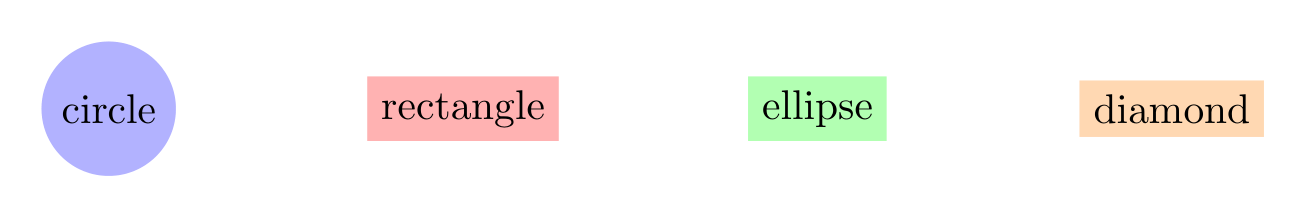
Show Tikz code
print(fig)% --------------------------------------------- %% Tikzfigure generated by tikzfigure v0.3.1 %% https://github.com/max-models/tikzfigure %% --------------------------------------------- %\begin{tikzpicture} \node[shape=circle, fill=blue!30] (node0) at ({0}, {0}) {circle}; \node[shape=rectangle, fill=red!30] (node1) at ({3}, {0}) {rectangle}; \node[shape=ellipse, fill=green!30] (node2) at ({6}, {0}) {ellipse}; \node[shape=diamond, fill=orange!30] (node3) at ({9}, {0}) {diamond};\end{tikzpicture}print(fig.generate_standalone())\documentclass[border=10pt]{standalone}\PassOptionsToPackage{dvipsnames,svgnames,x11names}{xcolor}\usepackage{tikz}\usepackage{pgfplots}\pgfplotsset{compat=newest}\usepgfplotslibrary{groupplots}\usetikzlibrary{arrows.meta}\begin{document}% --------------------------------------------- %% Tikzfigure generated by tikzfigure v0.3.1 %% https://github.com/max-models/tikzfigure %% --------------------------------------------- %\begin{tikzpicture} \node[shape=circle, fill=blue!30] (node0) at ({0}, {0}) {circle}; \node[shape=rectangle, fill=red!30] (node1) at ({3}, {0}) {rectangle}; \node[shape=ellipse, fill=green!30] (node2) at ({6}, {0}) {ellipse}; \node[shape=diamond, fill=orange!30] (node3) at ({9}, {0}) {diamond};\end{tikzpicture}
\end{document}Colors and color mixing
Section titled “Colors and color mixing”TikZ supports named colors (red, blue, green, …) and mix
expressions like red!50!white (50 % red + 50 % white). The colors
module gives you Python objects for common xcolor names, and .mix(...)
builds these expressions without manually assembling strings. You can
also define custom colors with fig.colorlet(name, expression).
fig = TikzFigure()
fig.colorlet("brandblue", colors.process_blue.mix(colors.white, 0.25))fig.colorlet("softmint", colors.green.mix(colors.white, 0.4))
swatches = [    colors.red,    colors.red.mix(colors.white),    colors.red.mix(colors.blue, 0.2),    colors.salmon,    "brandblue",    "softmint",    colors.cyan.mix(percent=0.6),    colors.purple,]
for i, color in enumerate(swatches):    fig.node(        (i * 3, 0),        shape="circle",        fill=color,        content="",        minimum_size=1.0 * units.cm,    )    fig.node(        (i * 3, -1),        content=f"\\texttt{{{color}}}",        draw="none",    )
fig.show()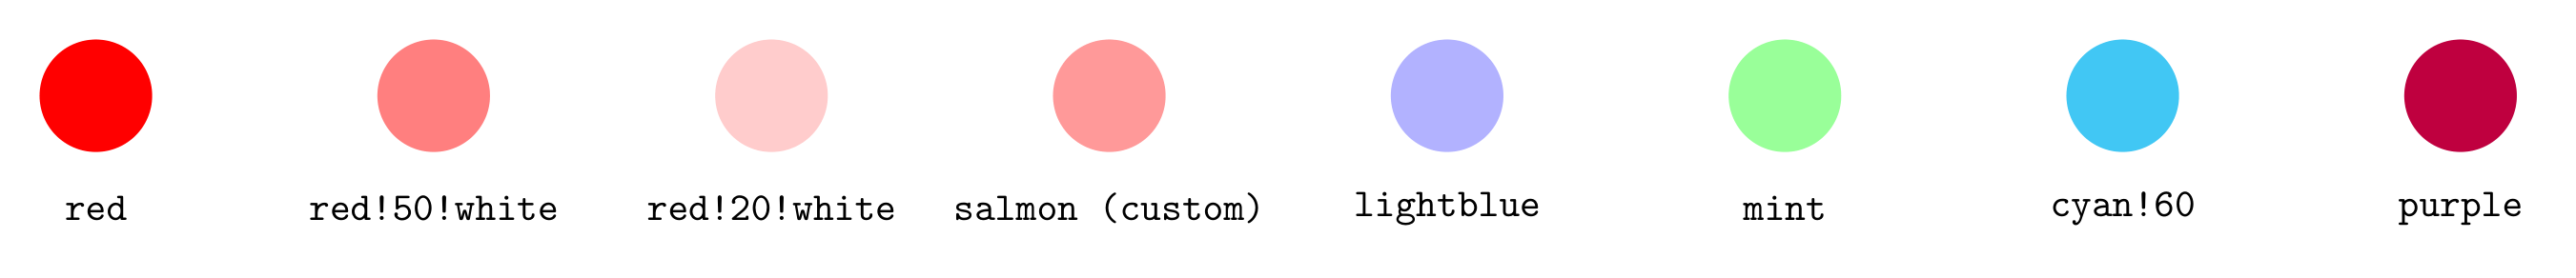
Show Tikz code
print(fig)% --------------------------------------------- %% Tikzfigure generated by tikzfigure v0.3.1 %% https://github.com/max-models/tikzfigure %% --------------------------------------------- %\begin{tikzpicture} \colorlet{brandblue}{ProcessBlue!25!white} \colorlet{softmint}{green!40!white} \node[shape=circle, fill=red, minimum size=1cm] (node0) at ({0}, {0}) {}; \node[draw=none] (node1) at ({0}, {-1}) {\texttt{red}}; \node[shape=circle, fill=red!50!white, minimum size=1cm] (node2) at ({3}, {0}) {}; \node[draw=none] (node3) at ({3}, {-1}) {\texttt{red!50!white}}; \node[shape=circle, fill=red!20!blue, minimum size=1cm] (node4) at ({6}, {0}) {}; \node[draw=none] (node5) at ({6}, {-1}) {\texttt{red!20!blue}}; \node[shape=circle, fill=Salmon, minimum size=1cm] (node6) at ({9}, {0}) {}; \node[draw=none] (node7) at ({9}, {-1}) {\texttt{Salmon}}; \node[shape=circle, fill=brandblue, minimum size=1cm] (node8) at ({12}, {0}) {}; \node[draw=none] (node9) at ({12}, {-1}) {\texttt{brandblue}}; \node[shape=circle, fill=softmint, minimum size=1cm] (node10) at ({15}, {0}) {}; \node[draw=none] (node11) at ({15}, {-1}) {\texttt{softmint}}; \node[shape=circle, fill=cyan!60, minimum size=1cm] (node12) at ({18}, {0}) {}; \node[draw=none] (node13) at ({18}, {-1}) {\texttt{cyan!60}}; \node[shape=circle, fill=purple, minimum size=1cm] (node14) at ({21}, {0}) {}; \node[draw=none] (node15) at ({21}, {-1}) {\texttt{purple}};\end{tikzpicture}print(fig.generate_standalone())\documentclass[border=10pt]{standalone}\PassOptionsToPackage{dvipsnames,svgnames,x11names}{xcolor}\usepackage{tikz}\usepackage{pgfplots}\pgfplotsset{compat=newest}\usepgfplotslibrary{groupplots}\usetikzlibrary{arrows.meta}\begin{document}% --------------------------------------------- %% Tikzfigure generated by tikzfigure v0.3.1 %% https://github.com/max-models/tikzfigure %% --------------------------------------------- %\begin{tikzpicture} \colorlet{brandblue}{ProcessBlue!25!white} \colorlet{softmint}{green!40!white} \node[shape=circle, fill=red, minimum size=1cm] (node0) at ({0}, {0}) {}; \node[draw=none] (node1) at ({0}, {-1}) {\texttt{red}}; \node[shape=circle, fill=red!50!white, minimum size=1cm] (node2) at ({3}, {0}) {}; \node[draw=none] (node3) at ({3}, {-1}) {\texttt{red!50!white}}; \node[shape=circle, fill=red!20!blue, minimum size=1cm] (node4) at ({6}, {0}) {}; \node[draw=none] (node5) at ({6}, {-1}) {\texttt{red!20!blue}}; \node[shape=circle, fill=Salmon, minimum size=1cm] (node6) at ({9}, {0}) {}; \node[draw=none] (node7) at ({9}, {-1}) {\texttt{Salmon}}; \node[shape=circle, fill=brandblue, minimum size=1cm] (node8) at ({12}, {0}) {}; \node[draw=none] (node9) at ({12}, {-1}) {\texttt{brandblue}}; \node[shape=circle, fill=softmint, minimum size=1cm] (node10) at ({15}, {0}) {}; \node[draw=none] (node11) at ({15}, {-1}) {\texttt{softmint}}; \node[shape=circle, fill=cyan!60, minimum size=1cm] (node12) at ({18}, {0}) {}; \node[draw=none] (node13) at ({18}, {-1}) {\texttt{cyan!60}}; \node[shape=circle, fill=purple, minimum size=1cm] (node14) at ({21}, {0}) {}; \node[draw=none] (node15) at ({21}, {-1}) {\texttt{purple}};\end{tikzpicture}
\end{document}Line styles
Section titled “Line styles”Paths accept TikZ style keywords as options: dashed, dotted,
thick, ultra thick, etc. The styles module gives you typed helpers
for these common option fragments.
fig = TikzFigure()
line_style_examples = [    ([], "plain"),    ([styles.dashed], "styles.dashed"),    ([styles.dotted], "styles.dotted"),    ([styles.thick], "styles.thick"),    ([styles.line_width(4 * units.pt)], "styles.line_width(4 * units.pt)"),    (        [styles.densely_dashed, styles.line_width(2 * units.pt)],        "styles.densely_dashed + line width",    ),]
for i, (opts, label) in enumerate(line_style_examples):    y = -i * 1.2    fig.draw(        [(0, y), (5, y)],        options=opts,        color="black",    )    fig.node(        5.1,        y,        content=f"\\texttt{{{label}}}",        draw="none",        anchor="west",    )fig.show()
Show Tikz code
print(fig)% --------------------------------------------- %% Tikzfigure generated by tikzfigure v0.3.1 %% https://github.com/max-models/tikzfigure %% --------------------------------------------- %\begin{tikzpicture} \draw[color=black] (0, 0.0) to (5, 0.0); \node[draw=none, anchor=west] (node0) at ({5.1}, {0.0}) {\texttt{plain}}; \draw[dashed, color=black] (0, -1.2) to (5, -1.2); \node[draw=none, anchor=west] (node1) at ({5.1}, {-1.2}) {\texttt{styles.dashed}}; \draw[dotted, color=black] (0, -2.4) to (5, -2.4); \node[draw=none, anchor=west] (node2) at ({5.1}, {-2.4}) {\texttt{styles.dotted}}; \draw[thick, color=black] (0, -3.5999999999999996) to (5, -3.5999999999999996); \node[draw=none, anchor=west] (node3) at ({5.1}, {-3.5999999999999996}) {\texttt{styles.thick}}; \draw[line width=4pt, color=black] (0, -4.8) to (5, -4.8); \node[draw=none, anchor=west] (node4) at ({5.1}, {-4.8}) {\texttt{styles.line_width(4 * units.pt)}}; \draw[densely dashed, line width=2pt, color=black] (0, -6.0) to (5, -6.0); \node[draw=none, anchor=west] (node5) at ({5.1}, {-6.0}) {\texttt{styles.densely_dashed + line width}};\end{tikzpicture}print(fig.generate_standalone())\documentclass[border=10pt]{standalone}\PassOptionsToPackage{dvipsnames,svgnames,x11names}{xcolor}\usepackage{tikz}\usepackage{pgfplots}\pgfplotsset{compat=newest}\usepgfplotslibrary{groupplots}\usetikzlibrary{arrows.meta}\begin{document}% --------------------------------------------- %% Tikzfigure generated by tikzfigure v0.3.1 %% https://github.com/max-models/tikzfigure %% --------------------------------------------- %\begin{tikzpicture} \draw[color=black] (0, 0.0) to (5, 0.0); \node[draw=none, anchor=west] (node0) at ({5.1}, {0.0}) {\texttt{plain}}; \draw[dashed, color=black] (0, -1.2) to (5, -1.2); \node[draw=none, anchor=west] (node1) at ({5.1}, {-1.2}) {\texttt{styles.dashed}}; \draw[dotted, color=black] (0, -2.4) to (5, -2.4); \node[draw=none, anchor=west] (node2) at ({5.1}, {-2.4}) {\texttt{styles.dotted}}; \draw[thick, color=black] (0, -3.5999999999999996) to (5, -3.5999999999999996); \node[draw=none, anchor=west] (node3) at ({5.1}, {-3.5999999999999996}) {\texttt{styles.thick}}; \draw[line width=4pt, color=black] (0, -4.8) to (5, -4.8); \node[draw=none, anchor=west] (node4) at ({5.1}, {-4.8}) {\texttt{styles.line_width(4 * units.pt)}}; \draw[densely dashed, line width=2pt, color=black] (0, -6.0) to (5, -6.0); \node[draw=none, anchor=west] (node5) at ({5.1}, {-6.0}) {\texttt{styles.densely_dashed + line width}};\end{tikzpicture}
\end{document}Arrow types
Section titled “Arrow types”Arrow direction and style are controlled via the arrows argument. The
arrows module gives you typed arrow-tip specifications instead of raw
strings.
fig = TikzFigure()
arrow_examples = [    (arrows.forward, "arrows.forward"),    (arrows.backward, "arrows.backward"),    (arrows.both, "arrows.both"),    (arrows.stealth, "arrows.stealth"),    (arrows.latex, "arrows.latex"),]
for i, (arrow, label) in enumerate(arrow_examples):    y = -i * 1.2    fig.draw(        [(0, y), (4, y)],        arrows=arrow,        line_width=1.5,        color="black",    )    fig.node(        5,        y,        content=f"\\texttt{{{label}}}",        draw="none",        anchor="west",    )
fig.show()
Show Tikz code
print(fig)% --------------------------------------------- %% Tikzfigure generated by tikzfigure v0.3.1 %% https://github.com/max-models/tikzfigure %% --------------------------------------------- %\begin{tikzpicture} \draw[->, color=black, line width=1.5] (0, 0.0) to (4, 0.0); \node[draw=none, anchor=west] (node0) at ({5}, {0.0}) {\texttt{arrows.forward}}; \draw[<-, color=black, line width=1.5] (0, -1.2) to (4, -1.2); \node[draw=none, anchor=west] (node1) at ({5}, {-1.2}) {\texttt{arrows.backward}}; \draw[<->, color=black, line width=1.5] (0, -2.4) to (4, -2.4); \node[draw=none, anchor=west] (node2) at ({5}, {-2.4}) {\texttt{arrows.both}}; \draw[-stealth, color=black, line width=1.5] (0, -3.5999999999999996) to (4, -3.5999999999999996); \node[draw=none, anchor=west] (node3) at ({5}, {-3.5999999999999996}) {\texttt{arrows.stealth}}; \draw[-latex, color=black, line width=1.5] (0, -4.8) to (4, -4.8); \node[draw=none, anchor=west] (node4) at ({5}, {-4.8}) {\texttt{arrows.latex}};\end{tikzpicture}print(fig.generate_standalone())\documentclass[border=10pt]{standalone}\PassOptionsToPackage{dvipsnames,svgnames,x11names}{xcolor}\usepackage{tikz}\usepackage{pgfplots}\pgfplotsset{compat=newest}\usepgfplotslibrary{groupplots}\usetikzlibrary{arrows.meta}\begin{document}% --------------------------------------------- %% Tikzfigure generated by tikzfigure v0.3.1 %% https://github.com/max-models/tikzfigure %% --------------------------------------------- %\begin{tikzpicture} \draw[->, color=black, line width=1.5] (0, 0.0) to (4, 0.0); \node[draw=none, anchor=west] (node0) at ({5}, {0.0}) {\texttt{arrows.forward}}; \draw[<-, color=black, line width=1.5] (0, -1.2) to (4, -1.2); \node[draw=none, anchor=west] (node1) at ({5}, {-1.2}) {\texttt{arrows.backward}}; \draw[<->, color=black, line width=1.5] (0, -2.4) to (4, -2.4); \node[draw=none, anchor=west] (node2) at ({5}, {-2.4}) {\texttt{arrows.both}}; \draw[-stealth, color=black, line width=1.5] (0, -3.5999999999999996) to (4, -3.5999999999999996); \node[draw=none, anchor=west] (node3) at ({5}, {-3.5999999999999996}) {\texttt{arrows.stealth}}; \draw[-latex, color=black, line width=1.5] (0, -4.8) to (4, -4.8); \node[draw=none, anchor=west] (node4) at ({5}, {-4.8}) {\texttt{arrows.latex}};\end{tikzpicture}
\end{document}Node anchors
Section titled “Node anchors”When placing a node at a coordinate, the anchor option controls which
part of the node sits at that point. The default is center. Useful
values: center, north, south, east, west, north west,
north east, south east, south west.
# Let's try to reproduce this: https://rmwu.github.io/tutorial/latex/2019/11/21/positioning/
fig = TikzFigure(    figure_setup="every node/.append style={draw, minimum size=0.8cm}",)
fig.node(    (0, 0),    draw="none",    content="\\textbullet",    comment="center",)fig.node((0, 0))fig.node(    (0, 0),    options="anchor=center, label=below:{{center}}",)
fig.node(    (2, 0),    draw="none",    content="\\textbullet",    comment="West and east",)fig.node(    (2, 0),    anchor="west",    content="west",)fig.node(    (2, 0),    anchor="east",    content="east",)

fig.node(    (4, 0),    draw="none",    content="\\textbullet",    comment="North and south",)fig.node(    (4, 0),    anchor="north",    content="north",)fig.node(    (4, 0),    anchor="south",    content="south",)
fig.node(    (6, 0),    draw="none",    content="\\textbullet",    comment="NW, NE, SE, and SW",)fig.node(    (6, 0),    anchor="north west",    content="nw",)fig.node(    (6, 0),    anchor="north east",    content="ne",)fig.node(    (6, 0),    anchor="south east",    content="se",)fig.node(    (6, 0),    anchor="south west",    content="sw",)
fig.show()
Show Tikz code
print(fig)% --------------------------------------------- %% Tikzfigure generated by tikzfigure v0.3.1 %% https://github.com/max-models/tikzfigure %% --------------------------------------------- %\begin{tikzpicture}[every node/.append style={draw, minimum size=0.8cm}] % center \node[draw=none] (node0) at ({0}, {0}) {\textbullet}; \node (node1) at ({0}, {0}) {}; \node[anchor=center, label=below:{{center}}] (node2) at ({0}, {0}) {}; % West and east \node[draw=none] (node3) at ({2}, {0}) {\textbullet}; \node[anchor=west] (node4) at ({2}, {0}) {west}; \node[anchor=east] (node5) at ({2}, {0}) {east}; % North and south \node[draw=none] (node6) at ({4}, {0}) {\textbullet}; \node[anchor=north] (node7) at ({4}, {0}) {north}; \node[anchor=south] (node8) at ({4}, {0}) {south}; % NW, NE, SE, and SW \node[draw=none] (node9) at ({6}, {0}) {\textbullet}; \node[anchor=north west] (node10) at ({6}, {0}) {nw}; \node[anchor=north east] (node11) at ({6}, {0}) {ne}; \node[anchor=south east] (node12) at ({6}, {0}) {se}; \node[anchor=south west] (node13) at ({6}, {0}) {sw};\end{tikzpicture}print(fig.generate_standalone())\documentclass[border=10pt]{standalone}\PassOptionsToPackage{dvipsnames,svgnames,x11names}{xcolor}\usepackage{tikz}\usepackage{pgfplots}\pgfplotsset{compat=newest}\usepgfplotslibrary{groupplots}\usetikzlibrary{arrows.meta}\begin{document}% --------------------------------------------- %% Tikzfigure generated by tikzfigure v0.3.1 %% https://github.com/max-models/tikzfigure %% --------------------------------------------- %\begin{tikzpicture}[every node/.append style={draw, minimum size=0.8cm}] % center \node[draw=none] (node0) at ({0}, {0}) {\textbullet}; \node (node1) at ({0}, {0}) {}; \node[anchor=center, label=below:{{center}}] (node2) at ({0}, {0}) {}; % West and east \node[draw=none] (node3) at ({2}, {0}) {\textbullet}; \node[anchor=west] (node4) at ({2}, {0}) {west}; \node[anchor=east] (node5) at ({2}, {0}) {east}; % North and south \node[draw=none] (node6) at ({4}, {0}) {\textbullet}; \node[anchor=north] (node7) at ({4}, {0}) {north}; \node[anchor=south] (node8) at ({4}, {0}) {south}; % NW, NE, SE, and SW \node[draw=none] (node9) at ({6}, {0}) {\textbullet}; \node[anchor=north west] (node10) at ({6}, {0}) {nw}; \node[anchor=north east] (node11) at ({6}, {0}) {ne}; \node[anchor=south east] (node12) at ({6}, {0}) {se}; \node[anchor=south west] (node13) at ({6}, {0}) {sw};\end{tikzpicture}
\end{document}Putting it together: Olympic rings
Section titled “Putting it together: Olympic rings”Five thick rings in the classic Olympic layout with correct interlocking overlaps. The weave order is Blue > Yellow > Black > Green > Red: at each crossing the “greater” ring appears in front.
-
- The full rings are drawn in layer 0.
-
- The overlapping crossings are drawn as arcs on top of the full rings in layer 1.
import math
fig = TikzFigure()
r = 1.0lw = 5 * units.pt
ring_specs = [    ((0, 0), (330, 360), "blue"),    ((1.25, -1.25), (60, 90), "yellow!80!black"),    ((2.5, 0), (330, 360), "black"),    ((3.75, -1.25), (60, 90), "green!60!black"),    ((5, 0), (None, None), "red"),]

def arc_seg(center, radius, start_angle, end_angle, color):    """Draw an arc on the circle centered at `center`."""    cx, cy = center    sx = cx + radius * math.cos(math.radians(start_angle))    sy = cy + radius * math.sin(math.radians(start_angle))    fig.arc(        start=(sx, sy),        start_angle=start_angle,        end_angle=end_angle,        radius=radius * units.cm,        color=color,        line_width=lw,        layer=1,    )

for (cx, cy), (start_angle, end_angle), color in ring_specs:    fig.circle(        center=(cx, cy),        radius=r * units.cm,        color=color,        line_width=lw,        layer=0,    )    if start_angle is not None and end_angle is not None:        arc_seg(            (cx, cy),            r,            start_angle,            end_angle,            color,        )
fig.show()
print(fig)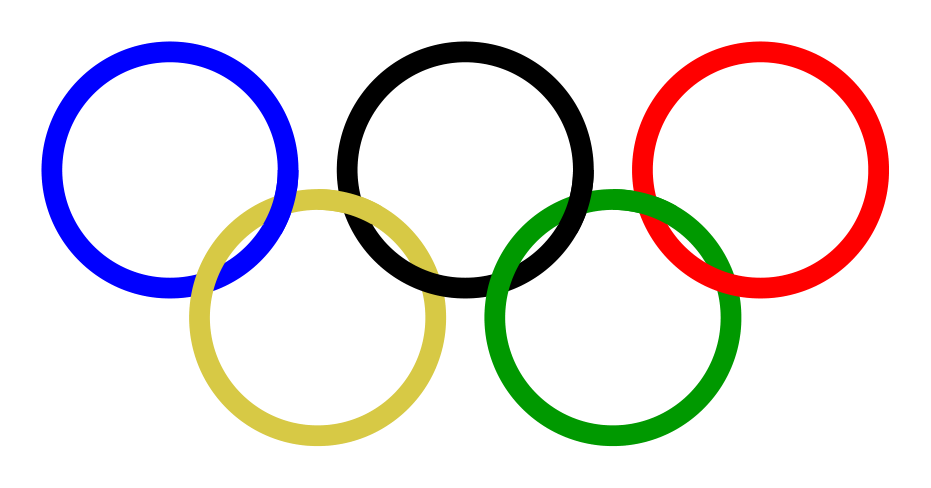
% --------------------------------------------- %% Tikzfigure generated by tikzfigure v0.3.1     %% https://github.com/max-models/tikzfigure      %% --------------------------------------------- %\begin{tikzpicture}    % Define the layers library    \pgfdeclarelayer{0}    \pgfdeclarelayer{1}    \pgfsetlayers{0,1}
    % Layer 0    \begin{pgfonlayer}{0}        \draw[color=blue, line width=5pt] ({0}, {0}) circle (1cm);        \draw[color=yellow!80!black, line width=5pt] ({1.25}, {-1.25}) circle (1cm);        \draw[color=black, line width=5pt] ({2.5}, {0}) circle (1cm);        \draw[color=green!60!black, line width=5pt] ({3.75}, {-1.25}) circle (1cm);        \draw[color=red, line width=5pt] ({5}, {0}) circle (1cm);    \end{pgfonlayer}{0}
    % Layer 1    \begin{pgfonlayer}{1}        \draw[color=blue, line width=5pt, start angle=330, end angle=360, radius=1cm] ({0.8660254037844384}, {-0.5000000000000004}) arc;        \draw[color=yellow!80!black, line width=5pt, start angle=60, end angle=90, radius=1cm] ({1.75}, {-0.3839745962155614}) arc;        \draw[color=black, line width=5pt, start angle=330, end angle=360, radius=1cm] ({3.3660254037844384}, {-0.5000000000000004}) arc;        \draw[color=green!60!black, line width=5pt, start angle=60, end angle=90, radius=1cm] ({4.25}, {-0.3839745962155614}) arc;    \end{pgfonlayer}{1}\end{tikzpicture}
Show Tikz code
print(fig)% --------------------------------------------- %% Tikzfigure generated by tikzfigure v0.3.1 %% https://github.com/max-models/tikzfigure %% --------------------------------------------- %\begin{tikzpicture} % Define the layers library \pgfdeclarelayer{0} \pgfdeclarelayer{1} \pgfsetlayers{0,1}
% Layer 0 \begin{pgfonlayer}{0} \draw[color=blue, line width=5pt] ({0}, {0}) circle (1cm); \draw[color=yellow!80!black, line width=5pt] ({1.25}, {-1.25}) circle (1cm); \draw[color=black, line width=5pt] ({2.5}, {0}) circle (1cm); \draw[color=green!60!black, line width=5pt] ({3.75}, {-1.25}) circle (1cm); \draw[color=red, line width=5pt] ({5}, {0}) circle (1cm); \end{pgfonlayer}{0}
% Layer 1 \begin{pgfonlayer}{1} \draw[color=blue, line width=5pt, start angle=330, end angle=360, radius=1cm] ({0.8660254037844384}, {-0.5000000000000004}) arc; \draw[color=yellow!80!black, line width=5pt, start angle=60, end angle=90, radius=1cm] ({1.75}, {-0.3839745962155614}) arc; \draw[color=black, line width=5pt, start angle=330, end angle=360, radius=1cm] ({3.3660254037844384}, {-0.5000000000000004}) arc; \draw[color=green!60!black, line width=5pt, start angle=60, end angle=90, radius=1cm] ({4.25}, {-0.3839745962155614}) arc; \end{pgfonlayer}{1}\end{tikzpicture}print(fig.generate_standalone())\documentclass[border=10pt]{standalone}\PassOptionsToPackage{dvipsnames,svgnames,x11names}{xcolor}\usepackage{tikz}\usepackage{pgfplots}\pgfplotsset{compat=newest}\usepgfplotslibrary{groupplots}\usetikzlibrary{arrows.meta}\begin{document}% --------------------------------------------- %% Tikzfigure generated by tikzfigure v0.3.1 %% https://github.com/max-models/tikzfigure %% --------------------------------------------- %\begin{tikzpicture} % Define the layers library \pgfdeclarelayer{0} \pgfdeclarelayer{1} \pgfsetlayers{0,1}
% Layer 0 \begin{pgfonlayer}{0} \draw[color=blue, line width=5pt] ({0}, {0}) circle (1cm); \draw[color=yellow!80!black, line width=5pt] ({1.25}, {-1.25}) circle (1cm); \draw[color=black, line width=5pt] ({2.5}, {0}) circle (1cm); \draw[color=green!60!black, line width=5pt] ({3.75}, {-1.25}) circle (1cm); \draw[color=red, line width=5pt] ({5}, {0}) circle (1cm); \end{pgfonlayer}{0}
% Layer 1 \begin{pgfonlayer}{1} \draw[color=blue, line width=5pt, start angle=330, end angle=360, radius=1cm] ({0.8660254037844384}, {-0.5000000000000004}) arc; \draw[color=yellow!80!black, line width=5pt, start angle=60, end angle=90, radius=1cm] ({1.75}, {-0.3839745962155614}) arc; \draw[color=black, line width=5pt, start angle=330, end angle=360, radius=1cm] ({3.3660254037844384}, {-0.5000000000000004}) arc; \draw[color=green!60!black, line width=5pt, start angle=60, end angle=90, radius=1cm] ({4.25}, {-0.3839745962155614}) arc; \end{pgfonlayer}{1}\end{tikzpicture}
\end{document}