TikZ Primitives
tikzfigure wraps common TikZ drawing primitives so you don’t need raw LaTeX for standard geometric shapes.
- arcs and circles
- rectangles and ellipses
- grids and parabolas
- lines and intersections
- regular polygons (triangle, square, pentagon, …)
import math
from tikzfigure import TikzFigure, arrows, stylesAn arc is defined by a starting point, start and end angles (in degrees), and a radius.
fig = TikzFigure()
# Quarter circle arcfig.arc(    start=(0, 0),    start_angle=0,    end_angle=90,    radius="2cm",    color="red",    line_width="2pt",)
# Three-quarter circle arcfig.arc(    start=(4, 0),    start_angle=90,    end_angle=360,    radius="1.5cm",    color="blue",    line_width="2pt",)
# Arc with arrowfig.arc(    start=(8, 0),    start_angle=0,    end_angle=180,    radius="2cm",    arrows=arrows.forward,    color="green",    line_width="2pt",)
fig.show()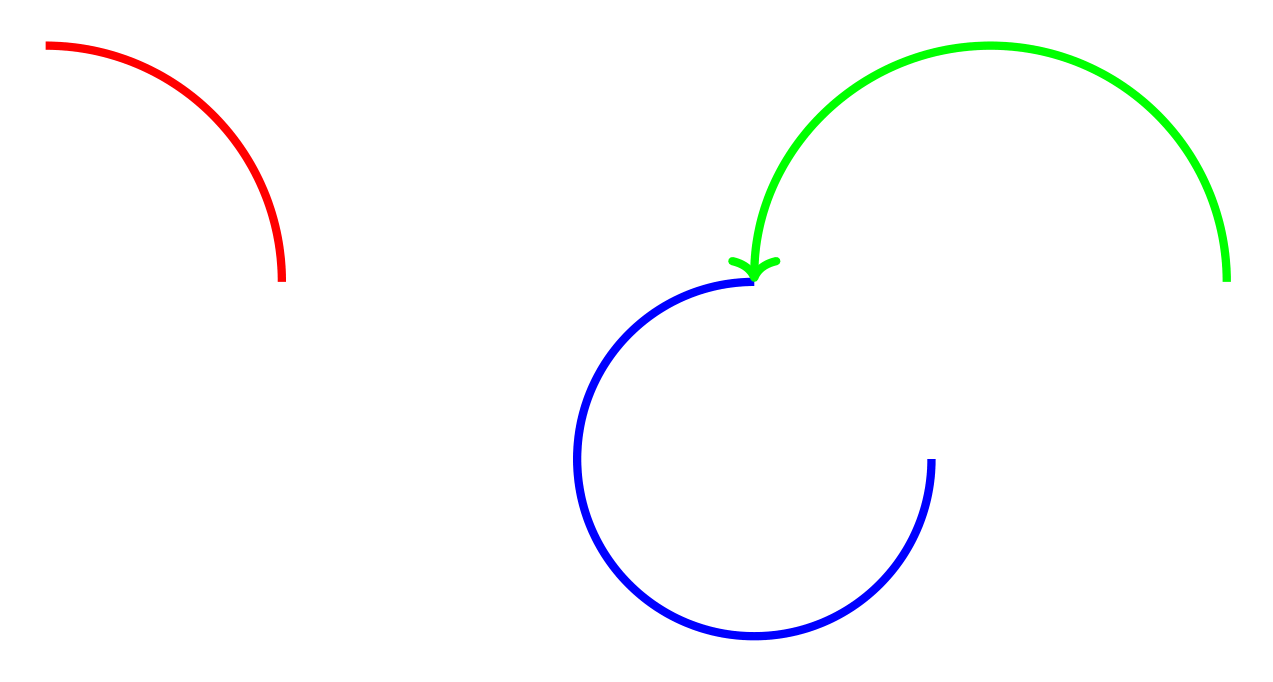
Show Tikz code
print(fig)% --------------------------------------------- %% Tikzfigure generated by tikzfigure v0.3.1 %% https://github.com/max-models/tikzfigure %% --------------------------------------------- %\begin{tikzpicture} \draw[color=red, line width=2pt, start angle=0, end angle=90, radius=2cm] ({0}, {0}) arc; \draw[color=blue, line width=2pt, start angle=90, end angle=360, radius=1.5cm] ({4}, {0}) arc; \draw[->, color=green, line width=2pt, start angle=0, end angle=180, radius=2cm] ({8}, {0}) arc;\end{tikzpicture}print(fig.generate_standalone())\documentclass[border=10pt]{standalone}\PassOptionsToPackage{dvipsnames,svgnames,x11names}{xcolor}\usepackage{tikz}\usepackage{pgfplots}\pgfplotsset{compat=newest}\usepgfplotslibrary{groupplots}\usetikzlibrary{arrows.meta}\begin{document}% --------------------------------------------- %% Tikzfigure generated by tikzfigure v0.3.1 %% https://github.com/max-models/tikzfigure %% --------------------------------------------- %\begin{tikzpicture} \draw[color=red, line width=2pt, start angle=0, end angle=90, radius=2cm] ({0}, {0}) arc; \draw[color=blue, line width=2pt, start angle=90, end angle=360, radius=1.5cm] ({4}, {0}) arc; \draw[->, color=green, line width=2pt, start angle=0, end angle=180, radius=2cm] ({8}, {0}) arc;\end{tikzpicture}
\end{document}Circles
Section titled “Circles”A circle is defined by a center point and a radius.
fig = TikzFigure()
# Unfilled circlefig.circle(    center=(0, 0),    radius="1cm",    color="blue",    line_width="2pt",)
# Filled circlefig.circle(    center=(3, 0),    radius="1cm",    fill="yellow",    color="orange",    line_width="2pt",)
# Dashed circlefig.circle(    center=(6, 0),    radius="1cm",    color="purple",    dash_pattern="on 2pt off 2pt",    line_width="2pt",)
fig.show()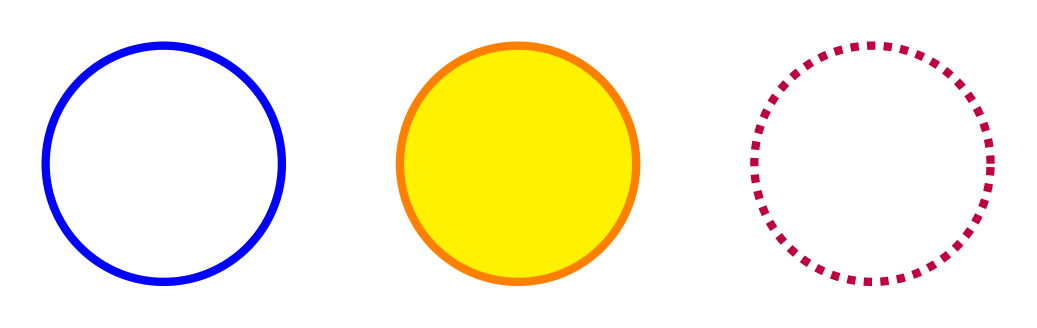
Show Tikz code
print(fig)% --------------------------------------------- %% Tikzfigure generated by tikzfigure v0.3.1 %% https://github.com/max-models/tikzfigure %% --------------------------------------------- %\begin{tikzpicture} \draw[color=blue, line width=2pt] ({0}, {0}) circle (1cm); \draw[color=orange, fill=yellow, line width=2pt] ({3}, {0}) circle (1cm); \draw[color=purple, line width=2pt, dash pattern=on 2pt off 2pt] ({6}, {0}) circle (1cm);\end{tikzpicture}print(fig.generate_standalone())\documentclass[border=10pt]{standalone}\PassOptionsToPackage{dvipsnames,svgnames,x11names}{xcolor}\usepackage{tikz}\usepackage{pgfplots}\pgfplotsset{compat=newest}\usepgfplotslibrary{groupplots}\usetikzlibrary{arrows.meta}\begin{document}% --------------------------------------------- %% Tikzfigure generated by tikzfigure v0.3.1 %% https://github.com/max-models/tikzfigure %% --------------------------------------------- %\begin{tikzpicture} \draw[color=blue, line width=2pt] ({0}, {0}) circle (1cm); \draw[color=orange, fill=yellow, line width=2pt] ({3}, {0}) circle (1cm); \draw[color=purple, line width=2pt, dash pattern=on 2pt off 2pt] ({6}, {0}) circle (1cm);\end{tikzpicture}
\end{document}Clock face
Section titled “Clock face”A practical example: a clock face using a circle and line segments for hour markers.
fig = TikzFigure()
# Outer circlefig.circle(    center=(0, 0),    radius="3cm",    color="black",    line_width="2pt",)
# Hour markers (12 arcs around the circle)for hour in range(12):    angle = ((hour + 3) * 30) % 360  # 30 degrees apart    rad = math.radians(angle)
    # Small line segment from inner to outer    x_inner = 2.7 * math.cos(rad)    y_inner = 2.7 * math.sin(rad)    fig.draw(        [(x_inner, y_inner), (x_inner * 1.1, y_inner * 1.1)],        line_width="1.5pt",        color="black",    )
    # Hour numbers    x_text = 2.4 * math.cos(rad)    y_text = 2.4 * math.sin(rad)    fig.node(        x_text,        y_text,        content=str(hour if hour > 0 else 12),        draw="none",    )
# Center dotfig.circle(    center=(0, 0),    radius="0.15cm",    fill="black",)
fig.show()
Show Tikz code
print(fig)% --------------------------------------------- %% Tikzfigure generated by tikzfigure v0.3.1 %% https://github.com/max-models/tikzfigure %% --------------------------------------------- %\begin{tikzpicture} \draw[color=black, line width=2pt] ({0}, {0}) circle (3cm); \draw[color=black, line width=1.5pt] (1.6532731788489269e-16, 2.7) to (1.8186004967338198e-16, 2.9700000000000006); \node[draw=none] (node0) at ({1.4695761589768238e-16}, {2.4}) {12}; \draw[color=black, line width=1.5pt] (-1.3499999999999994, 2.3382685902179845) to (-1.4849999999999994, 2.572095449239783); \node[draw=none] (node1) at ({-1.1999999999999995}, {2.078460969082653}) {1}; \draw[color=black, line width=1.5pt] (-2.3382685902179845, 1.3499999999999999) to (-2.572095449239783, 1.4849999999999999); \node[draw=none] (node2) at ({-2.078460969082653}, {1.1999999999999997}) {2}; \draw[color=black, line width=1.5pt] (-2.7, 3.3065463576978537e-16) to (-2.9700000000000006, 3.6372009934676396e-16); \node[draw=none] (node3) at ({-2.4}, {2.9391523179536476e-16}) {3}; \draw[color=black, line width=1.5pt] (-2.3382685902179845, -1.3500000000000003) to (-2.572095449239783, -1.4850000000000005); \node[draw=none] (node4) at ({-2.0784609690826525}, {-1.2000000000000002}) {4}; \draw[color=black, line width=1.5pt] (-1.3500000000000012, -2.3382685902179836) to (-1.4850000000000014, -2.5720954492397823); \node[draw=none] (node5) at ({-1.200000000000001}, {-2.078460969082652}) {5}; \draw[color=black, line width=1.5pt] (-4.959819536546781e-16, -2.7) to (-5.455801490201459e-16, -2.9700000000000006); \node[draw=none] (node6) at ({-4.408728476930471e-16}, {-2.4}) {6}; \draw[color=black, line width=1.5pt] (1.3500000000000003, -2.3382685902179845) to (1.4850000000000005, -2.572095449239783); \node[draw=none] (node7) at ({1.2000000000000002}, {-2.0784609690826525}) {7}; \draw[color=black, line width=1.5pt] (2.3382685902179836, -1.3500000000000012) to (2.5720954492397823, -1.4850000000000014); \node[draw=none] (node8) at ({2.078460969082652}, {-1.200000000000001}) {8}; \draw[color=black, line width=1.5pt] (2.7, 0.0) to (2.9700000000000006, 0.0); \node[draw=none] (node9) at ({2.4}, {0.0}) {9}; \draw[color=black, line width=1.5pt] (2.3382685902179845, 1.3499999999999999) to (2.572095449239783, 1.4849999999999999); \node[draw=none] (node10) at ({2.078460969082653}, {1.1999999999999997}) {10}; \draw[color=black, line width=1.5pt] (1.3500000000000003, 2.3382685902179845) to (1.4850000000000005, 2.572095449239783); \node[draw=none] (node11) at ({1.2000000000000002}, {2.0784609690826525}) {11}; \draw[fill=black] ({0}, {0}) circle (0.15cm);\end{tikzpicture}print(fig.generate_standalone())\documentclass[border=10pt]{standalone}\PassOptionsToPackage{dvipsnames,svgnames,x11names}{xcolor}\usepackage{tikz}\usepackage{pgfplots}\pgfplotsset{compat=newest}\usepgfplotslibrary{groupplots}\usetikzlibrary{arrows.meta}\begin{document}% --------------------------------------------- %% Tikzfigure generated by tikzfigure v0.3.1 %% https://github.com/max-models/tikzfigure %% --------------------------------------------- %\begin{tikzpicture} \draw[color=black, line width=2pt] ({0}, {0}) circle (3cm); \draw[color=black, line width=1.5pt] (1.6532731788489269e-16, 2.7) to (1.8186004967338198e-16, 2.9700000000000006); \node[draw=none] (node0) at ({1.4695761589768238e-16}, {2.4}) {12}; \draw[color=black, line width=1.5pt] (-1.3499999999999994, 2.3382685902179845) to (-1.4849999999999994, 2.572095449239783); \node[draw=none] (node1) at ({-1.1999999999999995}, {2.078460969082653}) {1}; \draw[color=black, line width=1.5pt] (-2.3382685902179845, 1.3499999999999999) to (-2.572095449239783, 1.4849999999999999); \node[draw=none] (node2) at ({-2.078460969082653}, {1.1999999999999997}) {2}; \draw[color=black, line width=1.5pt] (-2.7, 3.3065463576978537e-16) to (-2.9700000000000006, 3.6372009934676396e-16); \node[draw=none] (node3) at ({-2.4}, {2.9391523179536476e-16}) {3}; \draw[color=black, line width=1.5pt] (-2.3382685902179845, -1.3500000000000003) to (-2.572095449239783, -1.4850000000000005); \node[draw=none] (node4) at ({-2.0784609690826525}, {-1.2000000000000002}) {4}; \draw[color=black, line width=1.5pt] (-1.3500000000000012, -2.3382685902179836) to (-1.4850000000000014, -2.5720954492397823); \node[draw=none] (node5) at ({-1.200000000000001}, {-2.078460969082652}) {5}; \draw[color=black, line width=1.5pt] (-4.959819536546781e-16, -2.7) to (-5.455801490201459e-16, -2.9700000000000006); \node[draw=none] (node6) at ({-4.408728476930471e-16}, {-2.4}) {6}; \draw[color=black, line width=1.5pt] (1.3500000000000003, -2.3382685902179845) to (1.4850000000000005, -2.572095449239783); \node[draw=none] (node7) at ({1.2000000000000002}, {-2.0784609690826525}) {7}; \draw[color=black, line width=1.5pt] (2.3382685902179836, -1.3500000000000012) to (2.5720954492397823, -1.4850000000000014); \node[draw=none] (node8) at ({2.078460969082652}, {-1.200000000000001}) {8}; \draw[color=black, line width=1.5pt] (2.7, 0.0) to (2.9700000000000006, 0.0); \node[draw=none] (node9) at ({2.4}, {0.0}) {9}; \draw[color=black, line width=1.5pt] (2.3382685902179845, 1.3499999999999999) to (2.572095449239783, 1.4849999999999999); \node[draw=none] (node10) at ({2.078460969082653}, {1.1999999999999997}) {10}; \draw[color=black, line width=1.5pt] (1.3500000000000003, 2.3382685902179845) to (1.4850000000000005, 2.572095449239783); \node[draw=none] (node11) at ({1.2000000000000002}, {2.0784609690826525}) {11}; \draw[fill=black] ({0}, {0}) circle (0.15cm);\end{tikzpicture}
\end{document}Rectangles
Section titled “Rectangles”Rectangles are defined by two opposite corners.
fig = TikzFigure()
# Unfilled rectanglefig.rectangle(    (0, 0),    (2, 1),    color="blue",    line_width="2pt",)
# Filled rectanglefig.rectangle(    (3, 0),    (5, 1),    fill="yellow",    color="orange",    line_width="2pt",)
# Rectangle with rounded cornersfig.rectangle(    (6, 0),    (8, 1),    fill="green!30",    color="green",    rounded_corners="5pt",    line_width="2pt",)
fig.show()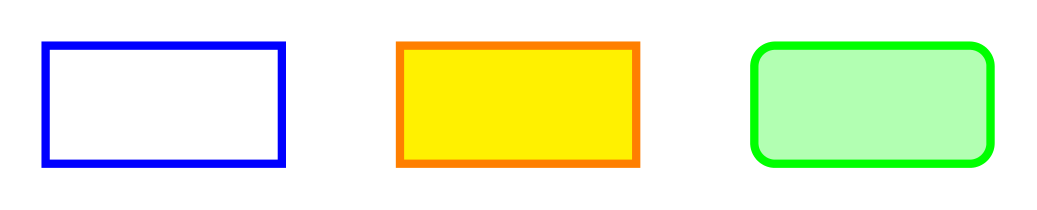
Show Tikz code
print(fig)% --------------------------------------------- %% Tikzfigure generated by tikzfigure v0.3.1 %% https://github.com/max-models/tikzfigure %% --------------------------------------------- %\begin{tikzpicture} \draw[color=blue, line width=2pt] ({0}, {0}) rectangle ({2}, {1}); \draw[color=orange, fill=yellow, line width=2pt] ({3}, {0}) rectangle ({5}, {1}); \draw[color=green, fill=green!30, line width=2pt, rounded corners=5pt] ({6}, {0}) rectangle ({8}, {1});\end{tikzpicture}print(fig.generate_standalone())\documentclass[border=10pt]{standalone}\PassOptionsToPackage{dvipsnames,svgnames,x11names}{xcolor}\usepackage{tikz}\usepackage{pgfplots}\pgfplotsset{compat=newest}\usepgfplotslibrary{groupplots}\usetikzlibrary{arrows.meta}\begin{document}% --------------------------------------------- %% Tikzfigure generated by tikzfigure v0.3.1 %% https://github.com/max-models/tikzfigure %% --------------------------------------------- %\begin{tikzpicture} \draw[color=blue, line width=2pt] ({0}, {0}) rectangle ({2}, {1}); \draw[color=orange, fill=yellow, line width=2pt] ({3}, {0}) rectangle ({5}, {1}); \draw[color=green, fill=green!30, line width=2pt, rounded corners=5pt] ({6}, {0}) rectangle ({8}, {1});\end{tikzpicture}
\end{document}Ellipses
Section titled “Ellipses”Ellipses are defined by a center point and two radii.
fig = TikzFigure()
# Circle (equal radii)fig.ellipse(    (0, 0),    x_radius="1cm",    y_radius="1cm",    color="red",    line_width="2pt",)
# Horizontal ellipsefig.ellipse(    (4, 0),    x_radius="1.5cm",    y_radius="0.75cm",    color="blue",    line_width="2pt",)
# Filled ellipsefig.ellipse(    (8, 0),    x_radius="1.2cm",    y_radius="0.8cm",    fill="purple!40",    color="purple",    line_width="2pt",)
fig.show()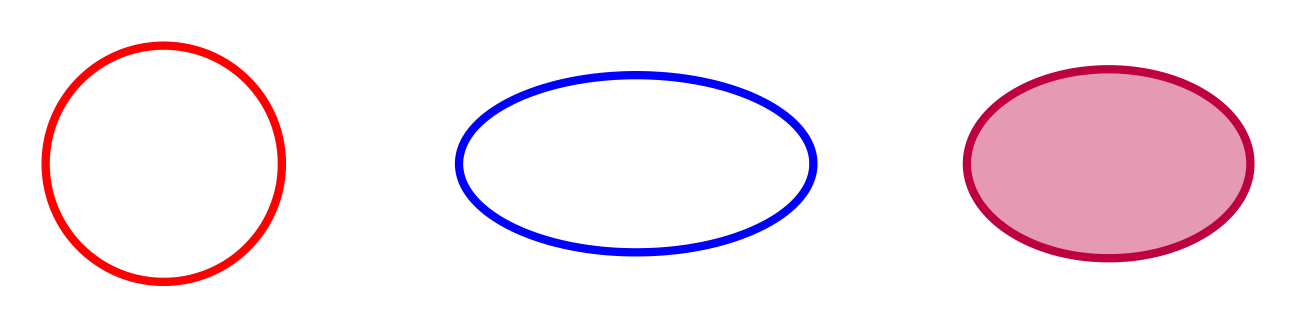
Show Tikz code
print(fig)% --------------------------------------------- %% Tikzfigure generated by tikzfigure v0.3.1 %% https://github.com/max-models/tikzfigure %% --------------------------------------------- %\begin{tikzpicture} \draw[color=red, line width=2pt] ({0}, {0}) ellipse (1cm and 1cm); \draw[color=blue, line width=2pt] ({4}, {0}) ellipse (1.5cm and 0.75cm); \draw[color=purple, fill=purple!40, line width=2pt] ({8}, {0}) ellipse (1.2cm and 0.8cm);\end{tikzpicture}print(fig.generate_standalone())\documentclass[border=10pt]{standalone}\PassOptionsToPackage{dvipsnames,svgnames,x11names}{xcolor}\usepackage{tikz}\usepackage{pgfplots}\pgfplotsset{compat=newest}\usepgfplotslibrary{groupplots}\usetikzlibrary{arrows.meta}\begin{document}% --------------------------------------------- %% Tikzfigure generated by tikzfigure v0.3.1 %% https://github.com/max-models/tikzfigure %% --------------------------------------------- %\begin{tikzpicture} \draw[color=red, line width=2pt] ({0}, {0}) ellipse (1cm and 1cm); \draw[color=blue, line width=2pt] ({4}, {0}) ellipse (1.5cm and 0.75cm); \draw[color=purple, fill=purple!40, line width=2pt] ({8}, {0}) ellipse (1.2cm and 0.8cm);\end{tikzpicture}
\end{document}A grid spans between two opposite corners with a specified step size.
fig = TikzFigure()
# Uniform gridfig.grid(    (0, 0),    (3, 3),    step="0.5cm",    color="gray!30",)
# Grid with different x and y stepsfig.grid(    (4, 0),    (7, 3),    step="0.5cm, 1cm",    color="blue!20",)
# Grid with larger stepfig.grid(    (8, 0),    (10, 3),    step="1cm",    color="red!20",    line_width="1pt",)
fig.show()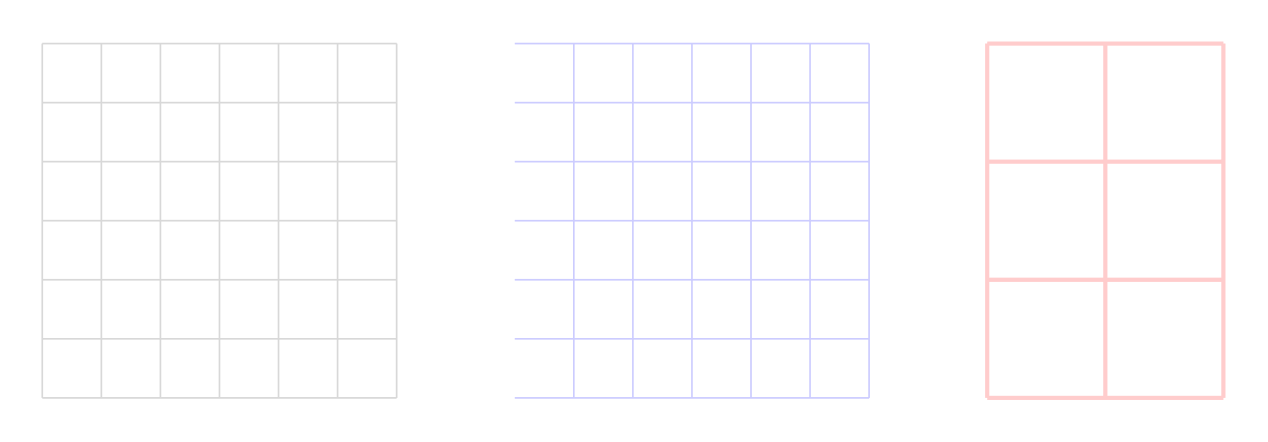
Show Tikz code
print(fig)% --------------------------------------------- %% Tikzfigure generated by tikzfigure v0.3.1 %% https://github.com/max-models/tikzfigure %% --------------------------------------------- %\begin{tikzpicture} \draw[color=gray!30, step=0.5cm] ({0}, {0}) grid ({3}, {3}); \draw[color=blue!20, step=0.5cm, 1cm] ({4}, {0}) grid ({7}, {3}); \draw[color=red!20, line width=1pt, step=1cm] ({8}, {0}) grid ({10}, {3});\end{tikzpicture}print(fig.generate_standalone())\documentclass[border=10pt]{standalone}\PassOptionsToPackage{dvipsnames,svgnames,x11names}{xcolor}\usepackage{tikz}\usepackage{pgfplots}\pgfplotsset{compat=newest}\usepgfplotslibrary{groupplots}\usetikzlibrary{arrows.meta}\begin{document}% --------------------------------------------- %% Tikzfigure generated by tikzfigure v0.3.1 %% https://github.com/max-models/tikzfigure %% --------------------------------------------- %\begin{tikzpicture} \draw[color=gray!30, step=0.5cm] ({0}, {0}) grid ({3}, {3}); \draw[color=blue!20, step=0.5cm, 1cm] ({4}, {0}) grid ({7}, {3}); \draw[color=red!20, line width=1pt, step=1cm] ({8}, {0}) grid ({10}, {3});\end{tikzpicture}
\end{document}Parabolas
Section titled “Parabolas”Parabolas connect two points, optionally with a bend (control) point.
fig = TikzFigure()
# Simple parabolafig.parabola(    (0, 0),    (3, 0),    color="red",    line_width="2pt",)
# Parabola with bend point (creates a specific curve shape)fig.parabola(    (5, 0),    (8, 0),    bend=(6.5, 2),    color="blue",    line_width="2pt",)
# Parabola with arrowfig.parabola(    (0, 3),    (3, 4),    color="green",    arrows=arrows.forward,    line_width="2pt",)
fig.show()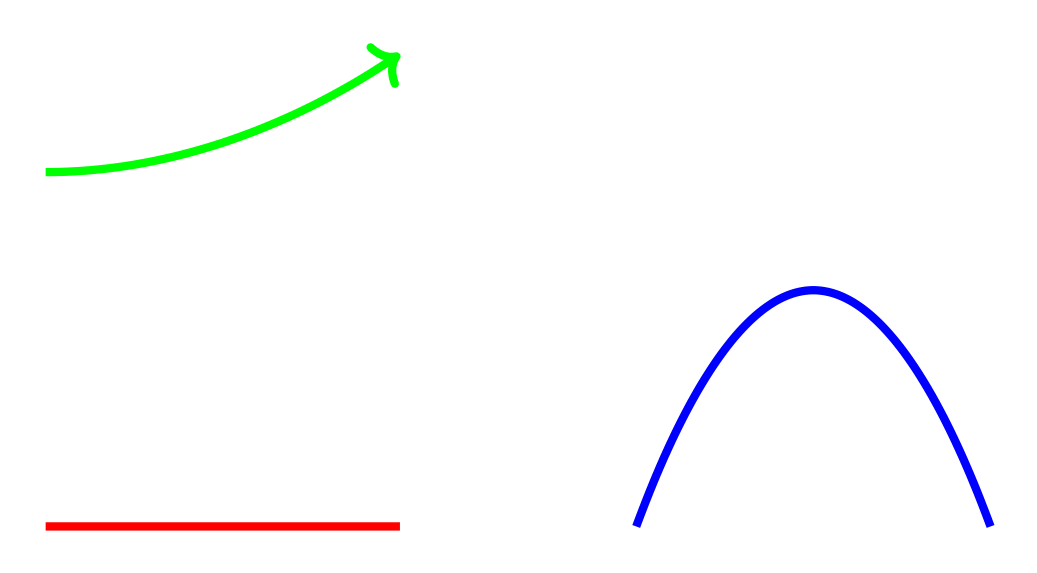
Show Tikz code
print(fig)% --------------------------------------------- %% Tikzfigure generated by tikzfigure v0.3.1 %% https://github.com/max-models/tikzfigure %% --------------------------------------------- %\begin{tikzpicture} \draw[color=red, line width=2pt] ({0}, {0}) parabola ({3}, {0}); \draw[color=blue, line width=2pt] ({5}, {0}) parabola bend ({6.5}, {2}) ({8}, {0}); \draw[->, color=green, line width=2pt] ({0}, {3}) parabola ({3}, {4});\end{tikzpicture}print(fig.generate_standalone())\documentclass[border=10pt]{standalone}\PassOptionsToPackage{dvipsnames,svgnames,x11names}{xcolor}\usepackage{tikz}\usepackage{pgfplots}\pgfplotsset{compat=newest}\usepgfplotslibrary{groupplots}\usetikzlibrary{arrows.meta}\begin{document}% --------------------------------------------- %% Tikzfigure generated by tikzfigure v0.3.1 %% https://github.com/max-models/tikzfigure %% --------------------------------------------- %\begin{tikzpicture} \draw[color=red, line width=2pt] ({0}, {0}) parabola ({3}, {0}); \draw[color=blue, line width=2pt] ({5}, {0}) parabola bend ({6.5}, {2}) ({8}, {0}); \draw[->, color=green, line width=2pt] ({0}, {3}) parabola ({3}, {4});\end{tikzpicture}
\end{document}Lines and intersections
Section titled “Lines and intersections”Lines connect two points and support arrows and all standard styling.
fig = TikzFigure()
# Simple linefig.line(    (0, 0),    (2, 0),    color="red",    line_width="2pt",)
# Line with arrowfig.line(    (3, 0),    (5, 2),    color="blue",    arrows=arrows.forward,    line_width="2pt",)
# Dashed linefig.line(    (6, 0),    (8, 1),    color="green",    options=[styles.dashed],    line_width="2pt",)
fig.show()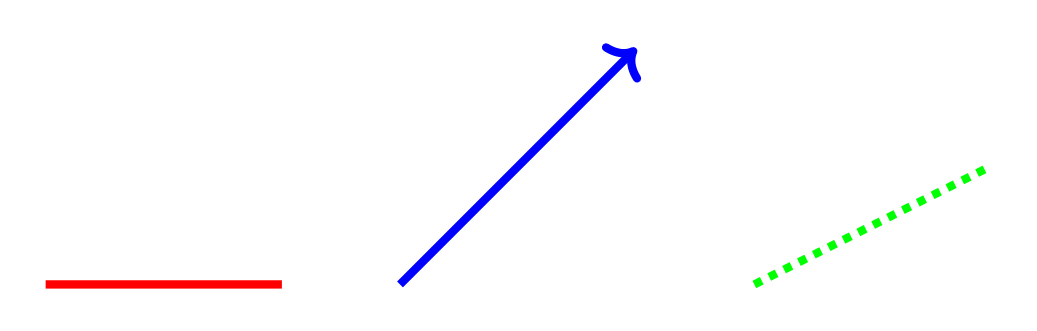
Show Tikz code
print(fig)% --------------------------------------------- %% Tikzfigure generated by tikzfigure v0.3.1 %% https://github.com/max-models/tikzfigure %% --------------------------------------------- %\begin{tikzpicture} \draw[color=red, line width=2pt] ({0}, {0}) -- ({2}, {0}); \draw[->, color=blue, line width=2pt] ({3}, {0}) -- ({5}, {2}); \draw[dashed, color=green, line width=2pt] ({6}, {0}) -- ({8}, {1});\end{tikzpicture}print(fig.generate_standalone())\documentclass[border=10pt]{standalone}\PassOptionsToPackage{dvipsnames,svgnames,x11names}{xcolor}\usepackage{tikz}\usepackage{pgfplots}\pgfplotsset{compat=newest}\usepgfplotslibrary{groupplots}\usetikzlibrary{arrows.meta}\begin{document}% --------------------------------------------- %% Tikzfigure generated by tikzfigure v0.3.1 %% https://github.com/max-models/tikzfigure %% --------------------------------------------- %\begin{tikzpicture} \draw[color=red, line width=2pt] ({0}, {0}) -- ({2}, {0}); \draw[->, color=blue, line width=2pt] ({3}, {0}) -- ({5}, {2}); \draw[dashed, color=green, line width=2pt] ({6}, {0}) -- ({8}, {1});\end{tikzpicture}
\end{document}Find where two lines intersect using the intersection() method:
fig = TikzFigure()
from tikzfigure.core.line import Line
# Create two linesline1 = fig.line(    (0, 0),    (4, 4),    color="red",    line_width="2pt",)line2 = fig.line(    (0, 4),    (4, 0),    color="blue",    line_width="2pt",)
# Find intersectionintersection = line1.intersection(line2)print(f"Lines intersect at: {intersection}")
# Draw intersection pointif intersection:    fig.node(        intersection[0],        intersection[1],        shape="circle",        fill="black",        minimum_size="0.15cm",        draw="none",    )
fig.show()
Lines intersect at: (2.0, 2.0)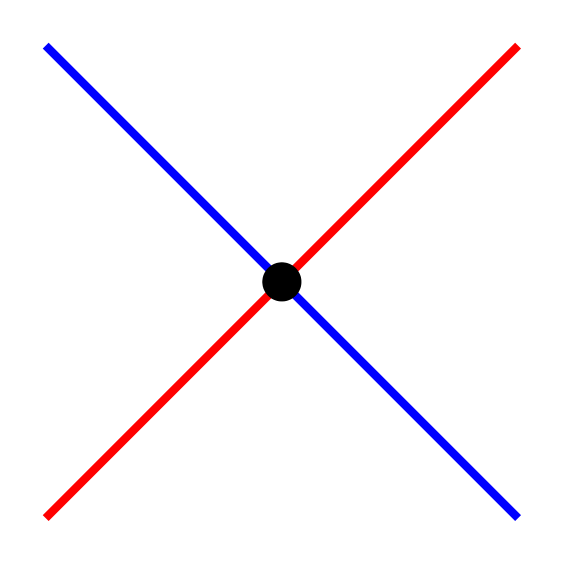
Show Tikz code
print(fig)% --------------------------------------------- %% Tikzfigure generated by tikzfigure v0.3.1 %% https://github.com/max-models/tikzfigure %% --------------------------------------------- %\begin{tikzpicture} \draw[color=red, line width=2pt] ({0}, {0}) -- ({4}, {4}); \draw[color=blue, line width=2pt] ({0}, {4}) -- ({4}, {0}); \node[shape=circle, fill=black, draw=none, minimum size=0.15cm] (node0) at ({2.0}, {2.0}) {};\end{tikzpicture}print(fig.generate_standalone())\documentclass[border=10pt]{standalone}\PassOptionsToPackage{dvipsnames,svgnames,x11names}{xcolor}\usepackage{tikz}\usepackage{pgfplots}\pgfplotsset{compat=newest}\usepgfplotslibrary{groupplots}\usetikzlibrary{arrows.meta}\begin{document}% --------------------------------------------- %% Tikzfigure generated by tikzfigure v0.3.1 %% https://github.com/max-models/tikzfigure %% --------------------------------------------- %\begin{tikzpicture} \draw[color=red, line width=2pt] ({0}, {0}) -- ({4}, {4}); \draw[color=blue, line width=2pt] ({0}, {4}) -- ({4}, {0}); \node[shape=circle, fill=black, draw=none, minimum size=0.15cm] (node0) at ({2.0}, {2.0}) {};\end{tikzpicture}
\end{document}Regular polygons
Section titled “Regular polygons”Draw regular polygons (triangle, square, pentagon, etc.) with specified center and radius.
fig = TikzFigure()
# Triangle (3 sides)fig.triangle(    (0, 1),    radius=0.8,    color="red",    fill="red!20",)
# Square (4 sides)fig.square(    (3, 1),    radius=0.8,    color="blue",    fill="blue!20",)
# Pentagon (5 sides)fig.polygon(    (6, 1),    radius=0.8,    sides=5,    color="green",    fill="green!20",)
# Hexagon (6 sides)fig.polygon(    (9, 1),    radius=0.8,    sides=6,    color="orange",    fill="orange!20",)
fig.show()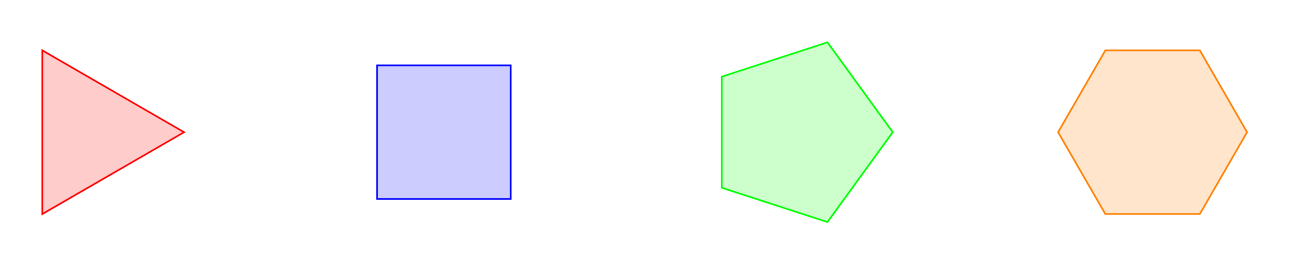
Show Tikz code
print(fig)% --------------------------------------------- %% Tikzfigure generated by tikzfigure v0.3.1 %% https://github.com/max-models/tikzfigure %% --------------------------------------------- %\begin{tikzpicture} \draw[color=red, fill=red!20] (0.8, 1.0) -- (-0.39999999999999986, 1.6928203230275511) -- (-0.40000000000000036, 0.3071796769724493) -- cycle; \draw[color=blue, fill=blue!20] (3.5656854249492382, 1.565685424949238) -- (2.434314575050762, 1.5656854249492382) -- (2.4343145750507618, 0.434314575050762) -- (3.565685424949238, 0.4343145750507619) -- cycle; \draw[color=green, fill=green!20] (6.8, 1.0) -- (6.247213595499958, 1.7608452130361227) -- (5.352786404500042, 1.4702282018339785) -- (5.352786404500042, 0.5297717981660215) -- (6.247213595499958, 0.23915478696387704) -- cycle; \draw[color=orange, fill=orange!20] (9.8, 1.0) -- (9.4, 1.692820323027551) -- (8.6, 1.6928203230275511) -- (8.2, 1.0) -- (8.6, 0.3071796769724493) -- (9.4, 0.3071796769724491) -- cycle;\end{tikzpicture}print(fig.generate_standalone())\documentclass[border=10pt]{standalone}\PassOptionsToPackage{dvipsnames,svgnames,x11names}{xcolor}\usepackage{tikz}\usepackage{pgfplots}\pgfplotsset{compat=newest}\usepgfplotslibrary{groupplots}\usetikzlibrary{arrows.meta}\begin{document}% --------------------------------------------- %% Tikzfigure generated by tikzfigure v0.3.1 %% https://github.com/max-models/tikzfigure %% --------------------------------------------- %\begin{tikzpicture} \draw[color=red, fill=red!20] (0.8, 1.0) -- (-0.39999999999999986, 1.6928203230275511) -- (-0.40000000000000036, 0.3071796769724493) -- cycle; \draw[color=blue, fill=blue!20] (3.5656854249492382, 1.565685424949238) -- (2.434314575050762, 1.5656854249492382) -- (2.4343145750507618, 0.434314575050762) -- (3.565685424949238, 0.4343145750507619) -- cycle; \draw[color=green, fill=green!20] (6.8, 1.0) -- (6.247213595499958, 1.7608452130361227) -- (5.352786404500042, 1.4702282018339785) -- (5.352786404500042, 0.5297717981660215) -- (6.247213595499958, 0.23915478696387704) -- cycle; \draw[color=orange, fill=orange!20] (9.8, 1.0) -- (9.4, 1.692820323027551) -- (8.6, 1.6928203230275511) -- (8.2, 1.0) -- (8.6, 0.3071796769724493) -- (9.4, 0.3071796769724491) -- cycle;\end{tikzpicture}
\end{document}Rotated polygons
Section titled “Rotated polygons”Polygons can be rotated by specifying a rotation angle in degrees.
fig = TikzFigure()
# Squares with different rotationsrotations = [0, 22.5, 45]for i, rot in enumerate(rotations):    fig.square(        (i * 3, 1),        radius=0.8,        rotation=rot,        color="purple",        fill="purple!30",    )    fig.node(        i * 3,        -0.3,        content=f"{rot}\\textdegree",        draw="none",    )
# Triangles pointing in different directionsfig.triangle(    (0, 3.5),    radius=0.8,    rotation=0,    color="blue",    fill="blue!20",)fig.triangle(    (3, 3.5),    radius=0.8,    rotation=120,    color="blue",    fill="blue!20",)fig.triangle(    (6, 3.5),    radius=0.8,    rotation=240,    color="blue",    fill="blue!20",)
fig.show()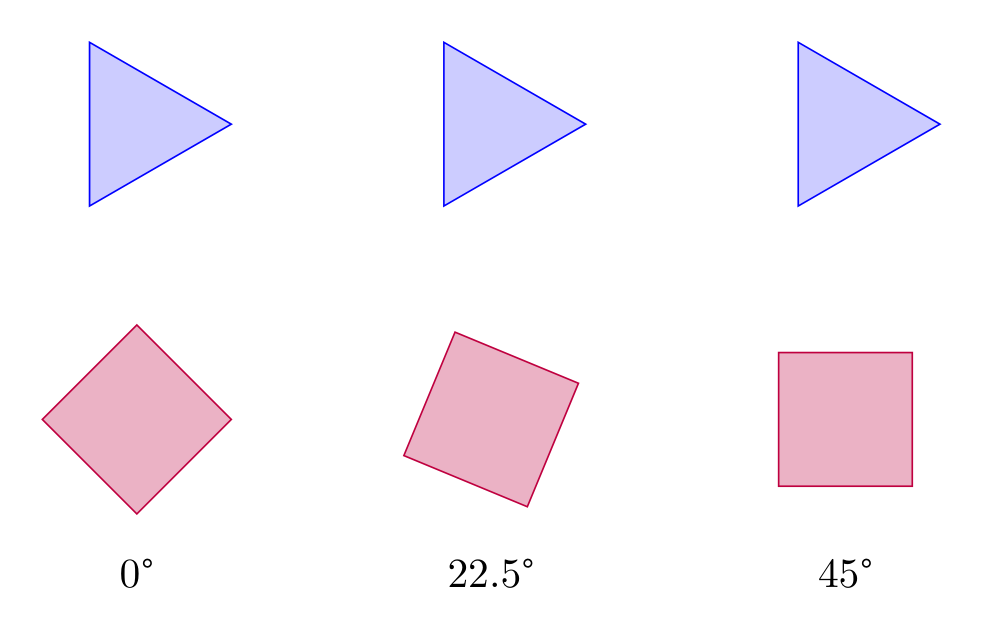
Show Tikz code
print(fig)% --------------------------------------------- %% Tikzfigure generated by tikzfigure v0.3.1 %% https://github.com/max-models/tikzfigure %% --------------------------------------------- %\begin{tikzpicture} \draw[color=purple, fill=purple!30] (0.8, 1.0) -- (4.898587196589413e-17, 1.8) -- (-0.8, 1.0) -- (-1.4695761589768238e-16, 0.19999999999999996) -- cycle; \node[draw=none] (node0) at ({0}, {-0.3}) {0\textdegree}; \draw[color=purple, fill=purple!30] (3.7391036260090296, 1.306146745892072) -- (2.6938532541079283, 1.7391036260090296) -- (2.2608963739909704, 0.6938532541079283) -- (3.306146745892072, 0.26089637399097065) -- cycle; \node[draw=none] (node1) at ({3}, {-0.3}) {22.5\textdegree}; \draw[color=purple, fill=purple!30] (6.565685424949238, 1.565685424949238) -- (5.434314575050762, 1.5656854249492382) -- (5.434314575050762, 0.434314575050762) -- (6.565685424949238, 0.4343145750507619) -- cycle; \node[draw=none] (node2) at ({6}, {-0.3}) {45\textdegree}; \draw[color=blue, fill=blue!20] (0.8, 3.5) -- (-0.39999999999999986, 4.192820323027551) -- (-0.40000000000000036, 2.8071796769724493) -- cycle; \draw[color=blue, fill=blue!20] (2.6, 4.192820323027551) -- (2.5999999999999996, 2.8071796769724493) -- (3.8, 3.5) -- cycle; \draw[color=blue, fill=blue!20] (5.6, 2.8071796769724493) -- (6.8, 3.5) -- (5.6000000000000005, 4.192820323027552) -- cycle;\end{tikzpicture}print(fig.generate_standalone())\documentclass[border=10pt]{standalone}\PassOptionsToPackage{dvipsnames,svgnames,x11names}{xcolor}\usepackage{tikz}\usepackage{pgfplots}\pgfplotsset{compat=newest}\usepgfplotslibrary{groupplots}\usetikzlibrary{arrows.meta}\begin{document}% --------------------------------------------- %% Tikzfigure generated by tikzfigure v0.3.1 %% https://github.com/max-models/tikzfigure %% --------------------------------------------- %\begin{tikzpicture} \draw[color=purple, fill=purple!30] (0.8, 1.0) -- (4.898587196589413e-17, 1.8) -- (-0.8, 1.0) -- (-1.4695761589768238e-16, 0.19999999999999996) -- cycle; \node[draw=none] (node0) at ({0}, {-0.3}) {0\textdegree}; \draw[color=purple, fill=purple!30] (3.7391036260090296, 1.306146745892072) -- (2.6938532541079283, 1.7391036260090296) -- (2.2608963739909704, 0.6938532541079283) -- (3.306146745892072, 0.26089637399097065) -- cycle; \node[draw=none] (node1) at ({3}, {-0.3}) {22.5\textdegree}; \draw[color=purple, fill=purple!30] (6.565685424949238, 1.565685424949238) -- (5.434314575050762, 1.5656854249492382) -- (5.434314575050762, 0.434314575050762) -- (6.565685424949238, 0.4343145750507619) -- cycle; \node[draw=none] (node2) at ({6}, {-0.3}) {45\textdegree}; \draw[color=blue, fill=blue!20] (0.8, 3.5) -- (-0.39999999999999986, 4.192820323027551) -- (-0.40000000000000036, 2.8071796769724493) -- cycle; \draw[color=blue, fill=blue!20] (2.6, 4.192820323027551) -- (2.5999999999999996, 2.8071796769724493) -- (3.8, 3.5) -- cycle; \draw[color=blue, fill=blue!20] (5.6, 2.8071796769724493) -- (6.8, 3.5) -- (5.6000000000000005, 4.192820323027552) -- cycle;\end{tikzpicture}
\end{document}Circle of nodes
Section titled “Circle of nodes”Placing many nodes evenly around a circle using a Python loop together
with TikZ variables (defined via variable).
fig = TikzFigure()
fig.variable("radius", 3)
N = 12for i in range(N):    frac = round(i / N, 4)    fig.node(        (            f"{{\\radius*{math.cos(frac * 2 * math.pi):.4f}}}",            f"{{\\radius*{math.sin(frac * 2 * math.pi):.4f}}}",        ),        shape="circle",        fill="blue!40",        content=str(i),        minimum_size="0.6cm",    )
fig.show()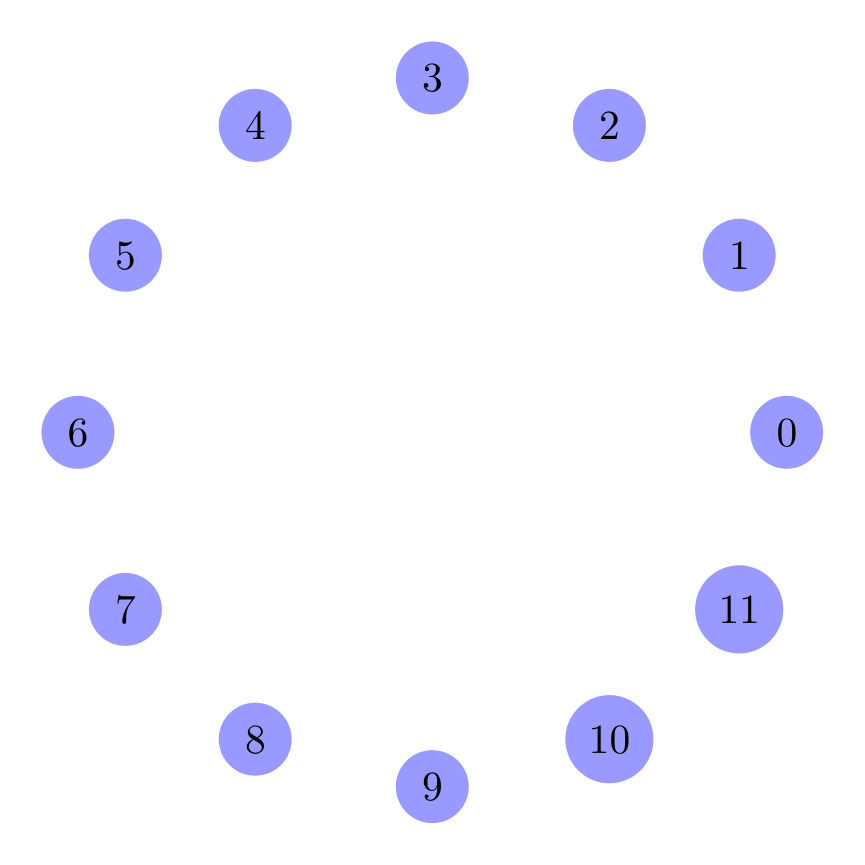
Show Tikz code
print(fig)% --------------------------------------------- %% Tikzfigure generated by tikzfigure v0.3.1 %% https://github.com/max-models/tikzfigure %% --------------------------------------------- %\begin{tikzpicture} \pgfmathsetmacro{\radius}{3} \node[shape=circle, fill=blue!40, minimum size=0.6cm] (node0) at ({{\radius*1.0000}}, {{\radius*0.0000}}) {0}; \node[shape=circle, fill=blue!40, minimum size=0.6cm] (node1) at ({{\radius*0.8661}}, {{\radius*0.4998}}) {1}; \node[shape=circle, fill=blue!40, minimum size=0.6cm] (node2) at ({{\radius*0.4998}}, {{\radius*0.8661}}) {2}; \node[shape=circle, fill=blue!40, minimum size=0.6cm] (node3) at ({{\radius*0.0000}}, {{\radius*1.0000}}) {3}; \node[shape=circle, fill=blue!40, minimum size=0.6cm] (node4) at ({{\radius*-0.4998}}, {{\radius*0.8661}}) {4}; \node[shape=circle, fill=blue!40, minimum size=0.6cm] (node5) at ({{\radius*-0.8661}}, {{\radius*0.4998}}) {5}; \node[shape=circle, fill=blue!40, minimum size=0.6cm] (node6) at ({{\radius*-1.0000}}, {{\radius*0.0000}}) {6}; \node[shape=circle, fill=blue!40, minimum size=0.6cm] (node7) at ({{\radius*-0.8661}}, {{\radius*-0.4998}}) {7}; \node[shape=circle, fill=blue!40, minimum size=0.6cm] (node8) at ({{\radius*-0.4998}}, {{\radius*-0.8661}}) {8}; \node[shape=circle, fill=blue!40, minimum size=0.6cm] (node9) at ({{\radius*-0.0000}}, {{\radius*-1.0000}}) {9}; \node[shape=circle, fill=blue!40, minimum size=0.6cm] (node10) at ({{\radius*0.4998}}, {{\radius*-0.8661}}) {10}; \node[shape=circle, fill=blue!40, minimum size=0.6cm] (node11) at ({{\radius*0.8661}}, {{\radius*-0.4998}}) {11};\end{tikzpicture}print(fig.generate_standalone())\documentclass[border=10pt]{standalone}\PassOptionsToPackage{dvipsnames,svgnames,x11names}{xcolor}\usepackage{tikz}\usepackage{pgfplots}\pgfplotsset{compat=newest}\usepgfplotslibrary{groupplots}\usetikzlibrary{arrows.meta}\begin{document}% --------------------------------------------- %% Tikzfigure generated by tikzfigure v0.3.1 %% https://github.com/max-models/tikzfigure %% --------------------------------------------- %\begin{tikzpicture} \pgfmathsetmacro{\radius}{3} \node[shape=circle, fill=blue!40, minimum size=0.6cm] (node0) at ({{\radius*1.0000}}, {{\radius*0.0000}}) {0}; \node[shape=circle, fill=blue!40, minimum size=0.6cm] (node1) at ({{\radius*0.8661}}, {{\radius*0.4998}}) {1}; \node[shape=circle, fill=blue!40, minimum size=0.6cm] (node2) at ({{\radius*0.4998}}, {{\radius*0.8661}}) {2}; \node[shape=circle, fill=blue!40, minimum size=0.6cm] (node3) at ({{\radius*0.0000}}, {{\radius*1.0000}}) {3}; \node[shape=circle, fill=blue!40, minimum size=0.6cm] (node4) at ({{\radius*-0.4998}}, {{\radius*0.8661}}) {4}; \node[shape=circle, fill=blue!40, minimum size=0.6cm] (node5) at ({{\radius*-0.8661}}, {{\radius*0.4998}}) {5}; \node[shape=circle, fill=blue!40, minimum size=0.6cm] (node6) at ({{\radius*-1.0000}}, {{\radius*0.0000}}) {6}; \node[shape=circle, fill=blue!40, minimum size=0.6cm] (node7) at ({{\radius*-0.8661}}, {{\radius*-0.4998}}) {7}; \node[shape=circle, fill=blue!40, minimum size=0.6cm] (node8) at ({{\radius*-0.4998}}, {{\radius*-0.8661}}) {8}; \node[shape=circle, fill=blue!40, minimum size=0.6cm] (node9) at ({{\radius*-0.0000}}, {{\radius*-1.0000}}) {9}; \node[shape=circle, fill=blue!40, minimum size=0.6cm] (node10) at ({{\radius*0.4998}}, {{\radius*-0.8661}}) {10}; \node[shape=circle, fill=blue!40, minimum size=0.6cm] (node11) at ({{\radius*0.8661}}, {{\radius*-0.4998}}) {11};\end{tikzpicture}
\end{document}