Decorations
TikZ decorations transform the appearance of paths: a straight line can
become a zigzag, a snake wave, a coil spring, or a brace bracket. This
tutorial covers the decorations available through tikzfigure’s
decoration parameter:
"zigzag","snake","coil","bumps"— path morphing decorations- side-by-side gallery of all morphing decorations
"brace"— bracket annotations (requires a second library)- combining decorations with colors and line widths
Important: You must always pass options=["decorate"] alongside
decoration= to actually activate the decoration. The decoration=
kwarg sets which decoration to use; decorate is the flag that
switches it on.
All morphing decoration examples require
document_setup=r"\usetikzlibrary{decorations.pathmorphing}". The brace
decoration additionally requires
\usetikzlibrary{decorations.pathreplacing}.
from tikzfigure import TikzFigure, decorations, shapes, stylesdecoration="zigzag"
Section titled “decoration="zigzag"”A zigzag path oscillates sharply between two extremes along the path direction.
fig = TikzFigure(    document_setup=r"\usetikzlibrary{decorations.pathmorphing}",)
fig.draw(    [(0, 0), (6, 0)],    options=[styles.decorate],    decoration=decorations.zigzag,    line_width=2,    color="red",)
fig.show()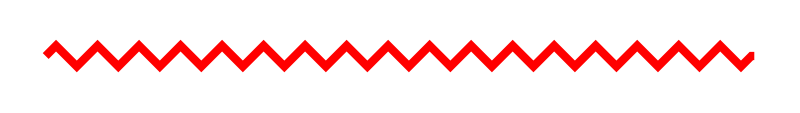
Show Tikz code
print(fig)% --------------------------------------------- %% Tikzfigure generated by tikzfigure v0.3.1 %% https://github.com/max-models/tikzfigure %% --------------------------------------------- %\begin{tikzpicture} \draw[decorate, color=red, line width=2, decoration=zigzag] (0, 0) to (6, 0);\end{tikzpicture}print(fig.generate_standalone())\documentclass[border=10pt]{standalone}\PassOptionsToPackage{dvipsnames,svgnames,x11names}{xcolor}\usepackage{tikz}\usepackage{pgfplots}\pgfplotsset{compat=newest}\usepgfplotslibrary{groupplots}\usetikzlibrary{arrows.meta}% Custom document setup\usetikzlibrary{decorations.pathmorphing}\begin{document}% --------------------------------------------- %% Tikzfigure generated by tikzfigure v0.3.1 %% https://github.com/max-models/tikzfigure %% --------------------------------------------- %\begin{tikzpicture} \draw[decorate, color=red, line width=2, decoration=zigzag] (0, 0) to (6, 0);\end{tikzpicture}
\end{document}decoration="snake"
Section titled “decoration="snake"”A snake decoration produces a smooth sinusoidal wave — like a zigzag but with rounded peaks.
fig = TikzFigure(    document_setup=r"\usetikzlibrary{decorations.pathmorphing}",)
fig.draw(    [(0, 0), (6, 0)],    options=[styles.decorate],    decoration=decorations.snake,    line_width=2,    color="blue",)
fig.show()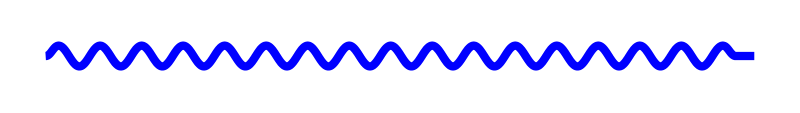
Show Tikz code
print(fig)% --------------------------------------------- %% Tikzfigure generated by tikzfigure v0.3.1 %% https://github.com/max-models/tikzfigure %% --------------------------------------------- %\begin{tikzpicture} \draw[decorate, color=blue, line width=2, decoration=snake] (0, 0) to (6, 0);\end{tikzpicture}print(fig.generate_standalone())\documentclass[border=10pt]{standalone}\PassOptionsToPackage{dvipsnames,svgnames,x11names}{xcolor}\usepackage{tikz}\usepackage{pgfplots}\pgfplotsset{compat=newest}\usepgfplotslibrary{groupplots}\usetikzlibrary{arrows.meta}% Custom document setup\usetikzlibrary{decorations.pathmorphing}\begin{document}% --------------------------------------------- %% Tikzfigure generated by tikzfigure v0.3.1 %% https://github.com/max-models/tikzfigure %% --------------------------------------------- %\begin{tikzpicture} \draw[decorate, color=blue, line width=2, decoration=snake] (0, 0) to (6, 0);\end{tikzpicture}
\end{document}decoration="coil"
Section titled “decoration="coil"”A coil decoration draws a helical spring along the path. It works well for physics diagrams.
fig = TikzFigure(    document_setup=r"\usetikzlibrary{decorations.pathmorphing}",)
fig.draw(    [(0, 0), (6, 0)],    options=[styles.decorate],    decoration=decorations.coil,    line_width=1.5,    color="teal",)
fig.show()
Show Tikz code
print(fig)% --------------------------------------------- %% Tikzfigure generated by tikzfigure v0.3.1 %% https://github.com/max-models/tikzfigure %% --------------------------------------------- %\begin{tikzpicture} \draw[decorate, color=teal, line width=1.5, decoration=coil] (0, 0) to (6, 0);\end{tikzpicture}print(fig.generate_standalone())\documentclass[border=10pt]{standalone}\PassOptionsToPackage{dvipsnames,svgnames,x11names}{xcolor}\usepackage{tikz}\usepackage{pgfplots}\pgfplotsset{compat=newest}\usepgfplotslibrary{groupplots}\usetikzlibrary{arrows.meta}% Custom document setup\usetikzlibrary{decorations.pathmorphing}\begin{document}% --------------------------------------------- %% Tikzfigure generated by tikzfigure v0.3.1 %% https://github.com/max-models/tikzfigure %% --------------------------------------------- %\begin{tikzpicture} \draw[decorate, color=teal, line width=1.5, decoration=coil] (0, 0) to (6, 0);\end{tikzpicture}
\end{document}decoration="bumps"
Section titled “decoration="bumps"”Bumps produce smooth humps along the path — similar to a snake but with the oscillation only on one side.
fig = TikzFigure(    document_setup=r"\usetikzlibrary{decorations.pathmorphing}",)
fig.draw(    [(0, 0), (6, 0)],    options=[styles.decorate],    decoration=decorations.bumps,    line_width=2,    color="orange",)
fig.show()
Show Tikz code
print(fig)% --------------------------------------------- %% Tikzfigure generated by tikzfigure v0.3.1 %% https://github.com/max-models/tikzfigure %% --------------------------------------------- %\begin{tikzpicture} \draw[decorate, color=orange, line width=2, decoration=bumps] (0, 0) to (6, 0);\end{tikzpicture}print(fig.generate_standalone())\documentclass[border=10pt]{standalone}\PassOptionsToPackage{dvipsnames,svgnames,x11names}{xcolor}\usepackage{tikz}\usepackage{pgfplots}\pgfplotsset{compat=newest}\usepgfplotslibrary{groupplots}\usetikzlibrary{arrows.meta}% Custom document setup\usetikzlibrary{decorations.pathmorphing}\begin{document}% --------------------------------------------- %% Tikzfigure generated by tikzfigure v0.3.1 %% https://github.com/max-models/tikzfigure %% --------------------------------------------- %\begin{tikzpicture} \draw[decorate, color=orange, line width=2, decoration=bumps] (0, 0) to (6, 0);\end{tikzpicture}
\end{document}Side-by-side gallery of morphing decorations
Section titled “Side-by-side gallery of morphing decorations”Showing all four morphing decorations together, each with a label, makes it easy to choose the right one for your diagram.
fig = TikzFigure(    document_setup=r"\usetikzlibrary{decorations.pathmorphing}",)
decoration_specs = [    (decorations.zigzag, "red"),    (decorations.snake, "blue"),    (decorations.coil, "teal"),    (decorations.bumps, "orange"),]
for i, (dec, color) in enumerate(decoration_specs):    y = -i * 1.4    fig.draw(        [(0, y), (5, y)],        options=[styles.decorate],        decoration=dec,        line_width=2,        color=color,    )    fig.node(        5.3,        y,        content=f"\\texttt{{{dec}}}",        draw="none",        anchor="west",        font=r"\small",    )
fig.show()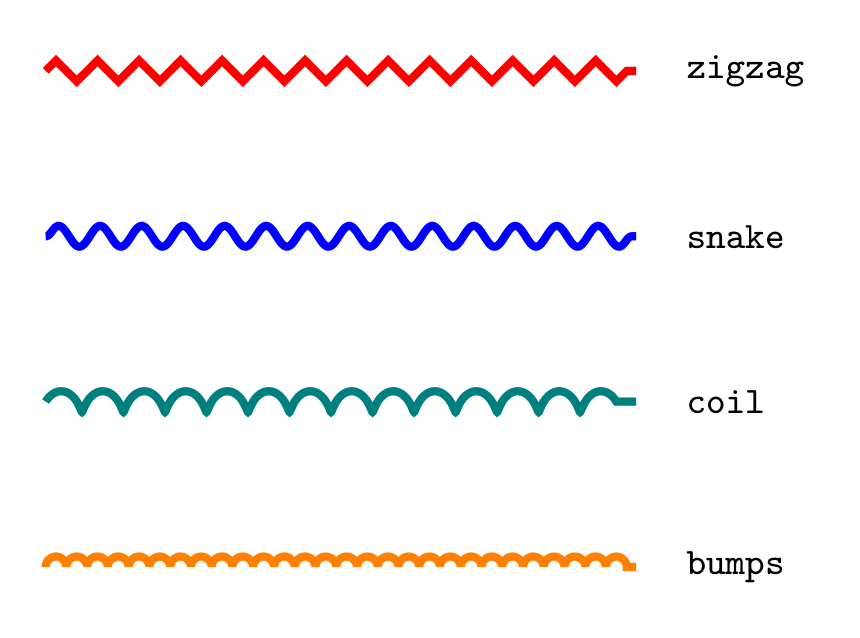
Show Tikz code
print(fig)% --------------------------------------------- %% Tikzfigure generated by tikzfigure v0.3.1 %% https://github.com/max-models/tikzfigure %% --------------------------------------------- %\begin{tikzpicture} \draw[decorate, color=red, line width=2, decoration=zigzag] (0, 0.0) to (5, 0.0); \node[draw=none, font=\small, anchor=west] (node0) at ({5.3}, {0.0}) {\texttt{zigzag}}; \draw[decorate, color=blue, line width=2, decoration=snake] (0, -1.4) to (5, -1.4); \node[draw=none, font=\small, anchor=west] (node1) at ({5.3}, {-1.4}) {\texttt{snake}}; \draw[decorate, color=teal, line width=2, decoration=coil] (0, -2.8) to (5, -2.8); \node[draw=none, font=\small, anchor=west] (node2) at ({5.3}, {-2.8}) {\texttt{coil}}; \draw[decorate, color=orange, line width=2, decoration=bumps] (0, -4.199999999999999) to (5, -4.199999999999999); \node[draw=none, font=\small, anchor=west] (node3) at ({5.3}, {-4.199999999999999}) {\texttt{bumps}};\end{tikzpicture}print(fig.generate_standalone())\documentclass[border=10pt]{standalone}\PassOptionsToPackage{dvipsnames,svgnames,x11names}{xcolor}\usepackage{tikz}\usepackage{pgfplots}\pgfplotsset{compat=newest}\usepgfplotslibrary{groupplots}\usetikzlibrary{arrows.meta}% Custom document setup\usetikzlibrary{decorations.pathmorphing}\begin{document}% --------------------------------------------- %% Tikzfigure generated by tikzfigure v0.3.1 %% https://github.com/max-models/tikzfigure %% --------------------------------------------- %\begin{tikzpicture} \draw[decorate, color=red, line width=2, decoration=zigzag] (0, 0.0) to (5, 0.0); \node[draw=none, font=\small, anchor=west] (node0) at ({5.3}, {0.0}) {\texttt{zigzag}}; \draw[decorate, color=blue, line width=2, decoration=snake] (0, -1.4) to (5, -1.4); \node[draw=none, font=\small, anchor=west] (node1) at ({5.3}, {-1.4}) {\texttt{snake}}; \draw[decorate, color=teal, line width=2, decoration=coil] (0, -2.8) to (5, -2.8); \node[draw=none, font=\small, anchor=west] (node2) at ({5.3}, {-2.8}) {\texttt{coil}}; \draw[decorate, color=orange, line width=2, decoration=bumps] (0, -4.199999999999999) to (5, -4.199999999999999); \node[draw=none, font=\small, anchor=west] (node3) at ({5.3}, {-4.199999999999999}) {\texttt{bumps}};\end{tikzpicture}
\end{document}decoration="brace": bracket annotations
Section titled “decoration="brace": bracket annotations”The "brace" decoration draws a curly bracket spanning two points. It
requires the decorations.pathreplacing library.
Use a brace to annotate the width or height of a region in your diagram. Draw the brace from right to left (or bottom to top) so the bracket opens toward the region.
fig = TikzFigure(    document_setup=(        r"\usetikzlibrary{decorations.pathmorphing}"        "\n"        r"\usetikzlibrary{decorations.pathreplacing}"    ),)
# The region being annotatedfig.node(    (2, 1),    shape=shapes.rectangle,    fill="blue!15",    draw="blue!50",    minimum_width="4cm",    minimum_height="1.5cm",    content="annotated region",)
# Horizontal brace below the rectangle (right-to-left so the brace opens upward)fig.draw(    [(4, 0.1), (0, 0.1)],    options=[styles.decorate],    decoration=decorations.brace,    line_width=1.5,    color="blue!70",)fig.node(    (2, -0.45),    content="4 cm wide",    draw="none",    color="blue!70",    font=r"\small",)
# Vertical brace on the right side (bottom-to-top so the brace opens rightward)fig.draw(    [(4.15, 0.25), (4.15, 1.75)],    options=[styles.decorate],    decoration=decorations.brace,    line_width=1.5,    color="red!70",)fig.node(    (5.0, 1.0),    content="1.5 cm",    draw="none",    color="red!70",    font=r"\small",    anchor="west",)
fig.show()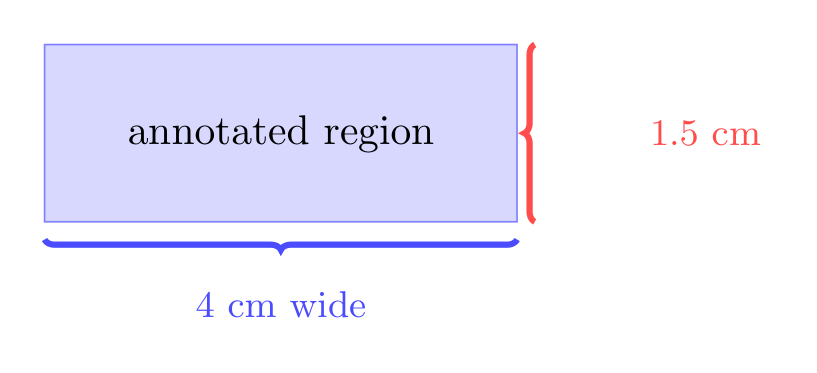
Show Tikz code
print(fig)% --------------------------------------------- %% Tikzfigure generated by tikzfigure v0.3.1 %% https://github.com/max-models/tikzfigure %% --------------------------------------------- %\begin{tikzpicture} \node[shape=rectangle, fill=blue!15, draw=blue!50, minimum width=4cm, minimum height=1.5cm] (node0) at ({2}, {1}) {annotated region}; \draw[decorate, color=blue!70, line width=1.5, decoration=brace] (4, 0.1) to (0, 0.1); \node[color=blue!70, draw=none, font=\small] (node1) at ({2}, {-0.45}) {4 cm wide}; \draw[decorate, color=red!70, line width=1.5, decoration=brace] (4.15, 0.25) to (4.15, 1.75); \node[color=red!70, draw=none, font=\small, anchor=west] (node2) at ({5.0}, {1.0}) {1.5 cm};\end{tikzpicture}print(fig.generate_standalone())\documentclass[border=10pt]{standalone}\PassOptionsToPackage{dvipsnames,svgnames,x11names}{xcolor}\usepackage{tikz}\usepackage{pgfplots}\pgfplotsset{compat=newest}\usepgfplotslibrary{groupplots}\usetikzlibrary{arrows.meta}% Custom document setup\usetikzlibrary{decorations.pathmorphing}\usetikzlibrary{decorations.pathreplacing}\begin{document}% --------------------------------------------- %% Tikzfigure generated by tikzfigure v0.3.1 %% https://github.com/max-models/tikzfigure %% --------------------------------------------- %\begin{tikzpicture} \node[shape=rectangle, fill=blue!15, draw=blue!50, minimum width=4cm, minimum height=1.5cm] (node0) at ({2}, {1}) {annotated region}; \draw[decorate, color=blue!70, line width=1.5, decoration=brace] (4, 0.1) to (0, 0.1); \node[color=blue!70, draw=none, font=\small] (node1) at ({2}, {-0.45}) {4 cm wide}; \draw[decorate, color=red!70, line width=1.5, decoration=brace] (4.15, 0.25) to (4.15, 1.75); \node[color=red!70, draw=none, font=\small, anchor=west] (node2) at ({5.0}, {1.0}) {1.5 cm};\end{tikzpicture}
\end{document}Combining decorations with colors and line widths
Section titled “Combining decorations with colors and line widths”Decorations become more expressive when combined with thick lines and vivid colors. Here is a physics-style figure with springs, a snake rope, and a bumpy road.
fig = TikzFigure(    document_setup=(        r"\usetikzlibrary{decorations.pathmorphing}"        "\n"        r"\usetikzlibrary{decorations.pathreplacing}"    ),)
# Ground line (zigzag = rough terrain)fig.draw(    [(0, 0), (8, 0)],    options=["decorate"],    decoration="zigzag",    line_width=2,    color="brown!70",)
# Springs connecting ground to ceilingfig.draw(    [(1, 0), (1, 3)],    options=["decorate"],    decoration="coil",    line_width=2,    color="gray!70",)fig.draw(    [(7, 0), (7, 3)],    options=["decorate"],    decoration="coil",    line_width=2,    color="gray!70",)
# Snake rope across the topfig.draw(    [(1, 3), (7, 3)],    options=["decorate"],    decoration="snake",    line_width=2.5,    color="orange!80",)
# Bumpy road in the middlefig.draw(    [(2, 1.5), (6, 1.5)],    options=["decorate"],    decoration="bumps",    line_width=2,    color="teal",)
# Anchor nodesfor x in [1, 7]:    fig.node(        x,        3,        shape="circle",        fill="gray!50",        draw="gray",        minimum_size="0.3cm",    )    fig.node(        x,        0,        shape="rectangle",        fill="brown!40",        draw="brown",        minimum_width="0.4cm",        minimum_height="0.2cm",    )
fig.show()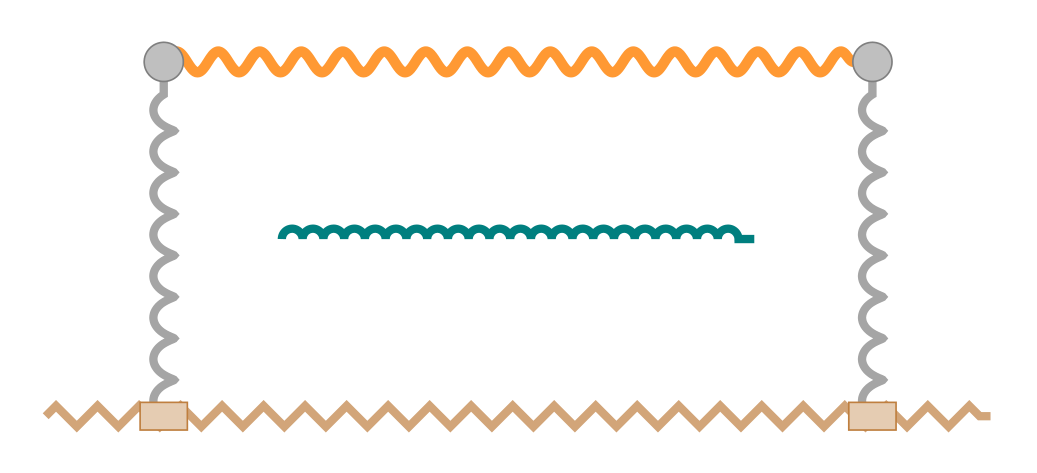
Show Tikz code
print(fig)% --------------------------------------------- %% Tikzfigure generated by tikzfigure v0.3.1 %% https://github.com/max-models/tikzfigure %% --------------------------------------------- %\begin{tikzpicture} \draw[decorate, color=brown!70, line width=2, decoration=zigzag] (0, 0) to (8, 0); \draw[decorate, color=gray!70, line width=2, decoration=coil] (1, 0) to (1, 3); \draw[decorate, color=gray!70, line width=2, decoration=coil] (7, 0) to (7, 3); \draw[decorate, color=orange!80, line width=2.5, decoration=snake] (1, 3) to (7, 3); \draw[decorate, color=teal, line width=2, decoration=bumps] (2, 1.5) to (6, 1.5); \node[shape=circle, fill=gray!50, draw=gray, minimum size=0.3cm] (node0) at ({1}, {3}) {}; \node[shape=rectangle, fill=brown!40, draw=brown, minimum width=0.4cm, minimum height=0.2cm] (node1) at ({1}, {0}) {}; \node[shape=circle, fill=gray!50, draw=gray, minimum size=0.3cm] (node2) at ({7}, {3}) {}; \node[shape=rectangle, fill=brown!40, draw=brown, minimum width=0.4cm, minimum height=0.2cm] (node3) at ({7}, {0}) {};\end{tikzpicture}print(fig.generate_standalone())\documentclass[border=10pt]{standalone}\PassOptionsToPackage{dvipsnames,svgnames,x11names}{xcolor}\usepackage{tikz}\usepackage{pgfplots}\pgfplotsset{compat=newest}\usepgfplotslibrary{groupplots}\usetikzlibrary{arrows.meta}% Custom document setup\usetikzlibrary{decorations.pathmorphing}\usetikzlibrary{decorations.pathreplacing}\begin{document}% --------------------------------------------- %% Tikzfigure generated by tikzfigure v0.3.1 %% https://github.com/max-models/tikzfigure %% --------------------------------------------- %\begin{tikzpicture} \draw[decorate, color=brown!70, line width=2, decoration=zigzag] (0, 0) to (8, 0); \draw[decorate, color=gray!70, line width=2, decoration=coil] (1, 0) to (1, 3); \draw[decorate, color=gray!70, line width=2, decoration=coil] (7, 0) to (7, 3); \draw[decorate, color=orange!80, line width=2.5, decoration=snake] (1, 3) to (7, 3); \draw[decorate, color=teal, line width=2, decoration=bumps] (2, 1.5) to (6, 1.5); \node[shape=circle, fill=gray!50, draw=gray, minimum size=0.3cm] (node0) at ({1}, {3}) {}; \node[shape=rectangle, fill=brown!40, draw=brown, minimum width=0.4cm, minimum height=0.2cm] (node1) at ({1}, {0}) {}; \node[shape=circle, fill=gray!50, draw=gray, minimum size=0.3cm] (node2) at ({7}, {3}) {}; \node[shape=rectangle, fill=brown!40, draw=brown, minimum width=0.4cm, minimum height=0.2cm] (node3) at ({7}, {0}) {};\end{tikzpicture}
\end{document}