Getting Started
tikzfigure is a Python library for building TikZ (LaTeX) figures programmatically. You describe your drawing with Python objects and method calls; tikzfigure turns them into LaTeX/TikZ code that can be compiled to PDF or rendered to PNG.
This first tutorial covers the absolute basics:
- creating a
TikzFigure - adding nodes
- drawing connections
- displaying and saving the result
- inspecting the generated TikZ code
from tikzfigure import Node, TikzFigure, arrows, shapes, stylesYour first figure
Section titled “Your first figure”A TikzFigure is the canvas. Nodes are placed on it with
node(x, y, ...), and connections are drawn with
draw([node_a, node_b], ...). Call show() to compile and display the
result inline.
fig = TikzFigure()
n1 = fig.node(    (0, 0),    shape=shapes.circle,    color="white",    fill="blue",    content="Hello!",)n2 = fig.node(    (5, 0),    shape=shapes.circle,    color="white",    fill="red",    content="Hi!",)
fig.draw(    [n1, n2],    arrows=arrows.forward,    line_width=2,    color="gray",)
fig.show()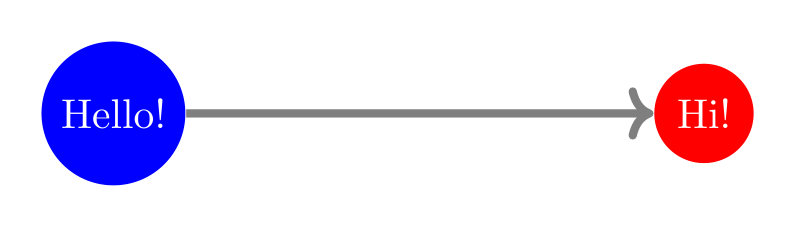
Show Tikz code
print(fig)% --------------------------------------------- %% Tikzfigure generated by tikzfigure v0.3.1 %% https://github.com/max-models/tikzfigure %% --------------------------------------------- %\begin{tikzpicture} \node[shape=circle, color=white, fill=blue] (node0) at ({0}, {0}) {Hello!}; \node[shape=circle, color=white, fill=red] (node1) at ({5}, {0}) {Hi!}; \draw[->, color=gray, line width=2] (node0) to (node1);\end{tikzpicture}print(fig.generate_standalone())\documentclass[border=10pt]{standalone}\PassOptionsToPackage{dvipsnames,svgnames,x11names}{xcolor}\usepackage{tikz}\usepackage{pgfplots}\pgfplotsset{compat=newest}\usepgfplotslibrary{groupplots}\usetikzlibrary{arrows.meta}\begin{document}% --------------------------------------------- %% Tikzfigure generated by tikzfigure v0.3.1 %% https://github.com/max-models/tikzfigure %% --------------------------------------------- %\begin{tikzpicture} \node[shape=circle, color=white, fill=blue] (node0) at ({0}, {0}) {Hello!}; \node[shape=circle, color=white, fill=red] (node1) at ({5}, {0}) {Hi!}; \draw[->, color=gray, line width=2] (node0) to (node1);\end{tikzpicture}
\end{document}Inspecting the generated TikZ code
Section titled “Inspecting the generated TikZ code”generate_tikz() returns the raw LaTeX/TikZ string. This is useful for
debugging or for pasting code directly into a .tex file.
print(fig)% --------------------------------------------- %% Tikzfigure generated by tikzfigure v0.3.1 %% https://github.com/max-models/tikzfigure %% --------------------------------------------- %\begin{tikzpicture} \node[shape=circle, color=white, fill=blue] (node0) at ({0}, {0}) {Hello!}; \node[shape=circle, color=white, fill=red] (node1) at ({5}, {0}) {Hi!}; \draw[->, color=gray, line width=2] (node0) to (node1);\end{tikzpicture}Alternative: create nodes independently
Section titled “Alternative: create nodes independently”You can also construct Node objects directly and then register them
with fig.add(), which is handy when building nodes in a loop or helper
function.
Note that when drawing the arrow, we can either reference the node with
the node instance (n1) or its label (node1).
fig2 = TikzFigure()
n1 = Node(    (0, 0),    label="node1",    shape="circle",    color="white",    fill="blue",    content="Hello!",)n2 = Node(    (5, 0),    label="node2",    shape="circle",    color="white",    fill="red",    content="Hi!",)
fig2.add([n1, n2])# Note that we can use the node labels to refer to them when drawing edgesfig2.draw(    ["node1", n2],    arrows=arrows.backward,    line_width=2,    color="gray",)
fig2.show()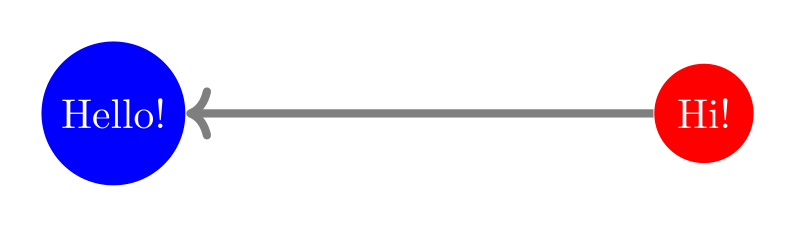
Show Tikz code
print(fig)% --------------------------------------------- %% Tikzfigure generated by tikzfigure v0.3.1 %% https://github.com/max-models/tikzfigure %% --------------------------------------------- %\begin{tikzpicture} \node[shape=circle, color=white, fill=blue] (node0) at ({0}, {0}) {Hello!}; \node[shape=circle, color=white, fill=red] (node1) at ({5}, {0}) {Hi!}; \draw[->, color=gray, line width=2] (node0) to (node1);\end{tikzpicture}print(fig.generate_standalone())\documentclass[border=10pt]{standalone}\PassOptionsToPackage{dvipsnames,svgnames,x11names}{xcolor}\usepackage{tikz}\usepackage{pgfplots}\pgfplotsset{compat=newest}\usepgfplotslibrary{groupplots}\usetikzlibrary{arrows.meta}\begin{document}% --------------------------------------------- %% Tikzfigure generated by tikzfigure v0.3.1 %% https://github.com/max-models/tikzfigure %% --------------------------------------------- %\begin{tikzpicture} \node[shape=circle, color=white, fill=blue] (node0) at ({0}, {0}) {Hello!}; \node[shape=circle, color=white, fill=red] (node1) at ({5}, {0}) {Hi!}; \draw[->, color=gray, line width=2] (node0) to (node1);\end{tikzpicture}
\end{document}A simple directed graph
Section titled “A simple directed graph”Here we place four nodes and connect them with arrows.
fig.add_copy(...) clones a node and inserts the clone into the current
figure in one step. If the source node only has an auto-generated label,
the new copy gets the next automatic node<N> label in this figure.
bend_left curves the arrow - positive values bend it left relative to
the direction of travel.
fig = TikzFigure()
A = fig.node(    (0, 2),    content="A",    shape="circle",    fill="cyan!40",)B = fig.add_copy(A, x=3, y=2, content="B")C = fig.add_copy(A, x=0, y=0, content="C")D = fig.add_copy(A, x=3, y=0, content="D")
fig.draw([A, B], arrows=arrows.forward)fig.draw([A, C], arrows=arrows.forward)fig.draw([B, D], arrows=arrows.forward)fig.draw([C, D], arrows=arrows.forward)fig.draw(    [A, D],    arrows=arrows.forward,    options=styles.dashed,    bend_left=20,    color="gray",)
fig.show()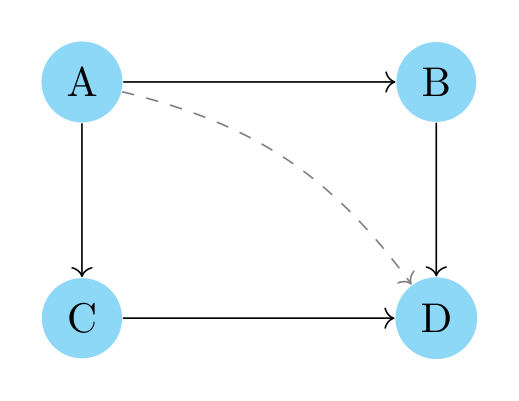
Show Tikz code
print(fig)% --------------------------------------------- %% Tikzfigure generated by tikzfigure v0.3.1 %% https://github.com/max-models/tikzfigure %% --------------------------------------------- %\begin{tikzpicture} \node[shape=circle, fill=cyan!40] (node0) at ({0}, {2}) {A}; \node[shape=circle, fill=cyan!40] (node1) at ({3}, {2}) {B}; \node[shape=circle, fill=cyan!40] (node2) at ({0}, {0}) {C}; \node[shape=circle, fill=cyan!40] (node3) at ({3}, {0}) {D}; \draw[->] (node0) to (node1); \draw[->] (node0) to (node2); \draw[->] (node1) to (node3); \draw[->] (node2) to (node3); \draw[dashed, ->, color=gray, bend left=20] (node0) to (node3);\end{tikzpicture}print(fig.generate_standalone())\documentclass[border=10pt]{standalone}\PassOptionsToPackage{dvipsnames,svgnames,x11names}{xcolor}\usepackage{tikz}\usepackage{pgfplots}\pgfplotsset{compat=newest}\usepgfplotslibrary{groupplots}\usetikzlibrary{arrows.meta}\begin{document}% --------------------------------------------- %% Tikzfigure generated by tikzfigure v0.3.1 %% https://github.com/max-models/tikzfigure %% --------------------------------------------- %\begin{tikzpicture} \node[shape=circle, fill=cyan!40] (node0) at ({0}, {2}) {A}; \node[shape=circle, fill=cyan!40] (node1) at ({3}, {2}) {B}; \node[shape=circle, fill=cyan!40] (node2) at ({0}, {0}) {C}; \node[shape=circle, fill=cyan!40] (node3) at ({3}, {0}) {D}; \draw[->] (node0) to (node1); \draw[->] (node0) to (node2); \draw[->] (node1) to (node3); \draw[->] (node2) to (node3); \draw[dashed, ->, color=gray, bend left=20] (node0) to (node3);\end{tikzpicture}
\end{document}Saving to disk
Section titled “Saving to disk”savefig() compiles the figure and writes a PDF or rasterised image
(PNG/JPG). The format is determined by the file extension.
# fig.savefig("graph.pdf")# fig.savefig("graph.png")