Advanced Styling
This tutorial covers advanced visual styling options that go beyond basic colors and line widths:
doubleanddouble_distancefor double-bordered nodes and pathsdash_patternanddash_phasefor custom dash sequencesline_capstyles: butt, rect, roundline_joinstyles: miter, bevel, round- shadow effects:
shadow_xshift,shadow_yshift,shadow_color pinannotations: attaching small labels to nodes- special shapes: star, regular polygon, cylinder
from tikzfigure import TikzFigure, arrowsdouble and double_distance: double borders
Section titled “double and double_distance: double borders”The double parameter draws a second parallel stroke, creating a
double-border effect. double_distance controls the gap between the two
strokes. Setting double="white" with a colored outer stroke gives a
classic railway-line look.
fig = TikzFigure()
# Double-bordered node with white gap (railway style)fig.node(    (0, 0),    shape="rectangle",    draw="black",    fill="gray!10",    double="white",    double_distance="3pt",    minimum_width="2.5cm",    minimum_height="1cm",    content="double=white",    line_width=1.5,)
# Double-bordered with black inner linefig.node(    (4, 0),    shape="rectangle",    draw="blue!70",    fill="blue!10",    double="blue!70",    double_distance="2pt",    minimum_width="2.5cm",    minimum_height="1cm",    content="double=blue",    line_width=1,)
# Double on a circlefig.node(    (8, 0),    shape="circle",    draw="red!70",    fill="red!10",    double="red!70",    double_distance="2pt",    minimum_size="1.5cm",    content="circle",    line_width=1,)
# Double on a path (railway track)fig.draw(    [(0, -1.8), (8, -1.8)],    double="white",    double_distance="4pt",    line_width=2,    color="black",)fig.node(    (4, -2.3),    content="railway track (double path)",    draw="none",    font=r"\small\itshape",)
fig.show()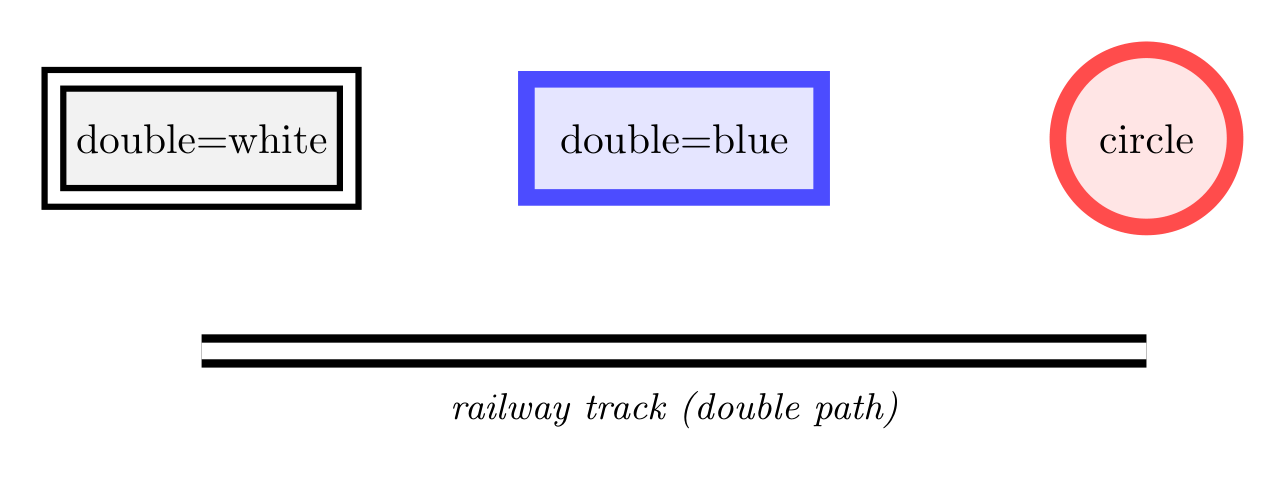
Show Tikz code
print(fig)% --------------------------------------------- %% Tikzfigure generated by tikzfigure v0.3.1 %% https://github.com/max-models/tikzfigure %% --------------------------------------------- %\begin{tikzpicture} \node[shape=rectangle, fill=gray!10, draw=black, minimum width=2.5cm, minimum height=1cm, line width=1.5, double=white, double distance=3pt] (node0) at ({0}, {0}) {double=white}; \node[shape=rectangle, fill=blue!10, draw=blue!70, minimum width=2.5cm, minimum height=1cm, line width=1, double=blue!70, double distance=2pt] (node1) at ({4}, {0}) {double=blue}; \node[shape=circle, fill=red!10, draw=red!70, minimum size=1.5cm, line width=1, double=red!70, double distance=2pt] (node2) at ({8}, {0}) {circle}; \draw[color=black, line width=2, double=white, double distance=4pt] (0, -1.8) to (8, -1.8); \node[draw=none, font=\small\itshape] (node3) at ({4}, {-2.3}) {railway track (double path)};\end{tikzpicture}print(fig.generate_standalone())\documentclass[border=10pt]{standalone}\PassOptionsToPackage{dvipsnames,svgnames,x11names}{xcolor}\usepackage{tikz}\usepackage{pgfplots}\pgfplotsset{compat=newest}\usepgfplotslibrary{groupplots}\usetikzlibrary{arrows.meta}\begin{document}% --------------------------------------------- %% Tikzfigure generated by tikzfigure v0.3.1 %% https://github.com/max-models/tikzfigure %% --------------------------------------------- %\begin{tikzpicture} \node[shape=rectangle, fill=gray!10, draw=black, minimum width=2.5cm, minimum height=1cm, line width=1.5, double=white, double distance=3pt] (node0) at ({0}, {0}) {double=white}; \node[shape=rectangle, fill=blue!10, draw=blue!70, minimum width=2.5cm, minimum height=1cm, line width=1, double=blue!70, double distance=2pt] (node1) at ({4}, {0}) {double=blue}; \node[shape=circle, fill=red!10, draw=red!70, minimum size=1.5cm, line width=1, double=red!70, double distance=2pt] (node2) at ({8}, {0}) {circle}; \draw[color=black, line width=2, double=white, double distance=4pt] (0, -1.8) to (8, -1.8); \node[draw=none, font=\small\itshape] (node3) at ({4}, {-2.3}) {railway track (double path)};\end{tikzpicture}
\end{document}dash_pattern and dash_phase: custom dash sequences
Section titled “dash_pattern and dash_phase: custom dash sequences”dash_pattern accepts a TikZ dash specification string such as
"on 5pt off 3pt". You can combine multiple on/off segments for complex
patterns. dash_phase shifts the starting position within the pattern.
fig = TikzFigure()
patterns = [    ("on 3pt off 2pt", 0, "on 3 off 2"),    ("on 1pt off 1pt on 5pt off 1pt", 0, "on 1 off 1 on 5 off 1"),    ("on 6pt off 2pt on 1pt off 2pt", 0, "on 6 off 2 on 1 off 2"),    ("on 2pt off 2pt", 3, "on 2 off 2, phase=3pt"),]
for i, (dp, phase, label) in enumerate(patterns):    y = -i * 1.3    fig.draw(        [(0, y), (6, y)],        dash_pattern=dp,        dash_phase=f"{phase}pt" if phase else None,        line_width=2,        color="black",    )    fig.node(        6.2,        y,        content=f"\\texttt{{{label}}}",        draw="none",        anchor="west",        font=r"\tiny",    )
fig.show()
Show Tikz code
print(fig)% --------------------------------------------- %% Tikzfigure generated by tikzfigure v0.3.1 %% https://github.com/max-models/tikzfigure %% --------------------------------------------- %\begin{tikzpicture} \draw[color=black, line width=2, dash pattern=on 3pt off 2pt] (0, 0.0) to (6, 0.0); \node[draw=none, font=\tiny, anchor=west] (node0) at ({6.2}, {0.0}) {\texttt{on 3 off 2}}; \draw[color=black, line width=2, dash pattern=on 1pt off 1pt on 5pt off 1pt] (0, -1.3) to (6, -1.3); \node[draw=none, font=\tiny, anchor=west] (node1) at ({6.2}, {-1.3}) {\texttt{on 1 off 1 on 5 off 1}}; \draw[color=black, line width=2, dash pattern=on 6pt off 2pt on 1pt off 2pt] (0, -2.6) to (6, -2.6); \node[draw=none, font=\tiny, anchor=west] (node2) at ({6.2}, {-2.6}) {\texttt{on 6 off 2 on 1 off 2}}; \draw[color=black, line width=2, dash pattern=on 2pt off 2pt, dash phase=3pt] (0, -3.9000000000000004) to (6, -3.9000000000000004); \node[draw=none, font=\tiny, anchor=west] (node3) at ({6.2}, {-3.9000000000000004}) {\texttt{on 2 off 2, phase=3pt}};\end{tikzpicture}print(fig.generate_standalone())\documentclass[border=10pt]{standalone}\PassOptionsToPackage{dvipsnames,svgnames,x11names}{xcolor}\usepackage{tikz}\usepackage{pgfplots}\pgfplotsset{compat=newest}\usepgfplotslibrary{groupplots}\usetikzlibrary{arrows.meta}\begin{document}% --------------------------------------------- %% Tikzfigure generated by tikzfigure v0.3.1 %% https://github.com/max-models/tikzfigure %% --------------------------------------------- %\begin{tikzpicture} \draw[color=black, line width=2, dash pattern=on 3pt off 2pt] (0, 0.0) to (6, 0.0); \node[draw=none, font=\tiny, anchor=west] (node0) at ({6.2}, {0.0}) {\texttt{on 3 off 2}}; \draw[color=black, line width=2, dash pattern=on 1pt off 1pt on 5pt off 1pt] (0, -1.3) to (6, -1.3); \node[draw=none, font=\tiny, anchor=west] (node1) at ({6.2}, {-1.3}) {\texttt{on 1 off 1 on 5 off 1}}; \draw[color=black, line width=2, dash pattern=on 6pt off 2pt on 1pt off 2pt] (0, -2.6) to (6, -2.6); \node[draw=none, font=\tiny, anchor=west] (node2) at ({6.2}, {-2.6}) {\texttt{on 6 off 2 on 1 off 2}}; \draw[color=black, line width=2, dash pattern=on 2pt off 2pt, dash phase=3pt] (0, -3.9000000000000004) to (6, -3.9000000000000004); \node[draw=none, font=\tiny, anchor=west] (node3) at ({6.2}, {-3.9000000000000004}) {\texttt{on 2 off 2, phase=3pt}};\end{tikzpicture}
\end{document}line_cap: end-cap styles
Section titled “line_cap: end-cap styles”line_cap controls how the ends of thick open paths are rendered.
"butt" cuts flat at the endpoint, "rect" extends a half-linewidth
rectangle past the endpoint, and "round" caps with a semicircle.
fig = TikzFigure()
caps = ["butt", "rect", "round"]
for i, cap in enumerate(caps):    y = -i * 1.5    fig.draw(        [(0.5, y), (4.5, y)],        line_cap=cap,        line_width=12,        color="blue!60",    )    # Thin reference line to show exact endpoint    fig.draw(        [(0.5, y - 0.5), (0.5, y + 0.5)],        line_width=0.5,        color="red",    )    fig.draw(        [(4.5, y - 0.5), (4.5, y + 0.5)],        line_width=0.5,        color="red",    )    fig.node(        5.2,        y,        content=f"\\texttt{{{cap}}}",        draw="none",        anchor="west",        font=r"\small",    )
fig.show()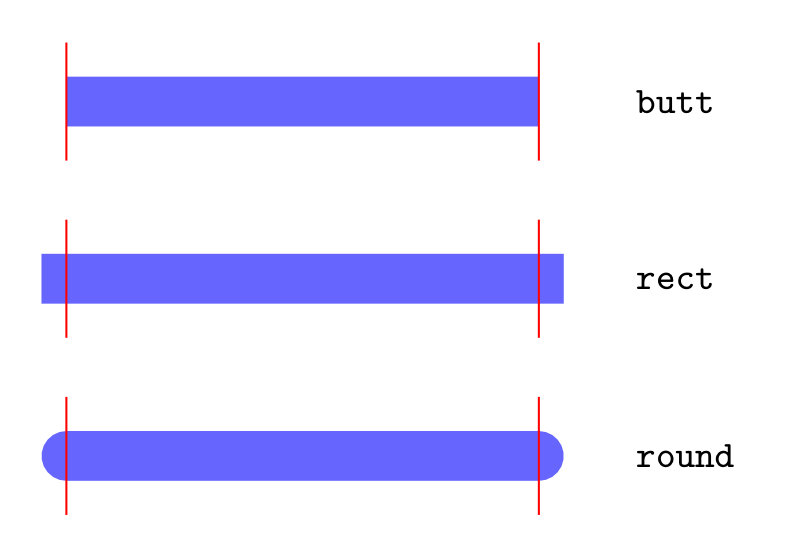
Show Tikz code
print(fig)% --------------------------------------------- %% Tikzfigure generated by tikzfigure v0.3.1 %% https://github.com/max-models/tikzfigure %% --------------------------------------------- %\begin{tikzpicture} \draw[color=blue!60, line width=12, line cap=butt] (0.5, 0.0) to (4.5, 0.0); \draw[color=red, line width=0.5] (0.5, -0.5) to (0.5, 0.5); \draw[color=red, line width=0.5] (4.5, -0.5) to (4.5, 0.5); \node[draw=none, font=\small, anchor=west] (node0) at ({5.2}, {0.0}) {\texttt{butt}}; \draw[color=blue!60, line width=12, line cap=rect] (0.5, -1.5) to (4.5, -1.5); \draw[color=red, line width=0.5] (0.5, -2.0) to (0.5, -1.0); \draw[color=red, line width=0.5] (4.5, -2.0) to (4.5, -1.0); \node[draw=none, font=\small, anchor=west] (node1) at ({5.2}, {-1.5}) {\texttt{rect}}; \draw[color=blue!60, line width=12, line cap=round] (0.5, -3.0) to (4.5, -3.0); \draw[color=red, line width=0.5] (0.5, -3.5) to (0.5, -2.5); \draw[color=red, line width=0.5] (4.5, -3.5) to (4.5, -2.5); \node[draw=none, font=\small, anchor=west] (node2) at ({5.2}, {-3.0}) {\texttt{round}};\end{tikzpicture}print(fig.generate_standalone())\documentclass[border=10pt]{standalone}\PassOptionsToPackage{dvipsnames,svgnames,x11names}{xcolor}\usepackage{tikz}\usepackage{pgfplots}\pgfplotsset{compat=newest}\usepgfplotslibrary{groupplots}\usetikzlibrary{arrows.meta}\begin{document}% --------------------------------------------- %% Tikzfigure generated by tikzfigure v0.3.1 %% https://github.com/max-models/tikzfigure %% --------------------------------------------- %\begin{tikzpicture} \draw[color=blue!60, line width=12, line cap=butt] (0.5, 0.0) to (4.5, 0.0); \draw[color=red, line width=0.5] (0.5, -0.5) to (0.5, 0.5); \draw[color=red, line width=0.5] (4.5, -0.5) to (4.5, 0.5); \node[draw=none, font=\small, anchor=west] (node0) at ({5.2}, {0.0}) {\texttt{butt}}; \draw[color=blue!60, line width=12, line cap=rect] (0.5, -1.5) to (4.5, -1.5); \draw[color=red, line width=0.5] (0.5, -2.0) to (0.5, -1.0); \draw[color=red, line width=0.5] (4.5, -2.0) to (4.5, -1.0); \node[draw=none, font=\small, anchor=west] (node1) at ({5.2}, {-1.5}) {\texttt{rect}}; \draw[color=blue!60, line width=12, line cap=round] (0.5, -3.0) to (4.5, -3.0); \draw[color=red, line width=0.5] (0.5, -3.5) to (0.5, -2.5); \draw[color=red, line width=0.5] (4.5, -3.5) to (4.5, -2.5); \node[draw=none, font=\small, anchor=west] (node2) at ({5.2}, {-3.0}) {\texttt{round}};\end{tikzpicture}
\end{document}line_join: corner join styles
Section titled “line_join: corner join styles”line_join controls how two path segments meet at a corner. "miter"
extends to a sharp point, "bevel" cuts the corner flat, and "round"
rounds it.
fig = TikzFigure()
joins = ["miter", "bevel", "round"]
for i, join in enumerate(joins):    x0 = i * 4    zigzag = [(x0 + 0, 0), (x0 + 1, 2), (x0 + 2, 0), (x0 + 3, 2)]    fig.draw(        zigzag,        line_join=join,        line_width=8,        color="teal!70",    )    fig.node(        x0 + 1.5,        -0.6,        content=f"\\texttt{{{join}}}",        draw="none",        font=r"\small",    )
fig.show()
Show Tikz code
print(fig)% --------------------------------------------- %% Tikzfigure generated by tikzfigure v0.3.1 %% https://github.com/max-models/tikzfigure %% --------------------------------------------- %\begin{tikzpicture} \draw[color=teal!70, line width=8, line join=miter] (0, 0) to (1, 2) to (2, 0) to (3, 2); \node[draw=none, font=\small] (node0) at ({1.5}, {-0.6}) {\texttt{miter}}; \draw[color=teal!70, line width=8, line join=bevel] (4, 0) to (5, 2) to (6, 0) to (7, 2); \node[draw=none, font=\small] (node1) at ({5.5}, {-0.6}) {\texttt{bevel}}; \draw[color=teal!70, line width=8, line join=round] (8, 0) to (9, 2) to (10, 0) to (11, 2); \node[draw=none, font=\small] (node2) at ({9.5}, {-0.6}) {\texttt{round}};\end{tikzpicture}print(fig.generate_standalone())\documentclass[border=10pt]{standalone}\PassOptionsToPackage{dvipsnames,svgnames,x11names}{xcolor}\usepackage{tikz}\usepackage{pgfplots}\pgfplotsset{compat=newest}\usepgfplotslibrary{groupplots}\usetikzlibrary{arrows.meta}\begin{document}% --------------------------------------------- %% Tikzfigure generated by tikzfigure v0.3.1 %% https://github.com/max-models/tikzfigure %% --------------------------------------------- %\begin{tikzpicture} \draw[color=teal!70, line width=8, line join=miter] (0, 0) to (1, 2) to (2, 0) to (3, 2); \node[draw=none, font=\small] (node0) at ({1.5}, {-0.6}) {\texttt{miter}}; \draw[color=teal!70, line width=8, line join=bevel] (4, 0) to (5, 2) to (6, 0) to (7, 2); \node[draw=none, font=\small] (node1) at ({5.5}, {-0.6}) {\texttt{bevel}}; \draw[color=teal!70, line width=8, line join=round] (8, 0) to (9, 2) to (10, 0) to (11, 2); \node[draw=none, font=\small] (node2) at ({9.5}, {-0.6}) {\texttt{round}};\end{tikzpicture}
\end{document}Shadow effects
Section titled “Shadow effects”The shadows library adds drop shadows to nodes. Control the shadow
offset with shadow_xshift / shadow_yshift and the shadow color with
shadow_color.
fig = TikzFigure(    document_setup=r"\usetikzlibrary{shadows}",)
shadow_specs = [    ("gray!60", "3pt", "-3pt", "gray shadow"),    ("blue!40", "4pt", "-2pt", "blue shadow"),    ("red!50", "2pt", "-4pt", "red shadow"),    ("black!30", "5pt", "-5pt", "deep shadow"),]
for i, (sc, sx, sy, label) in enumerate(shadow_specs):    fig.node(        (i * 3, 0),        shape="rectangle",        fill="white",        draw="gray!70",        minimum_width="2cm",        minimum_height="1cm",        content=label,        options=["drop shadow"],  # activate the drop shadow style        shadow_xshift=sx,        shadow_yshift=sy,        shadow_color=sc,        font=r"\small",        rounded_corners="3pt",    )
fig.show()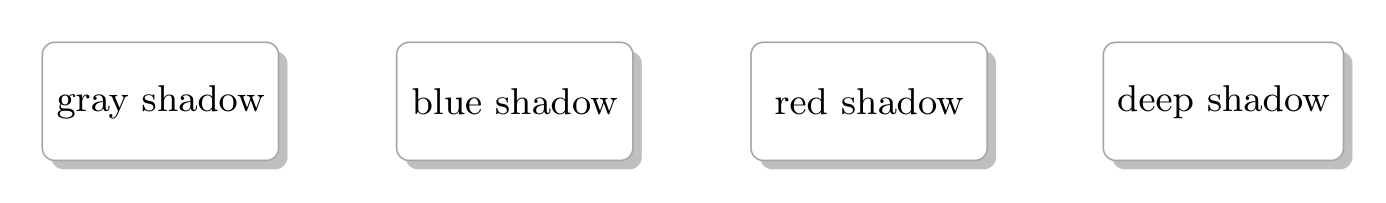
Show Tikz code
print(fig)% --------------------------------------------- %% Tikzfigure generated by tikzfigure v0.3.1 %% https://github.com/max-models/tikzfigure %% --------------------------------------------- %\begin{tikzpicture} \node[drop shadow, shape=rectangle, fill=white, draw=gray!70, minimum width=2cm, minimum height=1cm, font=\small, rounded corners=3pt, shadow xshift=3pt, shadow yshift=-3pt, shadow color=gray!60] (node0) at ({0}, {0}) {gray shadow}; \node[drop shadow, shape=rectangle, fill=white, draw=gray!70, minimum width=2cm, minimum height=1cm, font=\small, rounded corners=3pt, shadow xshift=4pt, shadow yshift=-2pt, shadow color=blue!40] (node1) at ({3}, {0}) {blue shadow}; \node[drop shadow, shape=rectangle, fill=white, draw=gray!70, minimum width=2cm, minimum height=1cm, font=\small, rounded corners=3pt, shadow xshift=2pt, shadow yshift=-4pt, shadow color=red!50] (node2) at ({6}, {0}) {red shadow}; \node[drop shadow, shape=rectangle, fill=white, draw=gray!70, minimum width=2cm, minimum height=1cm, font=\small, rounded corners=3pt, shadow xshift=5pt, shadow yshift=-5pt, shadow color=black!30] (node3) at ({9}, {0}) {deep shadow};\end{tikzpicture}print(fig.generate_standalone())\documentclass[border=10pt]{standalone}\PassOptionsToPackage{dvipsnames,svgnames,x11names}{xcolor}\usepackage{tikz}\usepackage{pgfplots}\pgfplotsset{compat=newest}\usepgfplotslibrary{groupplots}\usetikzlibrary{arrows.meta}% Custom document setup\usetikzlibrary{shadows}\begin{document}% --------------------------------------------- %% Tikzfigure generated by tikzfigure v0.3.1 %% https://github.com/max-models/tikzfigure %% --------------------------------------------- %\begin{tikzpicture} \node[drop shadow, shape=rectangle, fill=white, draw=gray!70, minimum width=2cm, minimum height=1cm, font=\small, rounded corners=3pt, shadow xshift=3pt, shadow yshift=-3pt, shadow color=gray!60] (node0) at ({0}, {0}) {gray shadow}; \node[drop shadow, shape=rectangle, fill=white, draw=gray!70, minimum width=2cm, minimum height=1cm, font=\small, rounded corners=3pt, shadow xshift=4pt, shadow yshift=-2pt, shadow color=blue!40] (node1) at ({3}, {0}) {blue shadow}; \node[drop shadow, shape=rectangle, fill=white, draw=gray!70, minimum width=2cm, minimum height=1cm, font=\small, rounded corners=3pt, shadow xshift=2pt, shadow yshift=-4pt, shadow color=red!50] (node2) at ({6}, {0}) {red shadow}; \node[drop shadow, shape=rectangle, fill=white, draw=gray!70, minimum width=2cm, minimum height=1cm, font=\small, rounded corners=3pt, shadow xshift=5pt, shadow yshift=-5pt, shadow color=black!30] (node3) at ({9}, {0}) {deep shadow};\end{tikzpicture}
\end{document}pin annotations
Section titled “pin annotations”The pin option attaches a small labeled pin to a node. The value is a
TikZ pin specification string: "above:text", "right:text",
"below left:text", etc.
fig = TikzFigure()
# Three nodes with pins in different directionsnA = fig.node(    (0, 0),    label="A",    shape="circle",    fill="orange!40",    minimum_size="1cm",    content="A",    pin="above:measured here",)
nB = fig.node(    (4, 0),    label="B",    shape="circle",    fill="teal!40",    minimum_size="1cm",    content="B",    pin="right:peak value",)
nC = fig.node(    (2, 3),    label="C",    shape="circle",    fill="purple!40",    minimum_size="1cm",    content="C",    pin="below left:origin",)
fig.draw([nA, nB], arrows=arrows.forward)fig.draw([nA, nC], arrows=arrows.forward)fig.draw([nB, nC], arrows=arrows.forward)
fig.show()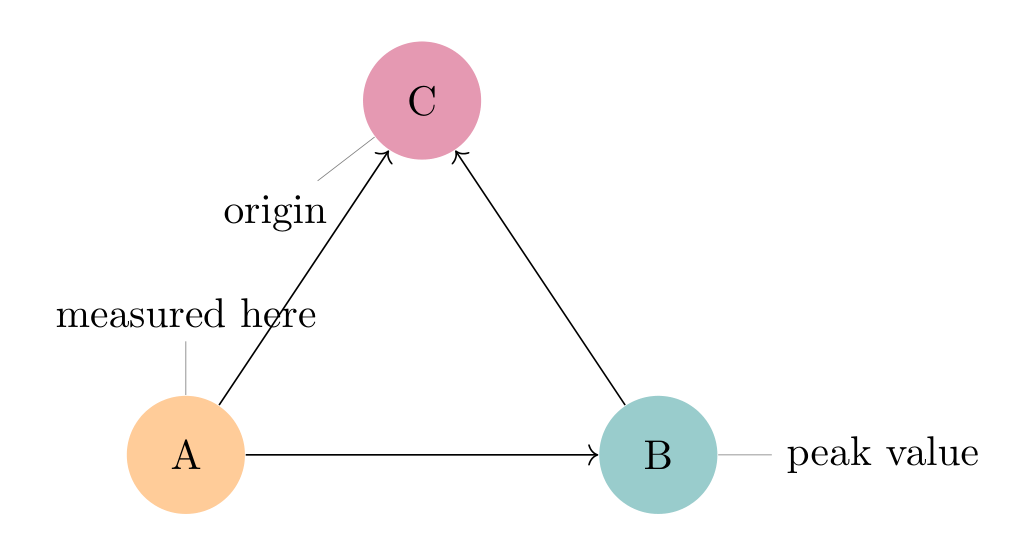
Show Tikz code
print(fig)% --------------------------------------------- %% Tikzfigure generated by tikzfigure v0.3.1 %% https://github.com/max-models/tikzfigure %% --------------------------------------------- %\begin{tikzpicture} \node[shape=circle, fill=orange!40, minimum size=1cm, pin=above:measured here] (A) at ({0}, {0}) {A}; \node[shape=circle, fill=teal!40, minimum size=1cm, pin=right:peak value] (B) at ({4}, {0}) {B}; \node[shape=circle, fill=purple!40, minimum size=1cm, pin=below left:origin] (C) at ({2}, {3}) {C}; \draw[->] (A) to (B); \draw[->] (A) to (C); \draw[->] (B) to (C);\end{tikzpicture}print(fig.generate_standalone())\documentclass[border=10pt]{standalone}\PassOptionsToPackage{dvipsnames,svgnames,x11names}{xcolor}\usepackage{tikz}\usepackage{pgfplots}\pgfplotsset{compat=newest}\usepgfplotslibrary{groupplots}\usetikzlibrary{arrows.meta}\begin{document}% --------------------------------------------- %% Tikzfigure generated by tikzfigure v0.3.1 %% https://github.com/max-models/tikzfigure %% --------------------------------------------- %\begin{tikzpicture} \node[shape=circle, fill=orange!40, minimum size=1cm, pin=above:measured here] (A) at ({0}, {0}) {A}; \node[shape=circle, fill=teal!40, minimum size=1cm, pin=right:peak value] (B) at ({4}, {0}) {B}; \node[shape=circle, fill=purple!40, minimum size=1cm, pin=below left:origin] (C) at ({2}, {3}) {C}; \draw[->] (A) to (B); \draw[->] (A) to (C); \draw[->] (B) to (C);\end{tikzpicture}
\end{document}Special shapes: star, regular polygon, cylinder
Section titled “Special shapes: star, regular polygon, cylinder”The shapes.geometric library provides additional node shapes beyond
the built-in circle, rectangle, and ellipse.
fig = TikzFigure(    document_setup=r"\usetikzlibrary{shapes.geometric}",)
# Five-pointed starfig.node(    (0, 0),    shape="star",    star_points=5,    star_point_ratio=0.45,    fill="yellow!70",    draw="orange",    minimum_size="2cm",    line_width=1.5,    content="star",    font=r"\small",)
# Six-pointed starfig.node(    (3, 0),    shape="star",    star_points=6,    star_point_ratio=0.5,    fill="cyan!50",    draw="teal",    minimum_size="2cm",    line_width=1.5,    content="6-pt",    font=r"\small",)
# Regular hexagonfig.node(    (6, 0),    shape="regular polygon",    regular_polygon_sides=6,    fill="green!40",    draw="green!70!black",    minimum_size="2cm",    line_width=1.5,    content="hex",    font=r"\small",)
# Regular triangle (3 sides)fig.node(    (9, 0),    shape="regular polygon",    regular_polygon_sides=3,    fill="red!30",    draw="red!70",    minimum_size="2cm",    line_width=1.5,    content="tri",    font=r"\small",)
# Cylinderfig.node(    (12, 0),    shape="cylinder",    fill="purple!30",    draw="purple!70",    minimum_width="1.4cm",    minimum_height="2cm",    line_width=1.5,    content="DB",    font=r"\small",)
fig.show()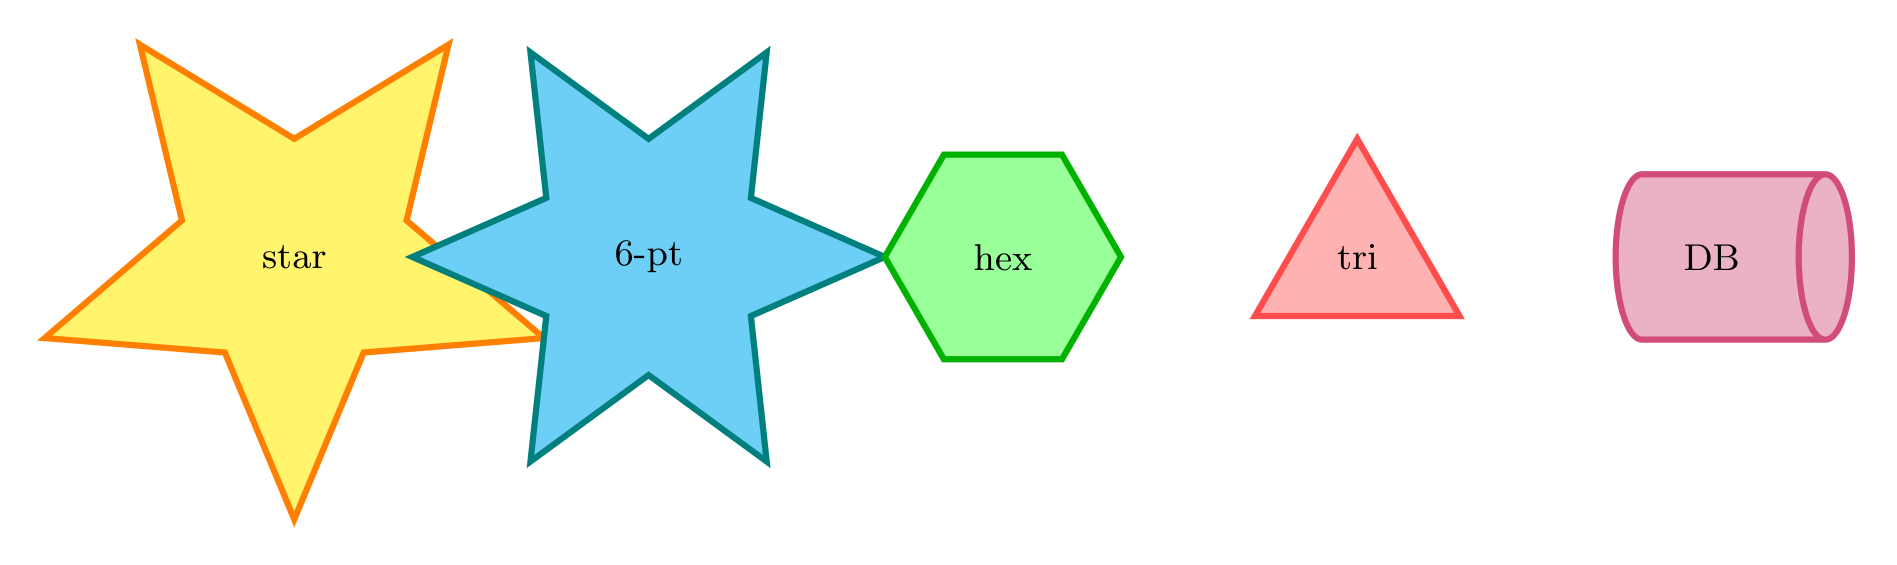
Show Tikz code
print(fig)% --------------------------------------------- %% Tikzfigure generated by tikzfigure v0.3.1 %% https://github.com/max-models/tikzfigure %% --------------------------------------------- %\begin{tikzpicture} \node[shape=star, fill=yellow!70, draw=orange, minimum size=2cm, line width=1.5, font=\small, star points=5, star point ratio=0.45] (node0) at ({0}, {0}) {star}; \node[shape=star, fill=cyan!50, draw=teal, minimum size=2cm, line width=1.5, font=\small, star points=6, star point ratio=0.5] (node1) at ({3}, {0}) {6-pt}; \node[shape=regular polygon, fill=green!40, draw=green!70!black, minimum size=2cm, line width=1.5, font=\small, regular polygon sides=6] (node2) at ({6}, {0}) {hex}; \node[shape=regular polygon, fill=red!30, draw=red!70, minimum size=2cm, line width=1.5, font=\small, regular polygon sides=3] (node3) at ({9}, {0}) {tri}; \node[shape=cylinder, fill=purple!30, draw=purple!70, minimum width=1.4cm, minimum height=2cm, line width=1.5, font=\small] (node4) at ({12}, {0}) {DB};\end{tikzpicture}print(fig.generate_standalone())\documentclass[border=10pt]{standalone}\PassOptionsToPackage{dvipsnames,svgnames,x11names}{xcolor}\usepackage{tikz}\usepackage{pgfplots}\pgfplotsset{compat=newest}\usepgfplotslibrary{groupplots}\usetikzlibrary{arrows.meta}% Custom document setup\usetikzlibrary{shapes.geometric}\begin{document}% --------------------------------------------- %% Tikzfigure generated by tikzfigure v0.3.1 %% https://github.com/max-models/tikzfigure %% --------------------------------------------- %\begin{tikzpicture} \node[shape=star, fill=yellow!70, draw=orange, minimum size=2cm, line width=1.5, font=\small, star points=5, star point ratio=0.45] (node0) at ({0}, {0}) {star}; \node[shape=star, fill=cyan!50, draw=teal, minimum size=2cm, line width=1.5, font=\small, star points=6, star point ratio=0.5] (node1) at ({3}, {0}) {6-pt}; \node[shape=regular polygon, fill=green!40, draw=green!70!black, minimum size=2cm, line width=1.5, font=\small, regular polygon sides=6] (node2) at ({6}, {0}) {hex}; \node[shape=regular polygon, fill=red!30, draw=red!70, minimum size=2cm, line width=1.5, font=\small, regular polygon sides=3] (node3) at ({9}, {0}) {tri}; \node[shape=cylinder, fill=purple!30, draw=purple!70, minimum width=1.4cm, minimum height=2cm, line width=1.5, font=\small] (node4) at ({12}, {0}) {DB};\end{tikzpicture}
\end{document}