Shading and Patterns
TikZ supports rich fill styles beyond solid colors: smooth color gradients (shadings) and repeating geometric fill patterns. This tutorial covers:
- axis shading on nodes: horizontal and vertical gradients
- radial shading: glowing circles
- ball shading: three-dimensional-looking spheres
- axis shading on closed paths
- fill patterns: hatching, dots, crosshatch, checkerboard
- combining shadings and patterns in one figure
All shading examples require \usetikzlibrary{shadings} and all pattern
examples require \usetikzlibrary{patterns}, both passed via
document_setup.
from tikzfigure import TikzFigure, patterns, shapesAxis shading: horizontal and vertical gradients
Section titled “Axis shading: horizontal and vertical gradients”shading="axis" produces a linear gradient. Use
left_color/right_color for a horizontal gradient, or
top_color/bottom_color for a vertical one.
fig = TikzFigure(    document_setup=r"\usetikzlibrary{shadings}",)
# Horizontal gradientspairs = [    ("red", "yellow"),    ("blue", "cyan"),    ("purple", "orange"),    ("green!60!black", "lime"),]
for i, (lc, rc) in enumerate(pairs):    fig.node(        (i * 3, 1.5),        shape=shapes.rectangle,        shading="axis",        left_color=lc,        right_color=rc,        minimum_width="2.2cm",        minimum_height="1.2cm",        draw="gray!50",    )    fig.node(        i * 3,        0.5,        content=f"{lc} → {rc}",        draw="none",        font=r"\tiny",        anchor="center",    )
# Vertical gradientsvert_pairs = [    ("blue!80", "white"),    ("orange", "yellow!50"),    ("teal", "green!30"),]
for i, (tc, bc) in enumerate(vert_pairs):    fig.node(        (i * 3, -1),        shape=shapes.rectangle,        shading="axis",        top_color=tc,        bottom_color=bc,        minimum_width="2.2cm",        minimum_height="1.2cm",        draw="gray!50",    )    fig.node(        i * 3,        -2,        content=f"{tc} ↕ {bc}",        draw="none",        font=r"\tiny",        anchor="center",    )
fig.show()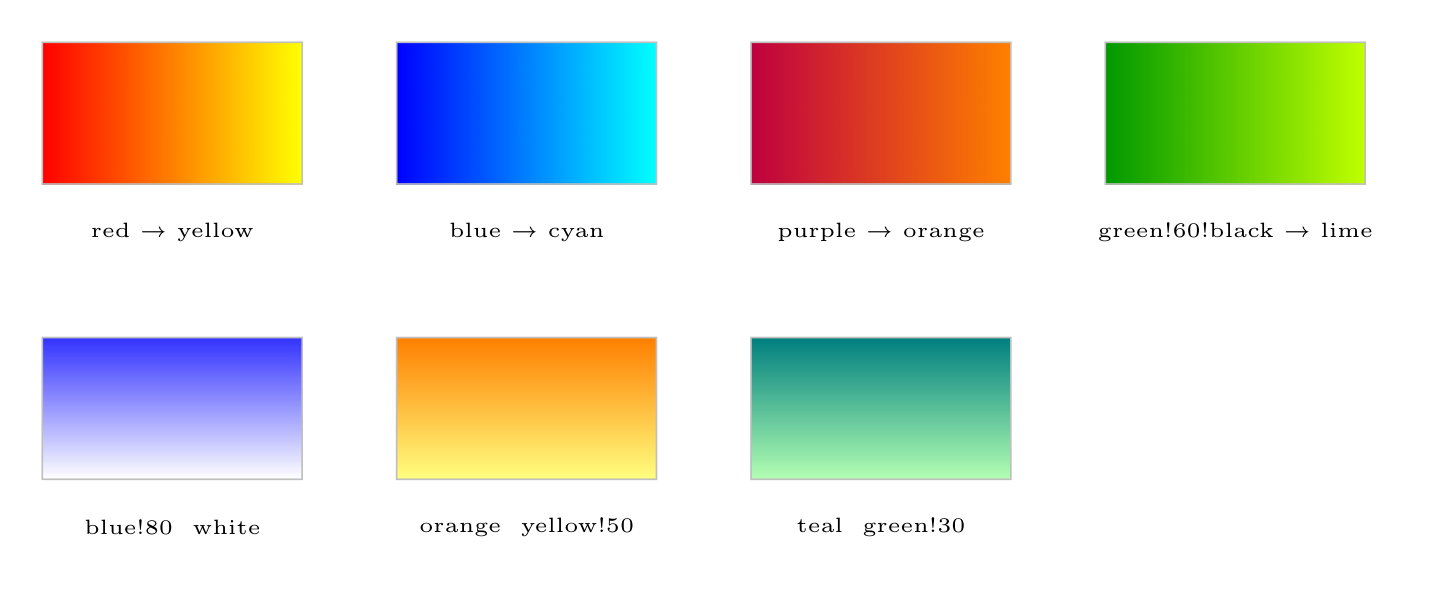
Show Tikz code
print(fig)% --------------------------------------------- %% Tikzfigure generated by tikzfigure v0.3.1 %% https://github.com/max-models/tikzfigure %% --------------------------------------------- %\begin{tikzpicture} \node[shape=rectangle, draw=gray!50, minimum width=2.2cm, minimum height=1.2cm, shading=axis, left color=red, right color=yellow] (node0) at ({0}, {1.5}) {}; \node[draw=none, font=\tiny, anchor=center] (node1) at ({0}, {0.5}) {red → yellow}; \node[shape=rectangle, draw=gray!50, minimum width=2.2cm, minimum height=1.2cm, shading=axis, left color=blue, right color=cyan] (node2) at ({3}, {1.5}) {}; \node[draw=none, font=\tiny, anchor=center] (node3) at ({3}, {0.5}) {blue → cyan}; \node[shape=rectangle, draw=gray!50, minimum width=2.2cm, minimum height=1.2cm, shading=axis, left color=purple, right color=orange] (node4) at ({6}, {1.5}) {}; \node[draw=none, font=\tiny, anchor=center] (node5) at ({6}, {0.5}) {purple → orange}; \node[shape=rectangle, draw=gray!50, minimum width=2.2cm, minimum height=1.2cm, shading=axis, left color=green!60!black, right color=lime] (node6) at ({9}, {1.5}) {}; \node[draw=none, font=\tiny, anchor=center] (node7) at ({9}, {0.5}) {green!60!black → lime}; \node[shape=rectangle, draw=gray!50, minimum width=2.2cm, minimum height=1.2cm, shading=axis, top color=blue!80, bottom color=white] (node8) at ({0}, {-1}) {}; \node[draw=none, font=\tiny, anchor=center] (node9) at ({0}, {-2}) {blue!80 ↕ white}; \node[shape=rectangle, draw=gray!50, minimum width=2.2cm, minimum height=1.2cm, shading=axis, top color=orange, bottom color=yellow!50] (node10) at ({3}, {-1}) {}; \node[draw=none, font=\tiny, anchor=center] (node11) at ({3}, {-2}) {orange ↕ yellow!50}; \node[shape=rectangle, draw=gray!50, minimum width=2.2cm, minimum height=1.2cm, shading=axis, top color=teal, bottom color=green!30] (node12) at ({6}, {-1}) {}; \node[draw=none, font=\tiny, anchor=center] (node13) at ({6}, {-2}) {teal ↕ green!30};\end{tikzpicture}print(fig.generate_standalone())\documentclass[border=10pt]{standalone}\PassOptionsToPackage{dvipsnames,svgnames,x11names}{xcolor}\usepackage{tikz}\usepackage{pgfplots}\pgfplotsset{compat=newest}\usepgfplotslibrary{groupplots}\usetikzlibrary{arrows.meta}% Custom document setup\usetikzlibrary{shadings}\begin{document}% --------------------------------------------- %% Tikzfigure generated by tikzfigure v0.3.1 %% https://github.com/max-models/tikzfigure %% --------------------------------------------- %\begin{tikzpicture} \node[shape=rectangle, draw=gray!50, minimum width=2.2cm, minimum height=1.2cm, shading=axis, left color=red, right color=yellow] (node0) at ({0}, {1.5}) {}; \node[draw=none, font=\tiny, anchor=center] (node1) at ({0}, {0.5}) {red → yellow}; \node[shape=rectangle, draw=gray!50, minimum width=2.2cm, minimum height=1.2cm, shading=axis, left color=blue, right color=cyan] (node2) at ({3}, {1.5}) {}; \node[draw=none, font=\tiny, anchor=center] (node3) at ({3}, {0.5}) {blue → cyan}; \node[shape=rectangle, draw=gray!50, minimum width=2.2cm, minimum height=1.2cm, shading=axis, left color=purple, right color=orange] (node4) at ({6}, {1.5}) {}; \node[draw=none, font=\tiny, anchor=center] (node5) at ({6}, {0.5}) {purple → orange}; \node[shape=rectangle, draw=gray!50, minimum width=2.2cm, minimum height=1.2cm, shading=axis, left color=green!60!black, right color=lime] (node6) at ({9}, {1.5}) {}; \node[draw=none, font=\tiny, anchor=center] (node7) at ({9}, {0.5}) {green!60!black → lime}; \node[shape=rectangle, draw=gray!50, minimum width=2.2cm, minimum height=1.2cm, shading=axis, top color=blue!80, bottom color=white] (node8) at ({0}, {-1}) {}; \node[draw=none, font=\tiny, anchor=center] (node9) at ({0}, {-2}) {blue!80 ↕ white}; \node[shape=rectangle, draw=gray!50, minimum width=2.2cm, minimum height=1.2cm, shading=axis, top color=orange, bottom color=yellow!50] (node10) at ({3}, {-1}) {}; \node[draw=none, font=\tiny, anchor=center] (node11) at ({3}, {-2}) {orange ↕ yellow!50}; \node[shape=rectangle, draw=gray!50, minimum width=2.2cm, minimum height=1.2cm, shading=axis, top color=teal, bottom color=green!30] (node12) at ({6}, {-1}) {}; \node[draw=none, font=\tiny, anchor=center] (node13) at ({6}, {-2}) {teal ↕ green!30};\end{tikzpicture}
\end{document}Radial shading: glowing circles
Section titled “Radial shading: glowing circles”shading="radial" paints from inner_color at the center outward to
outer_color. This gives a convincing glow effect.
fig = TikzFigure(    document_setup=r"\usetikzlibrary{shadings}",)
glows = [    ("white", "red"),    ("white", "blue"),    ("yellow", "orange"),    ("cyan!20", "teal"),    ("white", "purple"),]
for i, (ic, oc) in enumerate(glows):    fig.node(        (i * 2.5, 0),        shape=shapes.circle,        shading="radial",        inner_color=ic,        outer_color=oc,        minimum_size="1.8cm",        draw="none",    )
fig.show()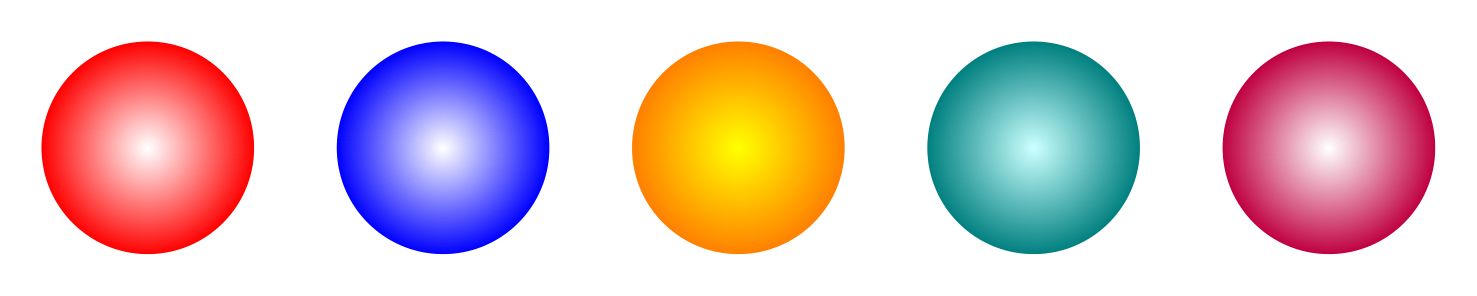
Show Tikz code
print(fig)% --------------------------------------------- %% Tikzfigure generated by tikzfigure v0.3.1 %% https://github.com/max-models/tikzfigure %% --------------------------------------------- %\begin{tikzpicture} \node[shape=circle, draw=none, minimum size=1.8cm, shading=radial, inner color=white, outer color=red] (node0) at ({0.0}, {0}) {}; \node[shape=circle, draw=none, minimum size=1.8cm, shading=radial, inner color=white, outer color=blue] (node1) at ({2.5}, {0}) {}; \node[shape=circle, draw=none, minimum size=1.8cm, shading=radial, inner color=yellow, outer color=orange] (node2) at ({5.0}, {0}) {}; \node[shape=circle, draw=none, minimum size=1.8cm, shading=radial, inner color=cyan!20, outer color=teal] (node3) at ({7.5}, {0}) {}; \node[shape=circle, draw=none, minimum size=1.8cm, shading=radial, inner color=white, outer color=purple] (node4) at ({10.0}, {0}) {};\end{tikzpicture}print(fig.generate_standalone())\documentclass[border=10pt]{standalone}\PassOptionsToPackage{dvipsnames,svgnames,x11names}{xcolor}\usepackage{tikz}\usepackage{pgfplots}\pgfplotsset{compat=newest}\usepgfplotslibrary{groupplots}\usetikzlibrary{arrows.meta}% Custom document setup\usetikzlibrary{shadings}\begin{document}% --------------------------------------------- %% Tikzfigure generated by tikzfigure v0.3.1 %% https://github.com/max-models/tikzfigure %% --------------------------------------------- %\begin{tikzpicture} \node[shape=circle, draw=none, minimum size=1.8cm, shading=radial, inner color=white, outer color=red] (node0) at ({0.0}, {0}) {}; \node[shape=circle, draw=none, minimum size=1.8cm, shading=radial, inner color=white, outer color=blue] (node1) at ({2.5}, {0}) {}; \node[shape=circle, draw=none, minimum size=1.8cm, shading=radial, inner color=yellow, outer color=orange] (node2) at ({5.0}, {0}) {}; \node[shape=circle, draw=none, minimum size=1.8cm, shading=radial, inner color=cyan!20, outer color=teal] (node3) at ({7.5}, {0}) {}; \node[shape=circle, draw=none, minimum size=1.8cm, shading=radial, inner color=white, outer color=purple] (node4) at ({10.0}, {0}) {};\end{tikzpicture}
\end{document}Ball shading: three-dimensional spheres
Section titled “Ball shading: three-dimensional spheres”shading="ball" with ball_color produces a highlight-shaded sphere
that looks three-dimensional.
fig = TikzFigure(    document_setup=r"\usetikzlibrary{shadings}",)
colors = ["red", "blue", "green!60!black", "orange", "purple", "teal"]
for i, color in enumerate(colors):    fig.node(        (i * 2.2, 0),        shape="circle",        shading="ball",        ball_color=color,        minimum_size="1.6cm",        draw="none",    )
fig.show()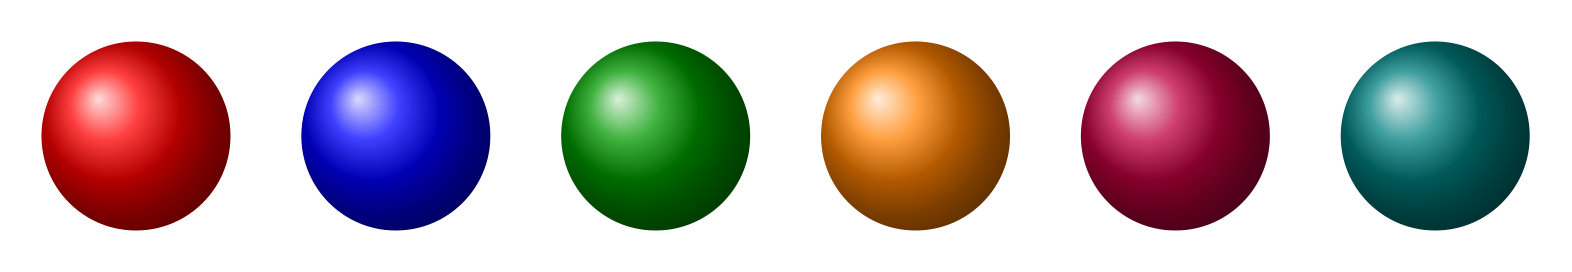
Show Tikz code
print(fig)% --------------------------------------------- %% Tikzfigure generated by tikzfigure v0.3.1 %% https://github.com/max-models/tikzfigure %% --------------------------------------------- %\begin{tikzpicture} \node[shape=circle, draw=none, minimum size=1.6cm, shading=ball, ball color=red] (node0) at ({0.0}, {0}) {}; \node[shape=circle, draw=none, minimum size=1.6cm, shading=ball, ball color=blue] (node1) at ({2.2}, {0}) {}; \node[shape=circle, draw=none, minimum size=1.6cm, shading=ball, ball color=green!60!black] (node2) at ({4.4}, {0}) {}; \node[shape=circle, draw=none, minimum size=1.6cm, shading=ball, ball color=orange] (node3) at ({6.6000000000000005}, {0}) {}; \node[shape=circle, draw=none, minimum size=1.6cm, shading=ball, ball color=purple] (node4) at ({8.8}, {0}) {}; \node[shape=circle, draw=none, minimum size=1.6cm, shading=ball, ball color=teal] (node5) at ({11.0}, {0}) {};\end{tikzpicture}print(fig.generate_standalone())\documentclass[border=10pt]{standalone}\PassOptionsToPackage{dvipsnames,svgnames,x11names}{xcolor}\usepackage{tikz}\usepackage{pgfplots}\pgfplotsset{compat=newest}\usepgfplotslibrary{groupplots}\usetikzlibrary{arrows.meta}% Custom document setup\usetikzlibrary{shadings}\begin{document}% --------------------------------------------- %% Tikzfigure generated by tikzfigure v0.3.1 %% https://github.com/max-models/tikzfigure %% --------------------------------------------- %\begin{tikzpicture} \node[shape=circle, draw=none, minimum size=1.6cm, shading=ball, ball color=red] (node0) at ({0.0}, {0}) {}; \node[shape=circle, draw=none, minimum size=1.6cm, shading=ball, ball color=blue] (node1) at ({2.2}, {0}) {}; \node[shape=circle, draw=none, minimum size=1.6cm, shading=ball, ball color=green!60!black] (node2) at ({4.4}, {0}) {}; \node[shape=circle, draw=none, minimum size=1.6cm, shading=ball, ball color=orange] (node3) at ({6.6000000000000005}, {0}) {}; \node[shape=circle, draw=none, minimum size=1.6cm, shading=ball, ball color=purple] (node4) at ({8.8}, {0}) {}; \node[shape=circle, draw=none, minimum size=1.6cm, shading=ball, ball color=teal] (node5) at ({11.0}, {0}) {};\end{tikzpicture}
\end{document}Axis shading on a closed path
Section titled “Axis shading on a closed path”Shading is not limited to nodes — you can apply it to any filled closed
path using fig.draw(pts, cycle=True, shading="axis", ...).
import math
fig = TikzFigure(    document_setup=r"\usetikzlibrary{shadings}",)
# A gradient-filled pentagonN = 5angles = [math.pi / 2 + 2 * math.pi * k / N for k in range(N)]pentagon = [(2 * math.cos(a), 2 * math.sin(a)) for a in angles]
fig.draw(    pentagon,    cycle=True,    shading="axis",    left_color="blue!60",    right_color="cyan!30",    draw="blue!80",    line_width=1.5,)
# A gradient-filled star (six-point crossing)star = [(0, 0), (1, 2.5), (2, 0), (-0.5, 1.5), (2.5, 1.5), (0, 0)]shifted = [(x + 5, y - 1) for x, y in star]fig.draw(    shifted,    cycle=True,    shading="axis",    left_color="orange",    right_color="yellow!60",    draw="orange!80",    line_width=1.5,)
fig.show()
Show Tikz code
print(fig)% --------------------------------------------- %% Tikzfigure generated by tikzfigure v0.3.1 %% https://github.com/max-models/tikzfigure %% --------------------------------------------- %\begin{tikzpicture} \draw[draw=blue!80, line width=1.5, shading=axis, left color=blue!60, right color=cyan!30] (1.2246467991473532e-16, 2.0) to (-1.902113032590307, 0.618033988749895) to (-1.1755705045849465, -1.6180339887498947) to (1.1755705045849458, -1.6180339887498951) to (1.9021130325903073, 0.6180339887498943) -- cycle; \draw[draw=orange!80, line width=1.5, shading=axis, left color=orange, right color=yellow!60] (5, -1) to (6, 1.5) to (7, -1) to (4.5, 0.5) to (7.5, 0.5) to (5, -1) -- cycle;\end{tikzpicture}print(fig.generate_standalone())\documentclass[border=10pt]{standalone}\PassOptionsToPackage{dvipsnames,svgnames,x11names}{xcolor}\usepackage{tikz}\usepackage{pgfplots}\pgfplotsset{compat=newest}\usepgfplotslibrary{groupplots}\usetikzlibrary{arrows.meta}% Custom document setup\usetikzlibrary{shadings}\begin{document}% --------------------------------------------- %% Tikzfigure generated by tikzfigure v0.3.1 %% https://github.com/max-models/tikzfigure %% --------------------------------------------- %\begin{tikzpicture} \draw[draw=blue!80, line width=1.5, shading=axis, left color=blue!60, right color=cyan!30] (1.2246467991473532e-16, 2.0) to (-1.902113032590307, 0.618033988749895) to (-1.1755705045849465, -1.6180339887498947) to (1.1755705045849458, -1.6180339887498951) to (1.9021130325903073, 0.6180339887498943) -- cycle; \draw[draw=orange!80, line width=1.5, shading=axis, left color=orange, right color=yellow!60] (5, -1) to (6, 1.5) to (7, -1) to (4.5, 0.5) to (7.5, 0.5) to (5, -1) -- cycle;\end{tikzpicture}
\end{document}Fill patterns on nodes
Section titled “Fill patterns on nodes”Patterns are repeating geometric fills. Common patterns include
"north east lines", "dots", "crosshatch", "grid", and
"checkerboard". Use pattern_color to set the pattern ink color.
fig = TikzFigure(    document_setup=r"\usetikzlibrary{patterns}",)
patterns_used = [    (patterns.north_east_lines, "blue!60"),    (patterns.north_west_lines, "red!60"),    (patterns.dots, "black"),    (patterns.crosshatch, "teal"),    (patterns.grid, "orange!80"),    (patterns.checkerboard, "purple!60"),]
for i, (pat, pc) in enumerate(patterns_used):    col = i % 3    row = i // 3    fig.node(        (col * 3.5, row * (-2.5)),        shape=shapes.rectangle,        pattern=pat,        pattern_color=pc,        minimum_width="2.5cm",        minimum_height="1.8cm",        draw="gray!70",        fill="white",    )    fig.node(        col * 3.5,        row * (-2.5) - 1.2,        content=f"\\texttt{{{pat}}}",        draw="none",        font=r"\tiny",    )
fig.show()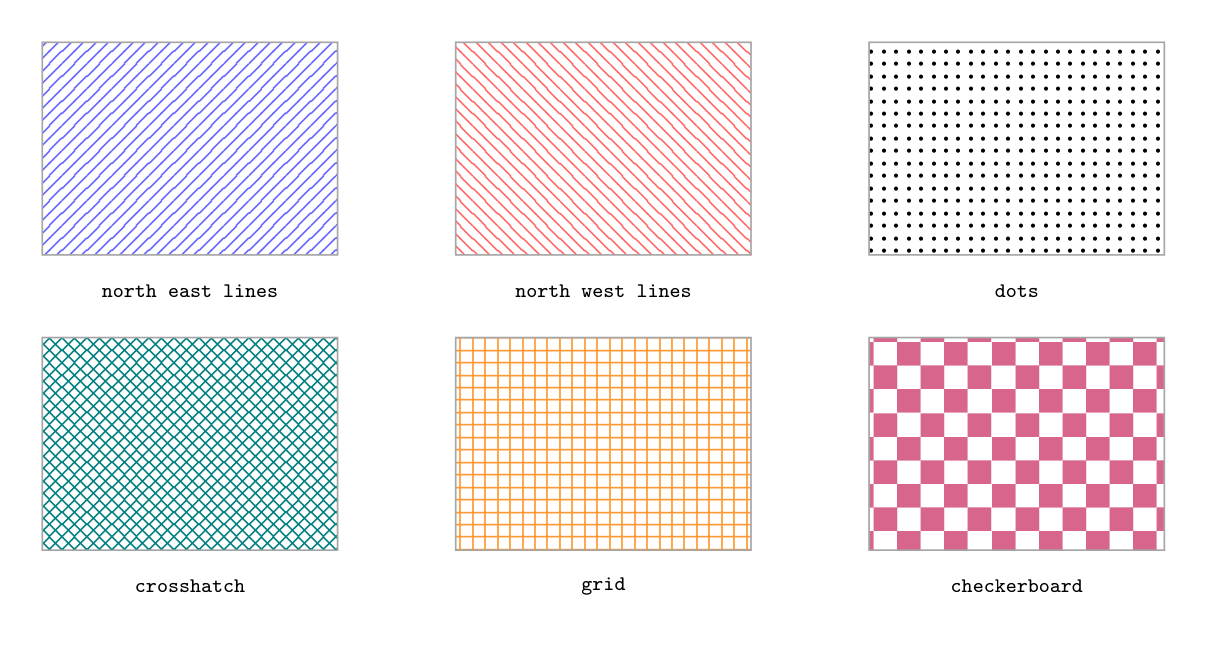
Show Tikz code
print(fig)% --------------------------------------------- %% Tikzfigure generated by tikzfigure v0.3.1 %% https://github.com/max-models/tikzfigure %% --------------------------------------------- %\begin{tikzpicture} \node[shape=rectangle, fill=white, draw=gray!70, minimum width=2.5cm, minimum height=1.8cm, pattern=north east lines, pattern color=blue!60] (node0) at ({0.0}, {-0.0}) {}; \node[draw=none, font=\tiny] (node1) at ({0.0}, {-1.2}) {\texttt{north east lines}}; \node[shape=rectangle, fill=white, draw=gray!70, minimum width=2.5cm, minimum height=1.8cm, pattern=north west lines, pattern color=red!60] (node2) at ({3.5}, {-0.0}) {}; \node[draw=none, font=\tiny] (node3) at ({3.5}, {-1.2}) {\texttt{north west lines}}; \node[shape=rectangle, fill=white, draw=gray!70, minimum width=2.5cm, minimum height=1.8cm, pattern=dots, pattern color=black] (node4) at ({7.0}, {-0.0}) {}; \node[draw=none, font=\tiny] (node5) at ({7.0}, {-1.2}) {\texttt{dots}}; \node[shape=rectangle, fill=white, draw=gray!70, minimum width=2.5cm, minimum height=1.8cm, pattern=crosshatch, pattern color=teal] (node6) at ({0.0}, {-2.5}) {}; \node[draw=none, font=\tiny] (node7) at ({0.0}, {-3.7}) {\texttt{crosshatch}}; \node[shape=rectangle, fill=white, draw=gray!70, minimum width=2.5cm, minimum height=1.8cm, pattern=grid, pattern color=orange!80] (node8) at ({3.5}, {-2.5}) {}; \node[draw=none, font=\tiny] (node9) at ({3.5}, {-3.7}) {\texttt{grid}}; \node[shape=rectangle, fill=white, draw=gray!70, minimum width=2.5cm, minimum height=1.8cm, pattern=checkerboard, pattern color=purple!60] (node10) at ({7.0}, {-2.5}) {}; \node[draw=none, font=\tiny] (node11) at ({7.0}, {-3.7}) {\texttt{checkerboard}};\end{tikzpicture}print(fig.generate_standalone())\documentclass[border=10pt]{standalone}\PassOptionsToPackage{dvipsnames,svgnames,x11names}{xcolor}\usepackage{tikz}\usepackage{pgfplots}\pgfplotsset{compat=newest}\usepgfplotslibrary{groupplots}\usetikzlibrary{arrows.meta}% Custom document setup\usetikzlibrary{patterns}\begin{document}% --------------------------------------------- %% Tikzfigure generated by tikzfigure v0.3.1 %% https://github.com/max-models/tikzfigure %% --------------------------------------------- %\begin{tikzpicture} \node[shape=rectangle, fill=white, draw=gray!70, minimum width=2.5cm, minimum height=1.8cm, pattern=north east lines, pattern color=blue!60] (node0) at ({0.0}, {-0.0}) {}; \node[draw=none, font=\tiny] (node1) at ({0.0}, {-1.2}) {\texttt{north east lines}}; \node[shape=rectangle, fill=white, draw=gray!70, minimum width=2.5cm, minimum height=1.8cm, pattern=north west lines, pattern color=red!60] (node2) at ({3.5}, {-0.0}) {}; \node[draw=none, font=\tiny] (node3) at ({3.5}, {-1.2}) {\texttt{north west lines}}; \node[shape=rectangle, fill=white, draw=gray!70, minimum width=2.5cm, minimum height=1.8cm, pattern=dots, pattern color=black] (node4) at ({7.0}, {-0.0}) {}; \node[draw=none, font=\tiny] (node5) at ({7.0}, {-1.2}) {\texttt{dots}}; \node[shape=rectangle, fill=white, draw=gray!70, minimum width=2.5cm, minimum height=1.8cm, pattern=crosshatch, pattern color=teal] (node6) at ({0.0}, {-2.5}) {}; \node[draw=none, font=\tiny] (node7) at ({0.0}, {-3.7}) {\texttt{crosshatch}}; \node[shape=rectangle, fill=white, draw=gray!70, minimum width=2.5cm, minimum height=1.8cm, pattern=grid, pattern color=orange!80] (node8) at ({3.5}, {-2.5}) {}; \node[draw=none, font=\tiny] (node9) at ({3.5}, {-3.7}) {\texttt{grid}}; \node[shape=rectangle, fill=white, draw=gray!70, minimum width=2.5cm, minimum height=1.8cm, pattern=checkerboard, pattern color=purple!60] (node10) at ({7.0}, {-2.5}) {}; \node[draw=none, font=\tiny] (node11) at ({7.0}, {-3.7}) {\texttt{checkerboard}};\end{tikzpicture}
\end{document}Combining shadings and patterns in one figure
Section titled “Combining shadings and patterns in one figure”Here a shaded background rectangle sits on a lower layer, while patterned nodes sit on top, demonstrating how shadings and patterns can coexist in one figure.
fig = TikzFigure(    document_setup=(        r"\usetikzlibrary{shadings}"        "\n"        r"\usetikzlibrary{patterns}"    ),)
# Shaded background panelfig.node(    (3, 1),    shape=shapes.rectangle,    shading="axis",    top_color="blue!20",    bottom_color="white",    minimum_width="8cm",    minimum_height="4cm",    draw="blue!30",)
# Ball-shaded decorative spherefig.node(    (0.5, 2),    shape=shapes.circle,    shading="ball",    ball_color="cyan",    minimum_size="1.2cm",    draw="none",)
# Patterned foreground nodesfor i, (pat, fc) in enumerate(    [        (patterns.north_east_lines, "red!40"),        (patterns.dots, "green!40"),        (patterns.crosshatch, "orange!40"),    ],):    fig.node(        (2 + i * 2, 1),        shape=shapes.rectangle,        pattern=pat,        pattern_color=fc,        fill="white",        draw="gray!60",        minimum_width="1.4cm",        minimum_height="1.4cm",    )
fig.show()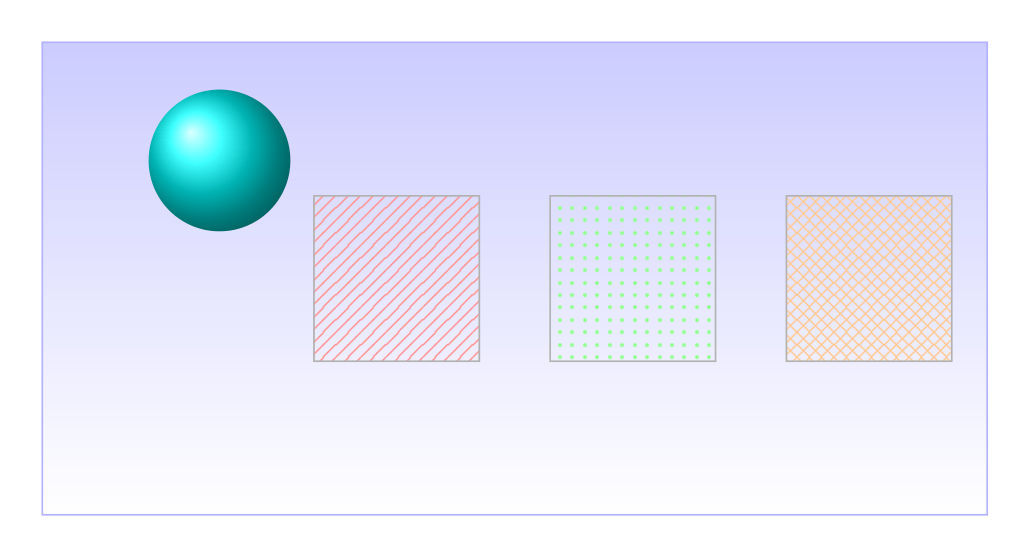
Show Tikz code
print(fig)% --------------------------------------------- %% Tikzfigure generated by tikzfigure v0.3.1 %% https://github.com/max-models/tikzfigure %% --------------------------------------------- %\begin{tikzpicture} \node[shape=rectangle, draw=blue!30, minimum width=8cm, minimum height=4cm, shading=axis, top color=blue!20, bottom color=white] (node0) at ({3}, {1}) {}; \node[shape=circle, draw=none, minimum size=1.2cm, shading=ball, ball color=cyan] (node1) at ({0.5}, {2}) {}; \node[shape=rectangle, fill=white, draw=gray!60, minimum width=1.4cm, minimum height=1.4cm, pattern=north east lines, pattern color=red!40] (node2) at ({2}, {1}) {}; \node[shape=rectangle, fill=white, draw=gray!60, minimum width=1.4cm, minimum height=1.4cm, pattern=dots, pattern color=green!40] (node3) at ({4}, {1}) {}; \node[shape=rectangle, fill=white, draw=gray!60, minimum width=1.4cm, minimum height=1.4cm, pattern=crosshatch, pattern color=orange!40] (node4) at ({6}, {1}) {};\end{tikzpicture}print(fig.generate_standalone())\documentclass[border=10pt]{standalone}\PassOptionsToPackage{dvipsnames,svgnames,x11names}{xcolor}\usepackage{tikz}\usepackage{pgfplots}\pgfplotsset{compat=newest}\usepgfplotslibrary{groupplots}\usetikzlibrary{arrows.meta}% Custom document setup\usetikzlibrary{shadings}\usetikzlibrary{patterns}\begin{document}% --------------------------------------------- %% Tikzfigure generated by tikzfigure v0.3.1 %% https://github.com/max-models/tikzfigure %% --------------------------------------------- %\begin{tikzpicture} \node[shape=rectangle, draw=blue!30, minimum width=8cm, minimum height=4cm, shading=axis, top color=blue!20, bottom color=white] (node0) at ({3}, {1}) {}; \node[shape=circle, draw=none, minimum size=1.2cm, shading=ball, ball color=cyan] (node1) at ({0.5}, {2}) {}; \node[shape=rectangle, fill=white, draw=gray!60, minimum width=1.4cm, minimum height=1.4cm, pattern=north east lines, pattern color=red!40] (node2) at ({2}, {1}) {}; \node[shape=rectangle, fill=white, draw=gray!60, minimum width=1.4cm, minimum height=1.4cm, pattern=dots, pattern color=green!40] (node3) at ({4}, {1}) {}; \node[shape=rectangle, fill=white, draw=gray!60, minimum width=1.4cm, minimum height=1.4cm, pattern=crosshatch, pattern color=orange!40] (node4) at ({6}, {1}) {};\end{tikzpicture}
\end{document}