Pyplot-style API
For a quick sketch you can skip the TikzFigure object. The functions of the
tikzfigure module draw on an implicit current figure, created the first time
one is called, much like matplotlib.pyplot. Every method of TikzFigure has a
module-level function of the same name.
import numpy as np
import tikzfigure as tf
Drawing on the current figure
Section titled “Drawing on the current figure”tf.draw([(0, 0), (1, 1), (2, 0)], arrows="->")tf.circle((1, 1), radius=0.3, fill="cyan!40")apex = tf.add_node(1, 1.6, label="apex", content="apex")tf.show()/home/runner/work/tikzfigure/tikzfigure/.venv/lib/python3.12/site-packages/fitz/__init__.py:17: FutureWarning: The `fitz` API is deprecated and will be removed in future. Use `import pymupdf` instead. warnings.warn(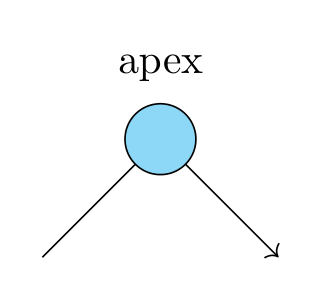
tf.gcf() returns the current figure, a normal TikzFigure, and the export
functions work on it too:
print(type(tf.gcf()).__name__)print(tf.generate_tikz())TikzFigure% --------------------------------------------- %% Tikzfigure generated by tikzfigure v0.5.0 %% https://github.com/max-models/tikzfigure %% --------------------------------------------- %\begin{tikzpicture} \draw[->] (0, 0) to (1, 1) to (2, 0); \draw[fill=cyan!40] ({1}, {1}) circle (0.3); \node (apex) at ({1}, {1.6}) {apex};\end{tikzpicture}Starting a new figure
Section titled “Starting a new figure”Unlike matplotlib.pyplot.show, tf.show() does not start a new figure: the next
drawing call adds to the same one. tf.figure() starts a new figure and makes it
current (with the arguments of TikzFigure), and tf.close() throws the current
one away.
tf.figure()tf.rectangle((0, 0), (2, 1), fill="orange!30")tf.square((3, 0.5), radius=0.5, fill="green!30")tf.show()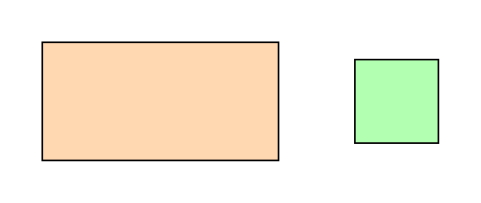
Several figures
Section titled “Several figures”Keep the figures tf.figure() returns, and tf.scf(fig) makes one current again:
first = tf.figure()tf.circle((0, 0), radius=1, draw="blue")second = tf.figure()tf.circle((0, 0), radius=1, draw="red")
tf.scf(first)tf.draw([(-1, 0), (1, 0)], color="blue")tf.show()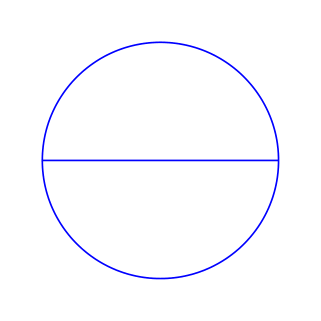
tf.scf(second)tf.show()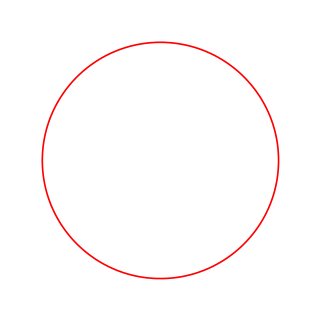
tf.axis2d(...) adds a pgfplots axis to the current figure; plot into the axis it
returns:
tf.figure()ax = tf.axis2d(xlabel="$x$", ylabel="$y$", xlim=(0, 2 * np.pi))x = np.linspace(0, 2 * np.pi, 40)ax.add_plot(x.tolist(), np.sin(x).tolist(), label="$\\sin x$", color="blue")tf.show()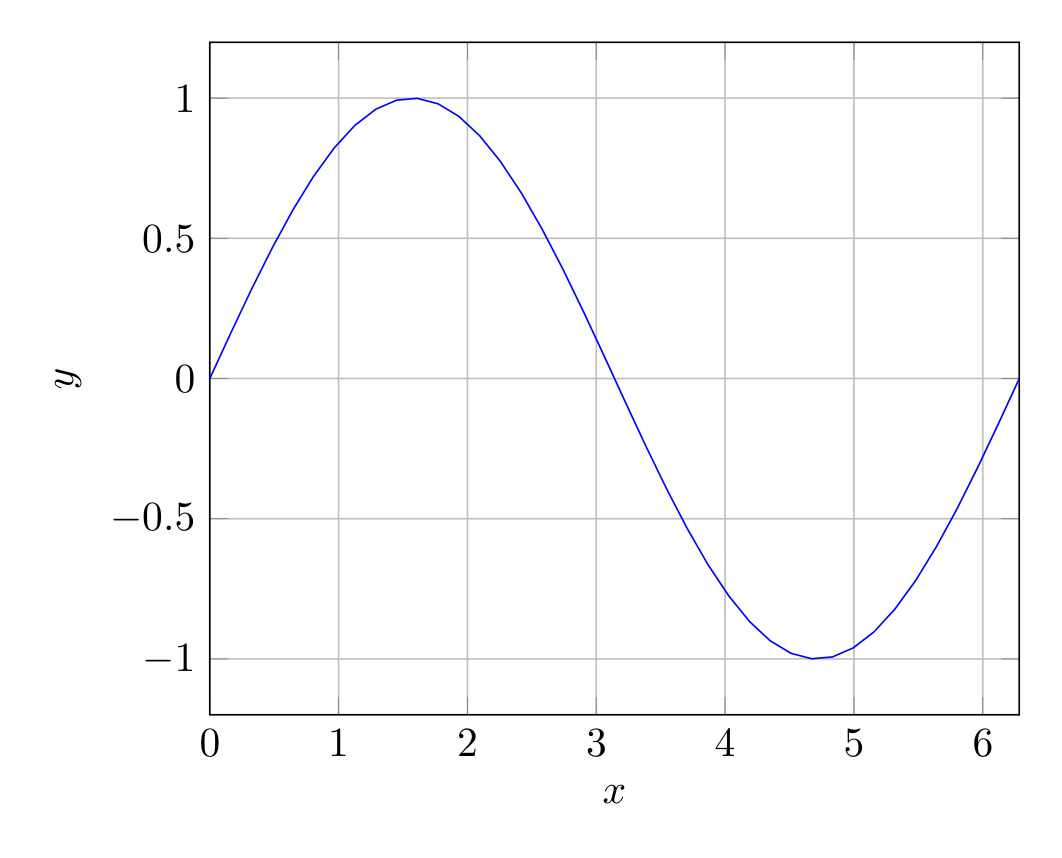
Saving
Section titled “Saving”tf.savefig(path) saves the current figure, like TikzFigure.savefig: .tikz
for the tikzpicture, .tex for a standalone document, .pdf or .png compiled
with pdflatex.
tf.savefig("sine.tikz")print(open("sine.tikz").read()[:300])% --------------------------------------------- %% Tikzfigure generated by tikzfigure v0.5.0 %% https://github.com/max-models/tikzfigure %% --------------------------------------------- %\begin{tikzpicture} \begin{axis}[xlabel=$x$, ylabel=$y$, xmin=0, xmax=6.283185307179586, grid=maThe explicit API stays the better choice for larger figures and libraries: it does not depend on which figure happens to be current.