Loops
Repetitive structures — grids, chains, matrices of nodes — can be created in two
ways: with Python loops that call node / draw many times, or with
native TikZ \foreach loops via fig.loop(), which embeds the loop
directly in the generated LaTeX instead of unrolling it in Python.
Benefits of TikZ \foreach loops: - the generated .tex file is much shorter
and more readable - loop variable values are available as TikZ expressions (e.g.
\i) at compile time - loops can be nested
This tutorial covers: - Python loop vs TikZ \foreach — side-by-side comparison
- basic
loopusage - loop variable in colour expressions - nested loops for a grid -variablefor reusable TikZ constants - a practical chain-of-boxes diagram
from tikzfigure import TikzFigure, arrowsPython loop vs TikZ \foreach — a side-by-side comparison
Section titled “Python loop vs TikZ \foreach — a side-by-side comparison”Both approaches produce the same visual output: a row of five circles. The key
difference is in the generated LaTeX. The Python loop unrolls every node into a
separate \node command, while loop emits a single compact \foreach block.
Python loop version:
fig = TikzFigure()
for i in range(5):    fig.node(        (i * 2, 0),        shape="circle",        fill="blue!40",        content=str(i),        minimum_size="0.8cm",    )
fig.show()
/home/runner/work/tikzfigure/tikzfigure/.venv/lib/python3.12/site-packages/fitz/__init__.py:17: FutureWarning: The `fitz` API is deprecated and will be removed in future. Use `import pymupdf` instead. warnings.warn(
Show the TikZ code
% --------------------------------------------- %% Tikzfigure generated by tikzfigure v0.5.0 %% https://github.com/max-models/tikzfigure %% --------------------------------------------- %\begin{tikzpicture} \node[shape=circle, fill=blue!40, minimum size=0.8cm] (node0) at ({0}, {0}) {0}; \node[shape=circle, fill=blue!40, minimum size=0.8cm] (node1) at ({2}, {0}) {1}; \node[shape=circle, fill=blue!40, minimum size=0.8cm] (node2) at ({4}, {0}) {2}; \node[shape=circle, fill=blue!40, minimum size=0.8cm] (node3) at ({6}, {0}) {3}; \node[shape=circle, fill=blue!40, minimum size=0.8cm] (node4) at ({8}, {0}) {4};\end{tikzpicture}Show the standalone LaTeX document
\documentclass[border=10pt]{standalone}\PassOptionsToPackage{dvipsnames,svgnames,x11names}{xcolor}\usepackage{tikz}\usepackage{pgfplots}\pgfplotsset{compat=newest}\usepgfplotslibrary{groupplots}\usetikzlibrary{arrows.meta}\begin{document}% --------------------------------------------- %% Tikzfigure generated by tikzfigure v0.5.0     %% https://github.com/max-models/tikzfigure      %% --------------------------------------------- %\begin{tikzpicture}    \node[shape=circle, fill=blue!40, minimum size=0.8cm] (node0) at ({0}, {0}) {0};    \node[shape=circle, fill=blue!40, minimum size=0.8cm] (node1) at ({2}, {0}) {1};    \node[shape=circle, fill=blue!40, minimum size=0.8cm] (node2) at ({4}, {0}) {2};    \node[shape=circle, fill=blue!40, minimum size=0.8cm] (node3) at ({6}, {0}) {3};    \node[shape=circle, fill=blue!40, minimum size=0.8cm] (node4) at ({8}, {0}) {4};\end{tikzpicture}
\end{document}
TikZ \foreach version — same output, much shorter LaTeX:
fig = TikzFigure()
with fig.loop(    "i",    range(5),    comment="Row of circles",) as loop:    loop.node(        (r"2*\i", 0),        shape="circle",        fill="blue!40",        content=r"\i",        minimum_size="0.8cm",    )
fig.show()
Show the TikZ code
% --------------------------------------------- %% Tikzfigure generated by tikzfigure v0.5.0 %% https://github.com/max-models/tikzfigure %% --------------------------------------------- %\begin{tikzpicture} % Row of circles \foreach \i in {0,1,...,4}{ \node[shape=circle, fill=blue!40, minimum size=0.8cm] () at ({2*\i}, {0}) {\i}; }\end{tikzpicture}Show the standalone LaTeX document
\documentclass[border=10pt]{standalone}\PassOptionsToPackage{dvipsnames,svgnames,x11names}{xcolor}\usepackage{tikz}\usepackage{pgfplots}\pgfplotsset{compat=newest}\usepgfplotslibrary{groupplots}\usetikzlibrary{arrows.meta}\begin{document}% --------------------------------------------- %% Tikzfigure generated by tikzfigure v0.5.0     %% https://github.com/max-models/tikzfigure      %% --------------------------------------------- %\begin{tikzpicture}    % Row of circles    \foreach \i in {0,1,...,4}{        \node[shape=circle, fill=blue!40, minimum size=0.8cm] () at ({2*\i}, {0}) {\i};    }\end{tikzpicture}
\end{document}
Notice how \foreach \i in {0,1,2,3,4} replaces five separate \node commands.
Basic loop: a row of circles
Section titled “Basic loop: a row of circles”fig.loop(var, iterable) returns a context manager. Inside the with block,
the bound name behaves like the loop variable itself, while ordinary
fig.node(), fig.draw(), and fig.plot() calls automatically attach to the
active loop.
fig = TikzFigure()
with fig.loop(    "i",    range(6),    comment="Row of circles",) as i:    fig.node(        (2 * i, 0),        shape="circle",        fill="blue!40",        content=i,        minimum_size="0.8cm",    )
fig.show()
Show the TikZ code
% --------------------------------------------- %% Tikzfigure generated by tikzfigure v0.5.0 %% https://github.com/max-models/tikzfigure %% --------------------------------------------- %\begin{tikzpicture} % Row of circles \foreach \i in {0,1,...,5}{ \node[shape=circle, fill=blue!40, minimum size=0.8cm] (node0) at ({2 * \i}, {0}) {\i}; }\end{tikzpicture}Show the standalone LaTeX document
\documentclass[border=10pt]{standalone}\PassOptionsToPackage{dvipsnames,svgnames,x11names}{xcolor}\usepackage{tikz}\usepackage{pgfplots}\pgfplotsset{compat=newest}\usepgfplotslibrary{groupplots}\usetikzlibrary{arrows.meta}\begin{document}% --------------------------------------------- %% Tikzfigure generated by tikzfigure v0.5.0     %% https://github.com/max-models/tikzfigure      %% --------------------------------------------- %\begin{tikzpicture}    % Row of circles    \foreach \i in {0,1,...,5}{        \node[shape=circle, fill=blue!40, minimum size=0.8cm] (node0) at ({2 * \i}, {0}) {\i};    }\end{tikzpicture}
\end{document}
Loop variable in colour expressions
Section titled “Loop variable in colour expressions”TikZ colour mixing expressions like blue!\i0!red interpolate between two
colours. Here \i ranges from 1 to 9, so \i0 gives 10, 20, … 90 — a smooth
gradient from blue to red.
fig = TikzFigure()
with fig.loop(    "i",    range(1, 10),    comment="Colour gradient",) as i:    fig.node(        (2 * i, 0),        shape="circle",        fill=r"blue!\i0!red",        content=i,        minimum_size="1cm",        color="white",        font=r"\bfseries",    )
fig.show()
Show the TikZ code
% --------------------------------------------- %% Tikzfigure generated by tikzfigure v0.5.0 %% https://github.com/max-models/tikzfigure %% --------------------------------------------- %\begin{tikzpicture} % Colour gradient \foreach \i in {1,2,...,9}{ \node[shape=circle, color=white, fill=blue!\i0!red, minimum size=1cm, font=\bfseries] (node0) at ({2 * \i}, {0}) {\i}; }\end{tikzpicture}Show the standalone LaTeX document
\documentclass[border=10pt]{standalone}\PassOptionsToPackage{dvipsnames,svgnames,x11names}{xcolor}\usepackage{tikz}\usepackage{pgfplots}\pgfplotsset{compat=newest}\usepgfplotslibrary{groupplots}\usetikzlibrary{arrows.meta}\begin{document}% --------------------------------------------- %% Tikzfigure generated by tikzfigure v0.5.0     %% https://github.com/max-models/tikzfigure      %% --------------------------------------------- %\begin{tikzpicture}    % Colour gradient    \foreach \i in {1,2,...,9}{        \node[shape=circle, color=white, fill=blue!\i0!red, minimum size=1cm, font=\bfseries] (node0) at ({2 * \i}, {0}) {\i};    }\end{tikzpicture}
\end{document}
Nested loops: a 5x4 grid of nodes
Section titled “Nested loops: a 5x4 grid of nodes”Use a second fig.loop() inside the first to create a 2-D grid. The inner loop
variable \j is independent of the outer \i.
fig = TikzFigure()
with (    fig.loop(        "i",        range(5),        comment="Outer loop (columns)",    ) as i,    fig.loop(        "j",        range(4),        comment="Inner loop (rows)",    ) as j,):    fig.node(        (2 * i, 2 * j),        shape="rectangle",        fill="orange!30",        content=f"({i},{j})",        minimum_size="0.9cm",    )
fig.show()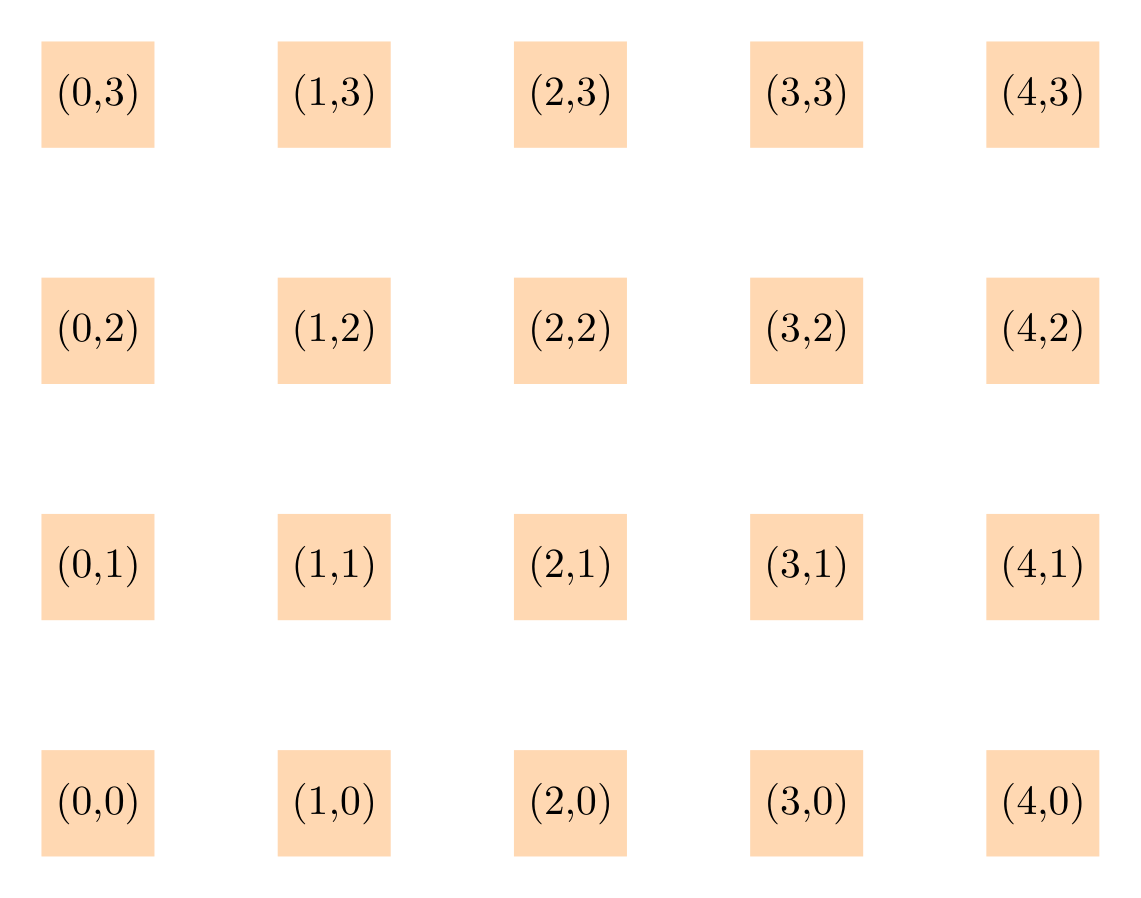
Show the TikZ code
% --------------------------------------------- %% Tikzfigure generated by tikzfigure v0.5.0 %% https://github.com/max-models/tikzfigure %% --------------------------------------------- %\begin{tikzpicture} % Outer loop (columns) \foreach \i in {0,1,...,4}{ % Inner loop (rows) \foreach \j in {0,1,...,3}{ \node[shape=rectangle, fill=orange!30, minimum size=0.9cm] (node0) at ({2 * \i}, {2 * \j}) {(\i,\j)}; } }\end{tikzpicture}Show the standalone LaTeX document
\documentclass[border=10pt]{standalone}\PassOptionsToPackage{dvipsnames,svgnames,x11names}{xcolor}\usepackage{tikz}\usepackage{pgfplots}\pgfplotsset{compat=newest}\usepgfplotslibrary{groupplots}\usetikzlibrary{arrows.meta}\begin{document}% --------------------------------------------- %% Tikzfigure generated by tikzfigure v0.5.0     %% https://github.com/max-models/tikzfigure      %% --------------------------------------------- %\begin{tikzpicture}    % Outer loop (columns)    \foreach \i in {0,1,...,4}{        % Inner loop (rows)        \foreach \j in {0,1,...,3}{            \node[shape=rectangle, fill=orange!30, minimum size=0.9cm] (node0) at ({2 * \i}, {2 * \j}) {(\i,\j)};        }    }\end{tikzpicture}
\end{document}
The generated TikZ is a compact nested \foreach — compare that with what 20
separate \node commands would look like.
variable: reusable TikZ constants
Section titled “variable: reusable TikZ constants”fig.variable(name, value) emits a \pgfmathsetmacro declaration at the top of
the picture. Use it to store a radius, spacing, or any numeric constant that you
want to be able to change in one place.
Here 12 nodes are placed on a circle of radius \radius. Python computes the
trigonometric coefficients; TikZ multiplies them by \radius at compile time.
import math
fig = TikzFigure()fig.variable("radius", 3)
N = 12for i in range(N):    frac = round(i / N, 4)    angle = frac * 2 * math.pi    fig.node(        (f"{{\\radius*{math.cos(angle):.4f}}}", f"{{\\radius*{math.sin(angle):.4f}}}"),        shape="circle",        fill="teal!50",        content=str(i + 1),        minimum_size="0.7cm",        color="white",        font=r"\small",    )
fig.show()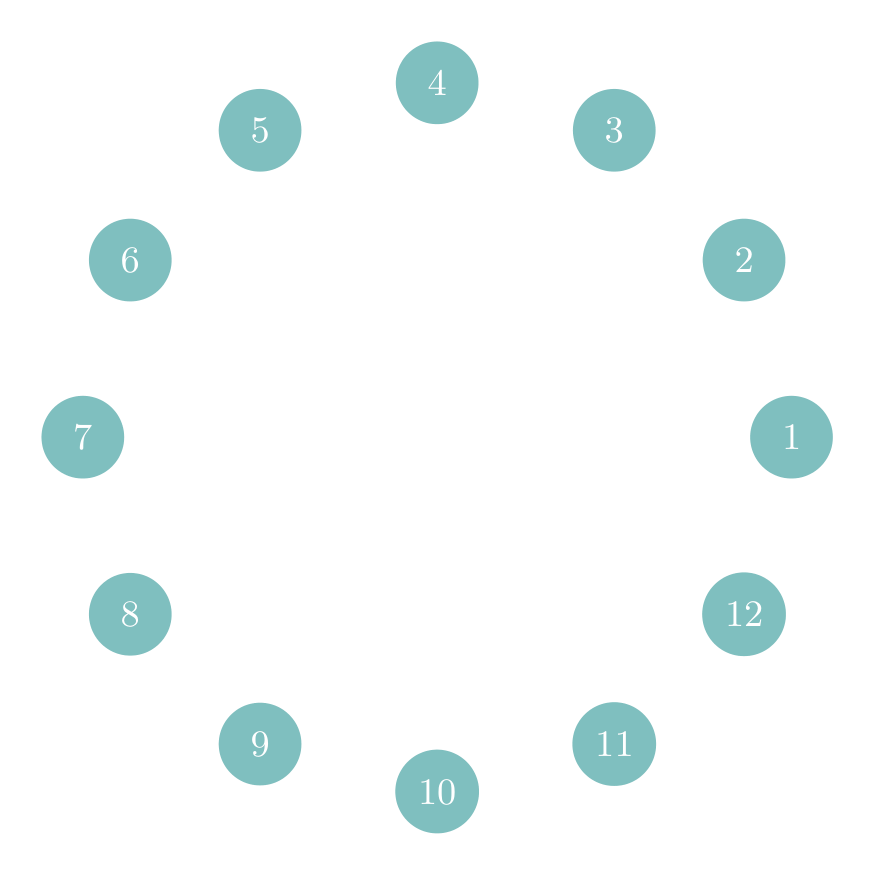
Show the TikZ code
% --------------------------------------------- %% Tikzfigure generated by tikzfigure v0.5.0 %% https://github.com/max-models/tikzfigure %% --------------------------------------------- %\begin{tikzpicture} \pgfmathsetmacro{\radius}{3} \node[shape=circle, color=white, fill=teal!50, minimum size=0.7cm, font=\small] (node0) at ({{\radius*1.0000}}, {{\radius*0.0000}}) {1}; \node[shape=circle, color=white, fill=teal!50, minimum size=0.7cm, font=\small] (node1) at ({{\radius*0.8661}}, {{\radius*0.4998}}) {2}; \node[shape=circle, color=white, fill=teal!50, minimum size=0.7cm, font=\small] (node2) at ({{\radius*0.4998}}, {{\radius*0.8661}}) {3}; \node[shape=circle, color=white, fill=teal!50, minimum size=0.7cm, font=\small] (node3) at ({{\radius*0.0000}}, {{\radius*1.0000}}) {4}; \node[shape=circle, color=white, fill=teal!50, minimum size=0.7cm, font=\small] (node4) at ({{\radius*-0.4998}}, {{\radius*0.8661}}) {5}; \node[shape=circle, color=white, fill=teal!50, minimum size=0.7cm, font=\small] (node5) at ({{\radius*-0.8661}}, {{\radius*0.4998}}) {6}; \node[shape=circle, color=white, fill=teal!50, minimum size=0.7cm, font=\small] (node6) at ({{\radius*-1.0000}}, {{\radius*0.0000}}) {7}; \node[shape=circle, color=white, fill=teal!50, minimum size=0.7cm, font=\small] (node7) at ({{\radius*-0.8661}}, {{\radius*-0.4998}}) {8}; \node[shape=circle, color=white, fill=teal!50, minimum size=0.7cm, font=\small] (node8) at ({{\radius*-0.4998}}, {{\radius*-0.8661}}) {9}; \node[shape=circle, color=white, fill=teal!50, minimum size=0.7cm, font=\small] (node9) at ({{\radius*-0.0000}}, {{\radius*-1.0000}}) {10}; \node[shape=circle, color=white, fill=teal!50, minimum size=0.7cm, font=\small] (node10) at ({{\radius*0.4998}}, {{\radius*-0.8661}}) {11}; \node[shape=circle, color=white, fill=teal!50, minimum size=0.7cm, font=\small] (node11) at ({{\radius*0.8661}}, {{\radius*-0.4998}}) {12};\end{tikzpicture}Show the standalone LaTeX document
\documentclass[border=10pt]{standalone}\PassOptionsToPackage{dvipsnames,svgnames,x11names}{xcolor}\usepackage{tikz}\usepackage{pgfplots}\pgfplotsset{compat=newest}\usepgfplotslibrary{groupplots}\usetikzlibrary{arrows.meta}\begin{document}% --------------------------------------------- %% Tikzfigure generated by tikzfigure v0.5.0     %% https://github.com/max-models/tikzfigure      %% --------------------------------------------- %\begin{tikzpicture}    \pgfmathsetmacro{\radius}{3}    \node[shape=circle, color=white, fill=teal!50, minimum size=0.7cm, font=\small] (node0) at ({{\radius*1.0000}}, {{\radius*0.0000}}) {1};    \node[shape=circle, color=white, fill=teal!50, minimum size=0.7cm, font=\small] (node1) at ({{\radius*0.8661}}, {{\radius*0.4998}}) {2};    \node[shape=circle, color=white, fill=teal!50, minimum size=0.7cm, font=\small] (node2) at ({{\radius*0.4998}}, {{\radius*0.8661}}) {3};    \node[shape=circle, color=white, fill=teal!50, minimum size=0.7cm, font=\small] (node3) at ({{\radius*0.0000}}, {{\radius*1.0000}}) {4};    \node[shape=circle, color=white, fill=teal!50, minimum size=0.7cm, font=\small] (node4) at ({{\radius*-0.4998}}, {{\radius*0.8661}}) {5};    \node[shape=circle, color=white, fill=teal!50, minimum size=0.7cm, font=\small] (node5) at ({{\radius*-0.8661}}, {{\radius*0.4998}}) {6};    \node[shape=circle, color=white, fill=teal!50, minimum size=0.7cm, font=\small] (node6) at ({{\radius*-1.0000}}, {{\radius*0.0000}}) {7};    \node[shape=circle, color=white, fill=teal!50, minimum size=0.7cm, font=\small] (node7) at ({{\radius*-0.8661}}, {{\radius*-0.4998}}) {8};    \node[shape=circle, color=white, fill=teal!50, minimum size=0.7cm, font=\small] (node8) at ({{\radius*-0.4998}}, {{\radius*-0.8661}}) {9};    \node[shape=circle, color=white, fill=teal!50, minimum size=0.7cm, font=\small] (node9) at ({{\radius*-0.0000}}, {{\radius*-1.0000}}) {10};    \node[shape=circle, color=white, fill=teal!50, minimum size=0.7cm, font=\small] (node10) at ({{\radius*0.4998}}, {{\radius*-0.8661}}) {11};    \node[shape=circle, color=white, fill=teal!50, minimum size=0.7cm, font=\small] (node11) at ({{\radius*0.8661}}, {{\radius*-0.4998}}) {12};\end{tikzpicture}
\end{document}
Changing fig.variable("radius", 5) would scale the entire circle without
touching any node code.
Heart shape
Section titled “Heart shape”Remember the heart shape from the styling
tutorial? It can be drawn with a single
\draw command
width, height = 1.75, 2.0
fig = TikzFigure()
fig.colorlet("lightred", "red!40!white")fig.variable("width", 1.75)fig.variable("height", 2.0)
A = fig.node(r"-\width", r"\height")B = fig.node((0, 0))C = fig.node(r"\width", r"\height")D = fig.node(0, r"\height")
fig.draw(    A.to(B, options=["out=-90, in=135"])    .to(C, options=["out=45, in=-90"])    .to(D, options=["in=80, out=100"])    .to(A, options=["in=80, out=100"]),    color="red",    line_width=4,    cycle=True,    center=True,    fill="lightred",)
fig.show()
Practical example: a chain of labelled boxes
Section titled “Practical example: a chain of labelled boxes”A common diagram pattern is a horizontal chain of labelled boxes connected by
arrows. Using a \foreach loop keeps the LaTeX concise even for long chains.
steps = ["Load", "Clean", "Transform", "Model", "Evaluate"]
fig = TikzFigure()
# Draw boxes via a TikZ foreach over a comma-separated list of indiceswith fig.loop(    "i",    range(len(steps)),    comment="Pipeline steps",) as loop:    loop.node(        (r"3*\i", 0),        shape="rectangle",        fill="blue!20",        draw="blue!60",        minimum_width="2.2cm",        minimum_height="0.8cm",        rounded_corners="4pt",        line_width=1.5,    )
# Add step labels in Python (strings can't live inside \foreach easily)for i, step in enumerate(steps):    fig.node(        (i * 3, 0),        content=step,        draw="none",        font=r"\small\bfseries",    )
# Draw arrows between boxesfor i in range(len(steps) - 1):    fig.draw(        [(i * 3 + 1.1, 0), (i * 3 + 1.9, 0)],        arrows=arrows.forward,        line_width=1.5,        color="blue!60",    )
fig.show()
Show the TikZ code
% --------------------------------------------- %% Tikzfigure generated by tikzfigure v0.5.0 %% https://github.com/max-models/tikzfigure %% --------------------------------------------- %\begin{tikzpicture} % Pipeline steps \foreach \i in {0,1,...,4}{ \node[shape=rectangle, fill=blue!20, draw=blue!60, minimum width=2.2cm, minimum height=0.8cm, line width=1.5, rounded corners=4pt] () at ({3*\i}, {0}) {}; } \node[draw=none, font=\small\bfseries] (node0) at ({0}, {0}) {Load}; \node[draw=none, font=\small\bfseries] (node1) at ({3}, {0}) {Clean}; \node[draw=none, font=\small\bfseries] (node2) at ({6}, {0}) {Transform}; \node[draw=none, font=\small\bfseries] (node3) at ({9}, {0}) {Model}; \node[draw=none, font=\small\bfseries] (node4) at ({12}, {0}) {Evaluate}; \draw[->, color=blue!60, line width=1.5] (1.1, 0) to (1.9, 0); \draw[->, color=blue!60, line width=1.5] (4.1, 0) to (4.9, 0); \draw[->, color=blue!60, line width=1.5] (7.1, 0) to (7.9, 0); \draw[->, color=blue!60, line width=1.5] (10.1, 0) to (10.9, 0);\end{tikzpicture}Show the standalone LaTeX document
\documentclass[border=10pt]{standalone}\PassOptionsToPackage{dvipsnames,svgnames,x11names}{xcolor}\usepackage{tikz}\usepackage{pgfplots}\pgfplotsset{compat=newest}\usepgfplotslibrary{groupplots}\usetikzlibrary{arrows.meta}\begin{document}% --------------------------------------------- %% Tikzfigure generated by tikzfigure v0.5.0     %% https://github.com/max-models/tikzfigure      %% --------------------------------------------- %\begin{tikzpicture}    % Pipeline steps    \foreach \i in {0,1,...,4}{        \node[shape=rectangle, fill=blue!20, draw=blue!60, minimum width=2.2cm, minimum height=0.8cm, line width=1.5, rounded corners=4pt] () at ({3*\i}, {0}) {};    }    \node[draw=none, font=\small\bfseries] (node0) at ({0}, {0}) {Load};    \node[draw=none, font=\small\bfseries] (node1) at ({3}, {0}) {Clean};    \node[draw=none, font=\small\bfseries] (node2) at ({6}, {0}) {Transform};    \node[draw=none, font=\small\bfseries] (node3) at ({9}, {0}) {Model};    \node[draw=none, font=\small\bfseries] (node4) at ({12}, {0}) {Evaluate};    \draw[->, color=blue!60, line width=1.5] (1.1, 0) to (1.9, 0);    \draw[->, color=blue!60, line width=1.5] (4.1, 0) to (4.9, 0);    \draw[->, color=blue!60, line width=1.5] (7.1, 0) to (7.9, 0);    \draw[->, color=blue!60, line width=1.5] (10.1, 0) to (10.9, 0);\end{tikzpicture}
\end{document}