2D plot functions
pgfplots can evaluate mathematical functions directly, and Python’s math
module gives you full flexibility for data generation.
import math
from tikzfigure import TikzFigure
Plotting functions directly
Section titled “Plotting functions directly”Pass a function expression as a string to func= for smooth curves without
pre-computing data points:
fig = TikzFigure()
ax = fig.axis2d(    xlabel="x",    ylabel="y",    xlim=(0, 360),    ylim=(-1.5, 1.5),    grid=True,)
ax.add_plot(    func="sin(x)",    label=r"$\sin(x)$",    color="red",    line_width="1.5pt",)ax.add_plot(    func="cos(x)",    label=r"$\cos(x)$",    color="blue",    line_width="1.5pt",)
ax.set_legend(position="south east")fig.show()
/home/runner/work/tikzfigure/tikzfigure/.venv/lib/python3.12/site-packages/fitz/__init__.py:17: FutureWarning: The `fitz` API is deprecated and will be removed in future. Use `import pymupdf` instead. warnings.warn(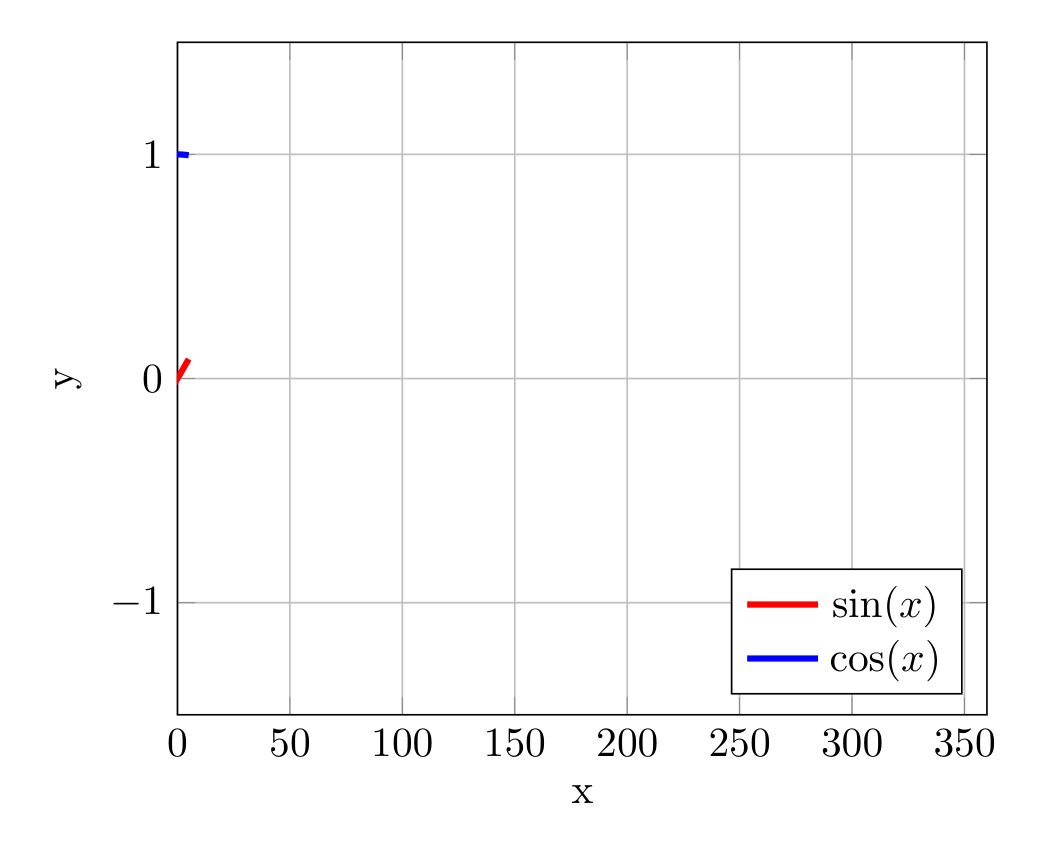
Show the TikZ code
% --------------------------------------------- %% Tikzfigure generated by tikzfigure v0.5.0 %% https://github.com/max-models/tikzfigure %% --------------------------------------------- %\begin{tikzpicture} \begin{axis}[xlabel=x, ylabel=y, xmin=0, xmax=360, ymin=-1.5, ymax=1.5, grid=major, legend pos=south east] \addplot[color=red, line width=1.5pt] {sin(x)}; \addplot[color=blue, line width=1.5pt] {cos(x)}; \legend{$\sin(x)$, $\cos(x)$} \end{axis}\end{tikzpicture}Show the standalone LaTeX document
\documentclass[border=10pt]{standalone}\PassOptionsToPackage{dvipsnames,svgnames,x11names}{xcolor}\usepackage{tikz}\usepackage{pgfplots}\pgfplotsset{compat=newest}\usepgfplotslibrary{groupplots}\usetikzlibrary{arrows.meta}\usepackage{pgfplots}\begin{document}% --------------------------------------------- %% Tikzfigure generated by tikzfigure v0.5.0     %% https://github.com/max-models/tikzfigure      %% --------------------------------------------- %\begin{tikzpicture}    \begin{axis}[xlabel=x, ylabel=y, xmin=0, xmax=360, ymin=-1.5, ymax=1.5, grid=major, legend pos=south east]        \addplot[color=red, line width=1.5pt] {sin(x)};        \addplot[color=blue, line width=1.5pt] {cos(x)};        \legend{$\sin(x)$, $\cos(x)$}    \end{axis}\end{tikzpicture}
\end{document}
func accepts any pgfplots expression: sin(x), cos(x), x^2, sqrt(x),
exp(x), ln(x), etc.
Comparing functions
Section titled “Comparing functions”Plot multiple functions side-by-side:
fig = TikzFigure()
ax = fig.axis2d(    xlabel="$x$",    ylabel="$y$",    xlim=(0, 10),    ylim=(0, 5),    grid=True,)
ax.add_plot(func="x", label="$x$", color="black")ax.add_plot(    func="sqrt(x)",    label=r"$\sqrt{x}$",    color="blue",    line_width="2pt",)ax.add_plot(    func="x/2",    label="$x/2$",    color="green",)
ax.set_legend(position="north west")fig.show()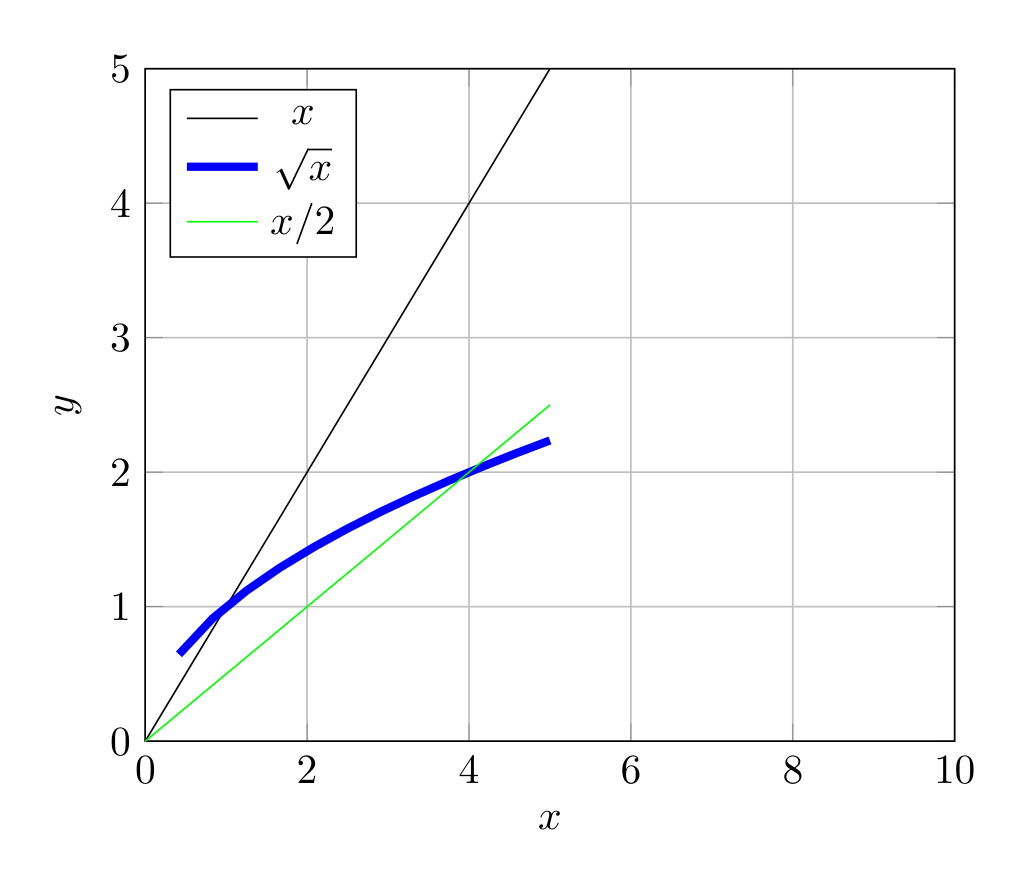
Show the TikZ code
% --------------------------------------------- %% Tikzfigure generated by tikzfigure v0.5.0 %% https://github.com/max-models/tikzfigure %% --------------------------------------------- %\begin{tikzpicture} \begin{axis}[xlabel=$x$, ylabel=$y$, xmin=0, xmax=10, ymin=0, ymax=5, grid=major, legend pos=north west] \addplot[color=black] {x}; \addplot[color=blue, line width=2pt] {sqrt(x)}; \addplot[color=green] {x/2}; \legend{$x$, $\sqrt{x}$, $x/2$} \end{axis}\end{tikzpicture}Show the standalone LaTeX document
\documentclass[border=10pt]{standalone}\PassOptionsToPackage{dvipsnames,svgnames,x11names}{xcolor}\usepackage{tikz}\usepackage{pgfplots}\pgfplotsset{compat=newest}\usepgfplotslibrary{groupplots}\usetikzlibrary{arrows.meta}\usepackage{pgfplots}\begin{document}% --------------------------------------------- %% Tikzfigure generated by tikzfigure v0.5.0     %% https://github.com/max-models/tikzfigure      %% --------------------------------------------- %\begin{tikzpicture}    \begin{axis}[xlabel=$x$, ylabel=$y$, xmin=0, xmax=10, ymin=0, ymax=5, grid=major, legend pos=north west]        \addplot[color=black] {x};        \addplot[color=blue, line width=2pt] {sqrt(x)};        \addplot[color=green] {x/2};        \legend{$x$, $\sqrt{x}$, $x/2$}    \end{axis}\end{tikzpicture}
\end{document}
Generating data with Python
Section titled “Generating data with Python”For more complex curves, use Python’s math module with list comprehensions:
fig = TikzFigure()
ax = fig.axis2d(    xlabel="Angle (radians)",    ylabel="Amplitude",    xlim=(0, 6.5),    ylim=(-1.5, 1.5),    grid=True,)
x = [i * 0.1 for i in range(65)]y_sin = [math.sin(xi) for xi in x]y_cos = [math.cos(xi) for xi in x]
ax.add_plot(    x,    y_sin,    label=r"$\sin(x)$",    color="red",)ax.add_plot(    x,    y_cos,    label=r"$\cos(x)$",    color="blue",)
ax.set_legend(position="south east")fig.show()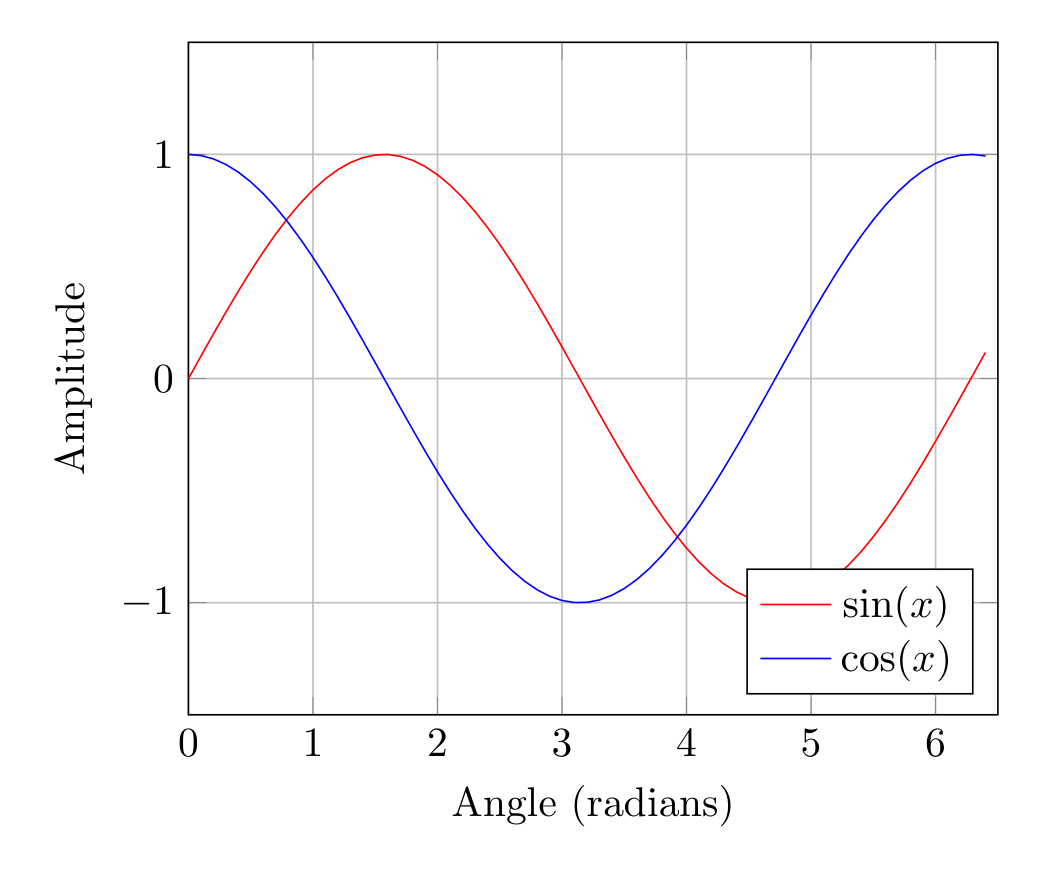
Show the TikZ code
% --------------------------------------------- %% Tikzfigure generated by tikzfigure v0.5.0 %% https://github.com/max-models/tikzfigure %% --------------------------------------------- %\begin{tikzpicture} \begin{axis}[xlabel=Angle (radians), ylabel=Amplitude, xmin=0, xmax=6.5, ymin=-1.5, ymax=1.5, grid=major, legend pos=south east] \addplot[color=red] coordinates {(0.0,0.0) (0.1,0.09983341664682815) (0.2,0.19866933079506122) (0.30000000000000004,0.2955202066613396) (0.4,0.3894183423086505) (0.5,0.479425538604203) (0.6000000000000001,0.5646424733950355) (0.7000000000000001,0.6442176872376911) (0.8,0.7173560908995228) (0.9,0.7833269096274834) (1.0,0.8414709848078965) (1.1,0.8912073600614354) (1.2000000000000002,0.9320390859672264) (1.3,0.963558185417193) (1.4000000000000001,0.9854497299884603) (1.5,0.9974949866040544) (1.6,0.9995736030415051) (1.7000000000000002,0.9916648104524686) (1.8,0.9738476308781951) (1.9000000000000001,0.9463000876874145) (2.0,0.9092974268256817) (2.1,0.8632093666488737) (2.2,0.8084964038195901) (2.3000000000000003,0.74570521217672) (2.4000000000000004,0.6754631805511506) (2.5,0.5984721441039565) (2.6,0.5155013718214642) (2.7,0.4273798802338298) (2.8000000000000003,0.33498815015590466) (2.9000000000000004,0.23924932921398198) (3.0,0.1411200080598672) (3.1,0.04158066243329049) (3.2,-0.058374143427580086) (3.3000000000000003,-0.15774569414324865) (3.4000000000000004,-0.25554110202683167) (3.5,-0.35078322768961984) (3.6,-0.44252044329485246) (3.7,-0.5298361409084934) (3.8000000000000003,-0.6118578909427193) (3.9000000000000004,-0.6877661591839741) (4.0,-0.7568024953079282) (4.1000000000000005,-0.8182771110644108) (4.2,-0.8715757724135882) (4.3,-0.9161659367494549) (4.4,-0.951602073889516) (4.5,-0.977530117665097) (4.6000000000000005,-0.9936910036334645) (4.7,-0.9999232575641008) (4.800000000000001,-0.9961646088358406) (4.9,-0.9824526126243325) (5.0,-0.9589242746631385) (5.1000000000000005,-0.9258146823277321) (5.2,-0.8834546557201531) (5.300000000000001,-0.8322674422239008) (5.4,-0.7727644875559871) (5.5,-0.7055403255703919) (5.6000000000000005,-0.6312666378723208) (5.7,-0.5506855425976376) (5.800000000000001,-0.4646021794137566) (5.9,-0.373876664830236) (6.0,-0.27941549819892586) (6.1000000000000005,-0.18216250427209502) (6.2,-0.0830894028174964) (6.300000000000001,0.0168139004843506) (6.4,0.11654920485049364)}; \addplot[color=blue] coordinates {(0.0,1.0) (0.1,0.9950041652780258) (0.2,0.9800665778412416) (0.30000000000000004,0.955336489125606) (0.4,0.9210609940028851) (0.5,0.8775825618903728) (0.6000000000000001,0.8253356149096782) (0.7000000000000001,0.7648421872844884) (0.8,0.6967067093471654) (0.9,0.6216099682706644) (1.0,0.5403023058681398) (1.1,0.4535961214255773) (1.2000000000000002,0.3623577544766734) (1.3,0.26749882862458735) (1.4000000000000001,0.16996714290024081) (1.5,0.0707372016677029) (1.6,-0.029199522301288815) (1.7000000000000002,-0.12884449429552486) (1.8,-0.2272020946930871) (1.9000000000000001,-0.3232895668635036) (2.0,-0.4161468365471424) (2.1,-0.5048461045998576) (2.2,-0.5885011172553458) (2.3000000000000003,-0.6662760212798244) (2.4000000000000004,-0.7373937155412458) (2.5,-0.8011436155469337) (2.6,-0.8568887533689473) (2.7,-0.9040721420170612) (2.8000000000000003,-0.9422223406686583) (2.9000000000000004,-0.9709581651495907) (3.0,-0.9899924966004454) (3.1,-0.9991351502732795) (3.2,-0.9982947757947531) (3.3000000000000003,-0.9874797699088649) (3.4000000000000004,-0.9667981925794609) (3.5,-0.9364566872907963) (3.6,-0.896758416334147) (3.7,-0.848100031710408) (3.8000000000000003,-0.7909677119144165) (3.9000000000000004,-0.7259323042001399) (4.0,-0.6536436208636119) (4.1000000000000005,-0.5748239465332685) (4.2,-0.4902608213406994) (4.3,-0.40079917207997545) (4.4,-0.30733286997841935) (4.5,-0.2107957994307797) (4.6000000000000005,-0.11215252693505398) (4.7,-0.01238866346289056) (4.800000000000001,0.08749898343944727) (4.9,0.18651236942257576) (5.0,0.28366218546322625) (5.1000000000000005,0.37797774271298107) (5.2,0.4685166713003771) (5.300000000000001,0.5543743361791615) (5.4,0.6346928759426347) (5.5,0.70866977429126) (5.6000000000000005,0.7755658785102502) (5.7,0.8347127848391598) (5.800000000000001,0.8855195169413194) (5.9,0.9274784307440359) (6.0,0.960170286650366) (6.1000000000000005,0.9832684384425847) (6.2,0.9965420970232175) (6.300000000000001,0.9998586363834151) (6.4,0.9931849187581926)}; \legend{$\sin(x)$, $\cos(x)$} \end{axis}\end{tikzpicture}Show the standalone LaTeX document
\documentclass[border=10pt]{standalone}\PassOptionsToPackage{dvipsnames,svgnames,x11names}{xcolor}\usepackage{tikz}\usepackage{pgfplots}\pgfplotsset{compat=newest}\usepgfplotslibrary{groupplots}\usetikzlibrary{arrows.meta}\usepackage{pgfplots}\begin{document}% --------------------------------------------- %% Tikzfigure generated by tikzfigure v0.5.0     %% https://github.com/max-models/tikzfigure      %% --------------------------------------------- %\begin{tikzpicture}    \begin{axis}[xlabel=Angle (radians), ylabel=Amplitude, xmin=0, xmax=6.5, ymin=-1.5, ymax=1.5, grid=major, legend pos=south east]        \addplot[color=red] coordinates {(0.0,0.0) (0.1,0.09983341664682815) (0.2,0.19866933079506122) (0.30000000000000004,0.2955202066613396) (0.4,0.3894183423086505) (0.5,0.479425538604203) (0.6000000000000001,0.5646424733950355) (0.7000000000000001,0.6442176872376911) (0.8,0.7173560908995228) (0.9,0.7833269096274834) (1.0,0.8414709848078965) (1.1,0.8912073600614354) (1.2000000000000002,0.9320390859672264) (1.3,0.963558185417193) (1.4000000000000001,0.9854497299884603) (1.5,0.9974949866040544) (1.6,0.9995736030415051) (1.7000000000000002,0.9916648104524686) (1.8,0.9738476308781951) (1.9000000000000001,0.9463000876874145) (2.0,0.9092974268256817) (2.1,0.8632093666488737) (2.2,0.8084964038195901) (2.3000000000000003,0.74570521217672) (2.4000000000000004,0.6754631805511506) (2.5,0.5984721441039565) (2.6,0.5155013718214642) (2.7,0.4273798802338298) (2.8000000000000003,0.33498815015590466) (2.9000000000000004,0.23924932921398198) (3.0,0.1411200080598672) (3.1,0.04158066243329049) (3.2,-0.058374143427580086) (3.3000000000000003,-0.15774569414324865) (3.4000000000000004,-0.25554110202683167) (3.5,-0.35078322768961984) (3.6,-0.44252044329485246) (3.7,-0.5298361409084934) (3.8000000000000003,-0.6118578909427193) (3.9000000000000004,-0.6877661591839741) (4.0,-0.7568024953079282) (4.1000000000000005,-0.8182771110644108) (4.2,-0.8715757724135882) (4.3,-0.9161659367494549) (4.4,-0.951602073889516) (4.5,-0.977530117665097) (4.6000000000000005,-0.9936910036334645) (4.7,-0.9999232575641008) (4.800000000000001,-0.9961646088358406) (4.9,-0.9824526126243325) (5.0,-0.9589242746631385) (5.1000000000000005,-0.9258146823277321) (5.2,-0.8834546557201531) (5.300000000000001,-0.8322674422239008) (5.4,-0.7727644875559871) (5.5,-0.7055403255703919) (5.6000000000000005,-0.6312666378723208) (5.7,-0.5506855425976376) (5.800000000000001,-0.4646021794137566) (5.9,-0.373876664830236) (6.0,-0.27941549819892586) (6.1000000000000005,-0.18216250427209502) (6.2,-0.0830894028174964) (6.300000000000001,0.0168139004843506) (6.4,0.11654920485049364)};        \addplot[color=blue] coordinates {(0.0,1.0) (0.1,0.9950041652780258) (0.2,0.9800665778412416) (0.30000000000000004,0.955336489125606) (0.4,0.9210609940028851) (0.5,0.8775825618903728) (0.6000000000000001,0.8253356149096782) (0.7000000000000001,0.7648421872844884) (0.8,0.6967067093471654) (0.9,0.6216099682706644) (1.0,0.5403023058681398) (1.1,0.4535961214255773) (1.2000000000000002,0.3623577544766734) (1.3,0.26749882862458735) (1.4000000000000001,0.16996714290024081) (1.5,0.0707372016677029) (1.6,-0.029199522301288815) (1.7000000000000002,-0.12884449429552486) (1.8,-0.2272020946930871) (1.9000000000000001,-0.3232895668635036) (2.0,-0.4161468365471424) (2.1,-0.5048461045998576) (2.2,-0.5885011172553458) (2.3000000000000003,-0.6662760212798244) (2.4000000000000004,-0.7373937155412458) (2.5,-0.8011436155469337) (2.6,-0.8568887533689473) (2.7,-0.9040721420170612) (2.8000000000000003,-0.9422223406686583) (2.9000000000000004,-0.9709581651495907) (3.0,-0.9899924966004454) (3.1,-0.9991351502732795) (3.2,-0.9982947757947531) (3.3000000000000003,-0.9874797699088649) (3.4000000000000004,-0.9667981925794609) (3.5,-0.9364566872907963) (3.6,-0.896758416334147) (3.7,-0.848100031710408) (3.8000000000000003,-0.7909677119144165) (3.9000000000000004,-0.7259323042001399) (4.0,-0.6536436208636119) (4.1000000000000005,-0.5748239465332685) (4.2,-0.4902608213406994) (4.3,-0.40079917207997545) (4.4,-0.30733286997841935) (4.5,-0.2107957994307797) (4.6000000000000005,-0.11215252693505398) (4.7,-0.01238866346289056) (4.800000000000001,0.08749898343944727) (4.9,0.18651236942257576) (5.0,0.28366218546322625) (5.1000000000000005,0.37797774271298107) (5.2,0.4685166713003771) (5.300000000000001,0.5543743361791615) (5.4,0.6346928759426347) (5.5,0.70866977429126) (5.6000000000000005,0.7755658785102502) (5.7,0.8347127848391598) (5.800000000000001,0.8855195169413194) (5.9,0.9274784307440359) (6.0,0.960170286650366) (6.1000000000000005,0.9832684384425847) (6.2,0.9965420970232175) (6.300000000000001,0.9998586363834151) (6.4,0.9931849187581926)};        \legend{$\sin(x)$, $\cos(x)$}    \end{axis}\end{tikzpicture}
\end{document}
Exponential growth
Section titled “Exponential growth”Visualizing exponential functions with Python-generated data:
fig = TikzFigure()
ax = fig.axis2d(    xlabel="Time (years)",    ylabel="Population",    xlim=(0, 10),    ylim=(0, 1000),    grid=True,)
time = [i for i in range(11)]population = [100 * math.exp(0.1 * t) for t in time]
ax.add_plot(    time,    population,    label="$P(t) = 100 e^{0.1t}$",    color="DarkGreen",    mark="o",    mark_size="2pt",)
ax.set_legend(position="north west")fig.show()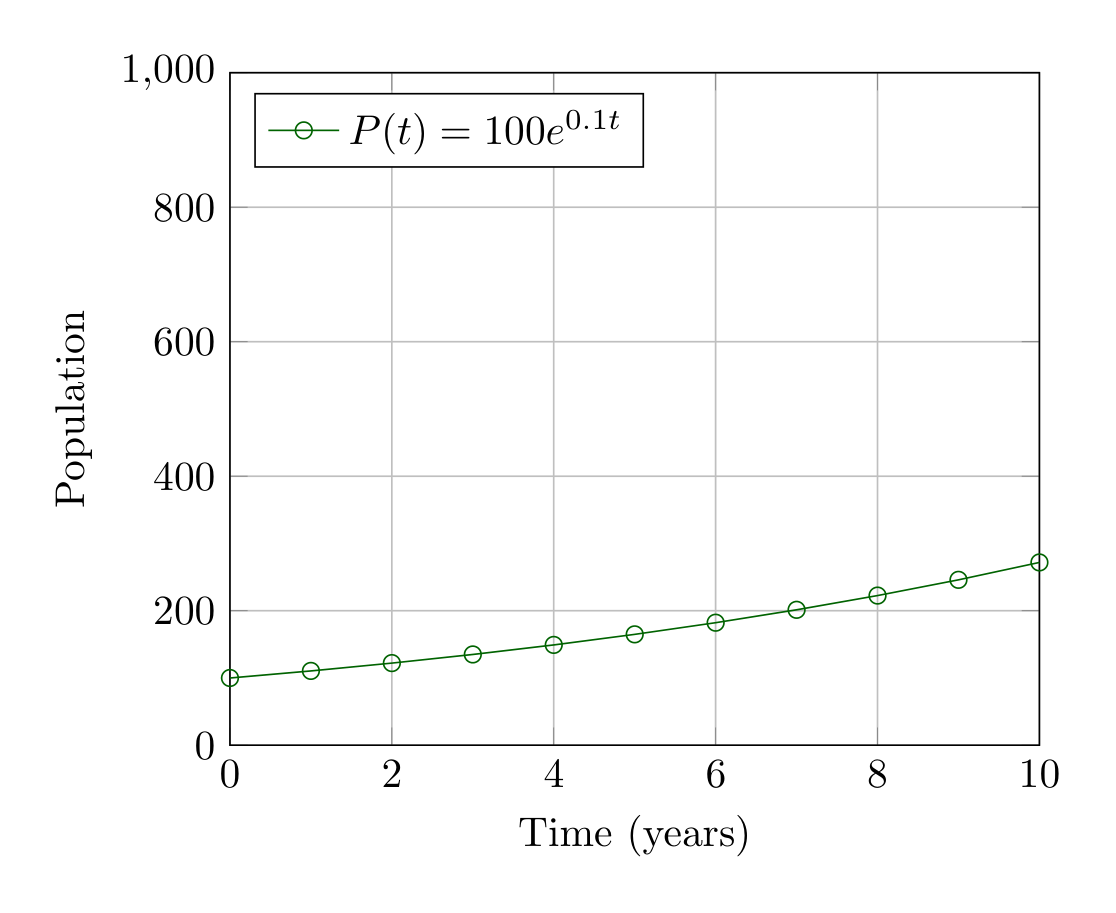
Show the TikZ code
% --------------------------------------------- %% Tikzfigure generated by tikzfigure v0.5.0 %% https://github.com/max-models/tikzfigure %% --------------------------------------------- %\begin{tikzpicture} \begin{axis}[xlabel=Time (years), ylabel=Population, xmin=0, xmax=10, ymin=0, ymax=1000, grid=major, legend pos=north west] \addplot[color=DarkGreen, mark=o, mark size=2pt] coordinates {(0,100.0) (1,110.51709180756477) (2,122.14027581601698) (3,134.9858807576003) (4,149.18246976412703) (5,164.87212707001282) (6,182.21188003905093) (7,201.37527074704767) (8,222.55409284924679) (9,245.960311115695) (10,271.8281828459045)}; \legend{{$P(t) = 100 e^{0.1t}$}} \end{axis}\end{tikzpicture}Show the standalone LaTeX document
\documentclass[border=10pt]{standalone}\PassOptionsToPackage{dvipsnames,svgnames,x11names}{xcolor}\usepackage{tikz}\usepackage{pgfplots}\pgfplotsset{compat=newest}\usepgfplotslibrary{groupplots}\usetikzlibrary{arrows.meta}\usepackage{pgfplots}\begin{document}% --------------------------------------------- %% Tikzfigure generated by tikzfigure v0.5.0     %% https://github.com/max-models/tikzfigure      %% --------------------------------------------- %\begin{tikzpicture}    \begin{axis}[xlabel=Time (years), ylabel=Population, xmin=0, xmax=10, ymin=0, ymax=1000, grid=major, legend pos=north west]        \addplot[color=DarkGreen, mark=o, mark size=2pt] coordinates {(0,100.0) (1,110.51709180756477) (2,122.14027581601698) (3,134.9858807576003) (4,149.18246976412703) (5,164.87212707001282) (6,182.21188003905093) (7,201.37527074704767) (8,222.55409284924679) (9,245.960311115695) (10,271.8281828459045)};        \legend{{$P(t) = 100 e^{0.1t}$}}    \end{axis}\end{tikzpicture}
\end{document}