Opacity
tikzfigure provides fine-grained control over transparency at every level: whole nodes, just the fill, just the stroke, paths, and the final PNG background. This tutorial covers:
opacityon nodesfill_opacityvsdraw_opacityindependentlyopacityandfill_opacityon paths- transparent vs white backgrounds with
show()andsavefig() - a practical Venn diagram
from tikzfigure import TikzFigureopacity on nodes
Section titled “opacity on nodes”opacity controls the overall transparency of a node (both fill and stroke
together). A value of 1.0 is fully opaque; 0.0 is invisible.
The circles below overlap so you can see how lower opacity lets underlying content show through.
fig = TikzFigure()
opacities = [1.0, 0.8, 0.6, 0.4, 0.2]
for i, op in enumerate(opacities):    fig.node(        (i * 1.5, 0),        shape="circle",        fill="blue!60",        draw="blue!80",        minimum_size="2.5cm",        opacity=op,    )    fig.node(        (i * 1.5, -1.8),        content=f"opacity={op}",        draw="none",        font=r"\tiny",    )
fig.show()
/home/runner/work/tikzfigure/tikzfigure/.venv/lib/python3.12/site-packages/fitz/__init__.py:17: FutureWarning: The `fitz` API is deprecated and will be removed in future. Use `import pymupdf` instead. warnings.warn(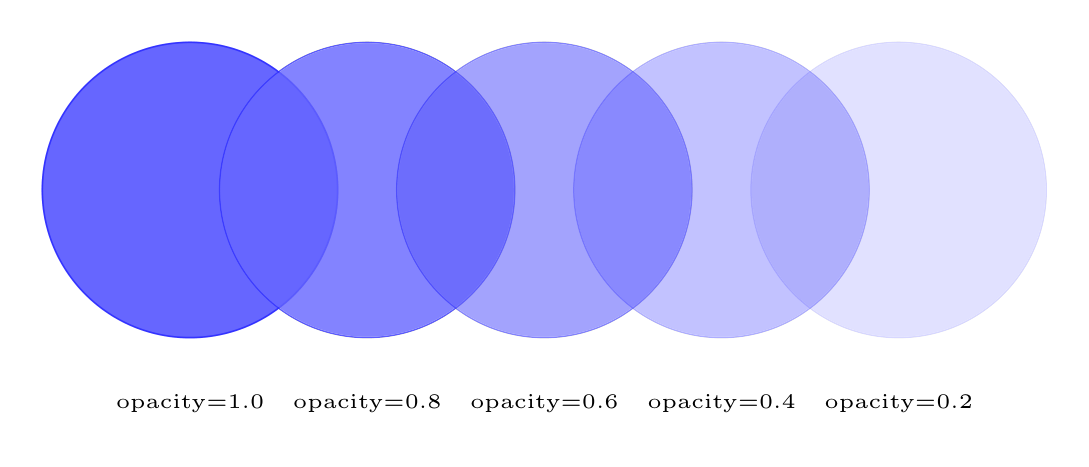
Show the TikZ code
% --------------------------------------------- %% Tikzfigure generated by tikzfigure v0.5.0 %% https://github.com/max-models/tikzfigure %% --------------------------------------------- %\begin{tikzpicture} \node[shape=circle, fill=blue!60, draw=blue!80, opacity=1.0, minimum size=2.5cm] (node0) at ({0.0}, {0}) {}; \node[draw=none, font=\tiny] (node1) at ({0.0}, {-1.8}) {opacity=1.0}; \node[shape=circle, fill=blue!60, draw=blue!80, opacity=0.8, minimum size=2.5cm] (node2) at ({1.5}, {0}) {}; \node[draw=none, font=\tiny] (node3) at ({1.5}, {-1.8}) {opacity=0.8}; \node[shape=circle, fill=blue!60, draw=blue!80, opacity=0.6, minimum size=2.5cm] (node4) at ({3.0}, {0}) {}; \node[draw=none, font=\tiny] (node5) at ({3.0}, {-1.8}) {opacity=0.6}; \node[shape=circle, fill=blue!60, draw=blue!80, opacity=0.4, minimum size=2.5cm] (node6) at ({4.5}, {0}) {}; \node[draw=none, font=\tiny] (node7) at ({4.5}, {-1.8}) {opacity=0.4}; \node[shape=circle, fill=blue!60, draw=blue!80, opacity=0.2, minimum size=2.5cm] (node8) at ({6.0}, {0}) {}; \node[draw=none, font=\tiny] (node9) at ({6.0}, {-1.8}) {opacity=0.2};\end{tikzpicture}Show the standalone LaTeX document
\documentclass[border=10pt]{standalone}\PassOptionsToPackage{dvipsnames,svgnames,x11names}{xcolor}\usepackage{tikz}\usepackage{pgfplots}\pgfplotsset{compat=newest}\usepgfplotslibrary{groupplots}\usetikzlibrary{arrows.meta}\begin{document}% --------------------------------------------- %% Tikzfigure generated by tikzfigure v0.5.0     %% https://github.com/max-models/tikzfigure      %% --------------------------------------------- %\begin{tikzpicture}    \node[shape=circle, fill=blue!60, draw=blue!80, opacity=1.0, minimum size=2.5cm] (node0) at ({0.0}, {0}) {};    \node[draw=none, font=\tiny] (node1) at ({0.0}, {-1.8}) {opacity=1.0};    \node[shape=circle, fill=blue!60, draw=blue!80, opacity=0.8, minimum size=2.5cm] (node2) at ({1.5}, {0}) {};    \node[draw=none, font=\tiny] (node3) at ({1.5}, {-1.8}) {opacity=0.8};    \node[shape=circle, fill=blue!60, draw=blue!80, opacity=0.6, minimum size=2.5cm] (node4) at ({3.0}, {0}) {};    \node[draw=none, font=\tiny] (node5) at ({3.0}, {-1.8}) {opacity=0.6};    \node[shape=circle, fill=blue!60, draw=blue!80, opacity=0.4, minimum size=2.5cm] (node6) at ({4.5}, {0}) {};    \node[draw=none, font=\tiny] (node7) at ({4.5}, {-1.8}) {opacity=0.4};    \node[shape=circle, fill=blue!60, draw=blue!80, opacity=0.2, minimum size=2.5cm] (node8) at ({6.0}, {0}) {};    \node[draw=none, font=\tiny] (node9) at ({6.0}, {-1.8}) {opacity=0.2};\end{tikzpicture}
\end{document}
fill_opacity vs draw_opacity
Section titled “fill_opacity vs draw_opacity”fill_opacity and draw_opacity let you control the fill and stroke
independently. Here every node has an opaque border but a translucent fill — a
common styling choice for overlapping regions.
fig = TikzFigure()
colors = ["red", "blue", "green!60!black", "orange"]
for i, color in enumerate(colors):    fig.node(        (i * 2, 0),        shape="circle",        fill=color,        draw=color,        minimum_size="2cm",        fill_opacity=0.3,        draw_opacity=1.0,        line_width=2,    )
fig.show()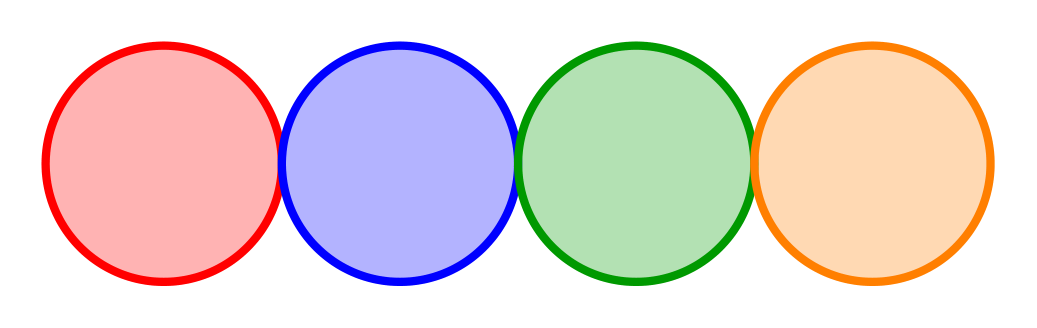
Show the TikZ code
% --------------------------------------------- %% Tikzfigure generated by tikzfigure v0.5.0 %% https://github.com/max-models/tikzfigure %% --------------------------------------------- %\begin{tikzpicture} \node[shape=circle, fill=red, draw=red, fill opacity=0.3, draw opacity=1.0, minimum size=2cm, line width=2] (node0) at ({0}, {0}) {}; \node[shape=circle, fill=blue, draw=blue, fill opacity=0.3, draw opacity=1.0, minimum size=2cm, line width=2] (node1) at ({2}, {0}) {}; \node[shape=circle, fill=green!60!black, draw=green!60!black, fill opacity=0.3, draw opacity=1.0, minimum size=2cm, line width=2] (node2) at ({4}, {0}) {}; \node[shape=circle, fill=orange, draw=orange, fill opacity=0.3, draw opacity=1.0, minimum size=2cm, line width=2] (node3) at ({6}, {0}) {};\end{tikzpicture}Show the standalone LaTeX document
\documentclass[border=10pt]{standalone}\PassOptionsToPackage{dvipsnames,svgnames,x11names}{xcolor}\usepackage{tikz}\usepackage{pgfplots}\pgfplotsset{compat=newest}\usepgfplotslibrary{groupplots}\usetikzlibrary{arrows.meta}\begin{document}% --------------------------------------------- %% Tikzfigure generated by tikzfigure v0.5.0     %% https://github.com/max-models/tikzfigure      %% --------------------------------------------- %\begin{tikzpicture}    \node[shape=circle, fill=red, draw=red, fill opacity=0.3, draw opacity=1.0, minimum size=2cm, line width=2] (node0) at ({0}, {0}) {};    \node[shape=circle, fill=blue, draw=blue, fill opacity=0.3, draw opacity=1.0, minimum size=2cm, line width=2] (node1) at ({2}, {0}) {};    \node[shape=circle, fill=green!60!black, draw=green!60!black, fill opacity=0.3, draw opacity=1.0, minimum size=2cm, line width=2] (node2) at ({4}, {0}) {};    \node[shape=circle, fill=orange, draw=orange, fill opacity=0.3, draw opacity=1.0, minimum size=2cm, line width=2] (node3) at ({6}, {0}) {};\end{tikzpicture}
\end{document}
opacity on paths
Section titled “opacity on paths”Paths support the same opacity parameter. Below, three filled triangles
overlap with decreasing opacity.
fig = TikzFigure()
triangles = [    ([(0, 0), (3, 0), (1.5, 2.5)], "red", 0.9),    ([(1, 0), (4, 0), (2.5, 2.5)], "blue", 0.7),    ([(2, 0), (5, 0), (3.5, 2.5)], "green!60!black", 0.5),]
for pts, color, op in triangles:    fig.draw(        pts,        cycle=True,        fill=color,        draw=color,        opacity=op,        line_width=1.5,    )
fig.show()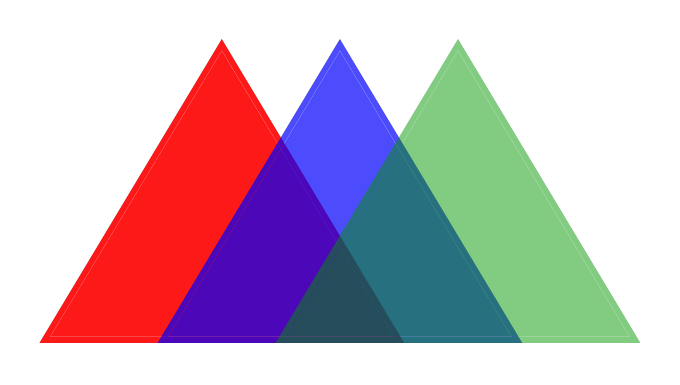
Show the TikZ code
% --------------------------------------------- %% Tikzfigure generated by tikzfigure v0.5.0 %% https://github.com/max-models/tikzfigure %% --------------------------------------------- %\begin{tikzpicture} \draw[fill=red, draw=red, opacity=0.9, line width=1.5] (0, 0) to (3, 0) to (1.5, 2.5) -- cycle; \draw[fill=blue, draw=blue, opacity=0.7, line width=1.5] (1, 0) to (4, 0) to (2.5, 2.5) -- cycle; \draw[fill=green!60!black, draw=green!60!black, opacity=0.5, line width=1.5] (2, 0) to (5, 0) to (3.5, 2.5) -- cycle;\end{tikzpicture}Show the standalone LaTeX document
\documentclass[border=10pt]{standalone}\PassOptionsToPackage{dvipsnames,svgnames,x11names}{xcolor}\usepackage{tikz}\usepackage{pgfplots}\pgfplotsset{compat=newest}\usepgfplotslibrary{groupplots}\usetikzlibrary{arrows.meta}\begin{document}% --------------------------------------------- %% Tikzfigure generated by tikzfigure v0.5.0     %% https://github.com/max-models/tikzfigure      %% --------------------------------------------- %\begin{tikzpicture}    \draw[fill=red, draw=red, opacity=0.9, line width=1.5] (0, 0) to (3, 0) to (1.5, 2.5) -- cycle;    \draw[fill=blue, draw=blue, opacity=0.7, line width=1.5] (1, 0) to (4, 0) to (2.5, 2.5) -- cycle;    \draw[fill=green!60!black, draw=green!60!black, opacity=0.5, line width=1.5] (2, 0) to (5, 0) to (3.5, 2.5) -- cycle;\end{tikzpicture}
\end{document}
fill_opacity on path fills
Section titled “fill_opacity on path fills”Use fill_opacity on a path to make the fill semi-transparent while keeping the
outline fully visible.
fig = TikzFigure()
import math
# A set of overlapping circles rendered as pathsfor i in range(4):    angle = i * math.pi / 2    cx = 2 + math.cos(angle) * 1.2    cy = 2 + math.sin(angle) * 1.2    theta = [2 * math.pi * k / 40 for k in range(40)]    pts = [(cx + math.cos(t), cy + math.sin(t)) for t in theta]    colors = ["red", "blue", "green!70!black", "orange"]    fig.draw(        pts,        cycle=True,        fill=colors[i],        draw=colors[i],        fill_opacity=0.35,        draw_opacity=1.0,        line_width=2,    )
fig.show()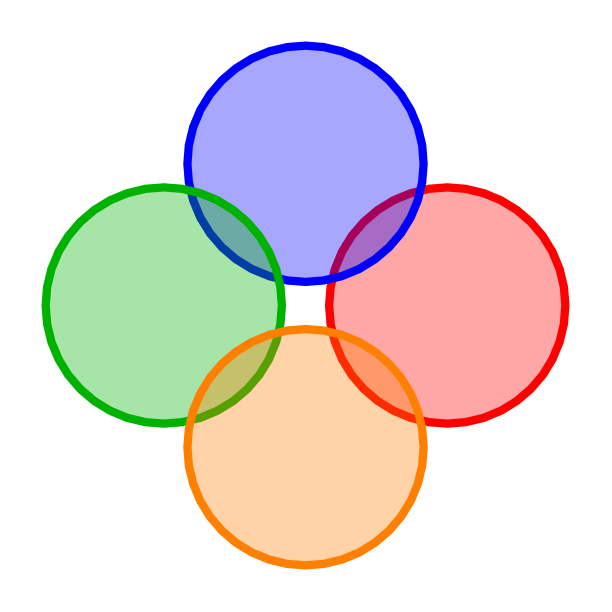
Show the TikZ code
% --------------------------------------------- %% Tikzfigure generated by tikzfigure v0.5.0 %% https://github.com/max-models/tikzfigure %% --------------------------------------------- %\begin{tikzpicture} \draw[fill=red, draw=red, draw opacity=1.0, fill opacity=0.35, line width=2] (4.2, 2.0) to (4.1876883405951375, 2.1564344650402307) to (4.151056516295154, 2.3090169943749475) to (4.091006524188368, 2.4539904997395467) to (4.009016994374948, 2.5877852522924734) to (3.9071067811865476, 2.7071067811865475) to (3.7877852522924735, 2.8090169943749475) to (3.653990499739547, 2.891006524188368) to (3.5090169943749476, 2.9510565162951536) to (3.356434465040231, 2.9876883405951378) to (3.2, 3.0) to (3.0435655349597694, 2.9876883405951378) to (2.8909830056250527, 2.9510565162951536) to (2.7460095002604534, 2.891006524188368) to (2.6122147477075273, 2.8090169943749475) to (2.4928932188134527, 2.7071067811865475) to (2.3909830056250527, 2.5877852522924734) to (2.3089934758116324, 2.4539904997395467) to (2.2489434837048465, 2.3090169943749475) to (2.2123116594048624, 2.156434465040231) to (2.2, 2.0) to (2.2123116594048624, 1.8435655349597693) to (2.2489434837048465, 1.690983005625053) to (2.3089934758116324, 1.5460095002604533) to (2.3909830056250527, 1.412214747707527) to (2.4928932188134523, 1.2928932188134525) to (2.612214747707527, 1.1909830056250525) to (2.7460095002604534, 1.1089934758116322) to (2.8909830056250527, 1.0489434837048464) to (3.043565534959769, 1.0123116594048622) to (3.2, 1.0) to (3.356434465040231, 1.0123116594048622) to (3.5090169943749476, 1.0489434837048464) to (3.653990499739547, 1.108993475811632) to (3.787785252292473, 1.1909830056250525) to (3.9071067811865476, 1.2928932188134523) to (4.009016994374948, 1.4122147477075266) to (4.0910065241883675, 1.546009500260453) to (4.151056516295154, 1.6909830056250523) to (4.1876883405951375, 1.8435655349597688) -- cycle; \draw[fill=blue, draw=blue, draw opacity=1.0, fill opacity=0.35, line width=2] (3.0, 3.2) to (2.9876883405951378, 3.356434465040231) to (2.9510565162951536, 3.5090169943749476) to (2.891006524188368, 3.653990499739547) to (2.8090169943749475, 3.7877852522924735) to (2.7071067811865475, 3.9071067811865476) to (2.5877852522924734, 4.009016994374948) to (2.4539904997395467, 4.0910065241883675) to... (122 lines skipped) ... to (0.7999999999999998, 1.0) to (0.9564344650402308, 1.0123116594048622) to (1.1090169943749473, 1.0489434837048464) to (1.2539904997395466, 1.108993475811632) to (1.387785252292473, 1.1909830056250525) to (1.5071067811865473, 1.2928932188134523) to (1.6090169943749473, 1.4122147477075266) to (1.6910065241883678, 1.546009500260453) to (1.7510565162951535, 1.6909830056250523) to (1.7876883405951376, 1.8435655349597688) -- cycle; \draw[fill=orange, draw=orange, draw opacity=1.0, fill opacity=0.35, line width=2] (3.0, 0.8) to (2.9876883405951373, 0.9564344650402309) to (2.951056516295153, 1.1090169943749475) to (2.891006524188368, 1.2539904997395468) to (2.8090169943749475, 1.3877852522924732) to (2.7071067811865475, 1.5071067811865475) to (2.587785252292473, 1.6090169943749475) to (2.4539904997395467, 1.6910065241883678) to (2.3090169943749475, 1.7510565162951535) to (2.1564344650402307, 1.7876883405951378) to (1.9999999999999998, 1.8) to (1.8435655349597693, 1.7876883405951378) to (1.6909830056250525, 1.7510565162951537) to (1.546009500260453, 1.691006524188368) to (1.4122147477075266, 1.6090169943749475) to (1.2928932188134523, 1.5071067811865477) to (1.1909830056250525, 1.3877852522924732) to (1.108993475811632, 1.253990499739547) to (1.0489434837048464, 1.1090169943749475) to (1.0123116594048622, 0.956434465040231) to (0.9999999999999998, 0.8000000000000002) to (1.012311659404862, 0.6435655349597693) to (1.048943483704846, 0.49098300562505315) to (1.1089934758116318, 0.34600950026045335) to (1.190983005625052, 0.21221474770752702) to (1.292893218813452, 0.09289321881345258) to (1.4122147477075266, -0.009016994374947296) to (1.5460095002604528, -0.09100652418836774) to (1.690983005625052, -0.1510565162951535) to (1.8435655349597688, -0.18768834059513761) to (1.9999999999999996, -0.19999999999999996) to (2.1564344650402303, -0.18768834059513773) to (2.309016994374947, -0.1510565162951536) to (2.4539904997395463, -0.09100652418836797) to (2.5877852522924725, -0.009016994374947518) to (2.707106781186547, 0.09289321881345236) to (2.809016994374947, 0.21221474770752669) to (2.8910065241883673, 0.3460095002604531) to (2.951056516295153, 0.4909830056250524) to (2.9876883405951373, 0.6435655349597689) -- cycle;\end{tikzpicture}Show the standalone LaTeX document
\documentclass[border=10pt]{standalone}\PassOptionsToPackage{dvipsnames,svgnames,x11names}{xcolor}\usepackage{tikz}\usepackage{pgfplots}\pgfplotsset{compat=newest}\usepgfplotslibrary{groupplots}\usetikzlibrary{arrows.meta}\begin{document}% --------------------------------------------- %% Tikzfigure generated by tikzfigure v0.5.0     %% https://github.com/max-models/tikzfigure      %% --------------------------------------------- %\begin{tikzpicture}    \draw[fill=red, draw=red, draw opacity=1.0, fill opacity=0.35, line width=2] (4.2, 2.0)        to        (4.1876883405951375, 2.1564344650402307)        to        (4.151056516295154, 2.3090169943749475)        to        (4.091006524188368, 2.4539904997395467)        to        (4.009016994374948, 2.5877852522924734)        to        (3.9071067811865476, 2.7071067811865475)        to        (3.7877852522924735, 2.8090169943749475)        to        (3.653990499739547, 2.891006524188368)        to        (3.5090169943749476, 2.9510565162951536)        to        (3.356434465040231, 2.9876883405951378)        to        (3.2, 3.0)        to        (3.0435655349597694, 2.9876883405951378)        to        (2.8909830056250527, 2.9510565162951536)        to        (2.7460095002604534, 2.891006524188368)        to        (2.6122147477075273, 2.8090169943749475)        to        (2.4928932188134527, 2.7071067811865475)        to        (2.3909830056250527, 2.5877852522924734)        to        (2.3089934758116324, 2.4539904997395467)        to        (2.2489434837048465, 2.3090169943749475)        to        (2.2123116594048624, 2.156434465040231)        to        (2.2, 2.0)        to        (2.2123116594048624, 1.8435655349597693)        to        (2.2489434837048465, 1.690983005625053)        to        (2.3089934758116324, 1.5460095002604533)        to        (2.3909830056250527, 1.412214747707527)        to        (2.4928932188134523, 1.2928932188134525)        to        (2.612214747707527, 1.1909830056250525)        to        (2.7460095002604534, 1.1089934758116322)        to        (2.8909830056250527, 1.0489434837048464)        to        (3.043565534959769, 1.0123116594048622)        to        (3.2, 1.0)        to        (3.356434465040231, 1.0123116594048622)        to        (3.5090169943749476, 1.0489434837048464)        to        (3.653990499739547, 1.108993475811632)        to        (3.787785252292473, 1.1909830056250525)        to        (3.9071067811865476, 1.2928932188134523)        to        (4.009016994374948, 1.4122147477075266)        to        (4.0910065241883675, 1.546009500260453)        to        (4.151056516295154, 1.6909830056250523)        to        (4.1876883405951375, 1.8435655349597688) -- cycle;    \draw[fill=blue, draw=blue, draw opacity=1.0, fill opacity=0.35, line width=2] (3.0, 3.2)        to        (2.9876883405951378, 3.356434465040231)        to        (2.9510565162951536, 3.5090169943749476)        to        (2.891006524188368, 3.653990499739547)        to... (132 lines skipped) ...        to        (0.9564344650402308, 1.0123116594048622)        to        (1.1090169943749473, 1.0489434837048464)        to        (1.2539904997395466, 1.108993475811632)        to        (1.387785252292473, 1.1909830056250525)        to        (1.5071067811865473, 1.2928932188134523)        to        (1.6090169943749473, 1.4122147477075266)        to        (1.6910065241883678, 1.546009500260453)        to        (1.7510565162951535, 1.6909830056250523)        to        (1.7876883405951376, 1.8435655349597688) -- cycle;    \draw[fill=orange, draw=orange, draw opacity=1.0, fill opacity=0.35, line width=2] (3.0, 0.8)        to        (2.9876883405951373, 0.9564344650402309)        to        (2.951056516295153, 1.1090169943749475)        to        (2.891006524188368, 1.2539904997395468)        to        (2.8090169943749475, 1.3877852522924732)        to        (2.7071067811865475, 1.5071067811865475)        to        (2.587785252292473, 1.6090169943749475)        to        (2.4539904997395467, 1.6910065241883678)        to        (2.3090169943749475, 1.7510565162951535)        to        (2.1564344650402307, 1.7876883405951378)        to        (1.9999999999999998, 1.8)        to        (1.8435655349597693, 1.7876883405951378)        to        (1.6909830056250525, 1.7510565162951537)        to        (1.546009500260453, 1.691006524188368)        to        (1.4122147477075266, 1.6090169943749475)        to        (1.2928932188134523, 1.5071067811865477)        to        (1.1909830056250525, 1.3877852522924732)        to        (1.108993475811632, 1.253990499739547)        to        (1.0489434837048464, 1.1090169943749475)        to        (1.0123116594048622, 0.956434465040231)        to        (0.9999999999999998, 0.8000000000000002)        to        (1.012311659404862, 0.6435655349597693)        to        (1.048943483704846, 0.49098300562505315)        to        (1.1089934758116318, 0.34600950026045335)        to        (1.190983005625052, 0.21221474770752702)        to        (1.292893218813452, 0.09289321881345258)        to        (1.4122147477075266, -0.009016994374947296)        to        (1.5460095002604528, -0.09100652418836774)        to        (1.690983005625052, -0.1510565162951535)        to        (1.8435655349597688, -0.18768834059513761)        to        (1.9999999999999996, -0.19999999999999996)        to        (2.1564344650402303, -0.18768834059513773)        to        (2.309016994374947, -0.1510565162951536)        to        (2.4539904997395463, -0.09100652418836797)        to        (2.5877852522924725, -0.009016994374947518)        to        (2.707106781186547, 0.09289321881345236)        to        (2.809016994374947, 0.21221474770752669)        to        (2.8910065241883673, 0.3460095002604531)        to        (2.951056516295153, 0.4909830056250524)        to        (2.9876883405951373, 0.6435655349597689) -- cycle;\end{tikzpicture}
\end{document}
Transparent vs white backgrounds
Section titled “Transparent vs white backgrounds”By default show() and savefig() produce a transparent PNG background
(transparent=True). This is ideal for embedding the figure in slides or
documents where the background color matters.
Passing transparent=False gives a white background — useful when the
rendering environment does not support transparency. Note that setting
transparent=False does not affect PDF output, which is always vector and
relies on the viewer for background rendering. It also does not affect the Tikz
code itself, which does not include any background rectangle by default.
fig = TikzFigure()
fig.node(    (0, 0),    shape="circle",    fill="orange!60",    content="Hello!",    minimum_size="2cm",)fig.node(    (3, 0),    shape="rectangle",    fill="teal!40",    content="World!",    minimum_width="2.5cm",    minimum_height="1.2cm",)
# Default: transparent PNG background (default transparent=True)fig.show()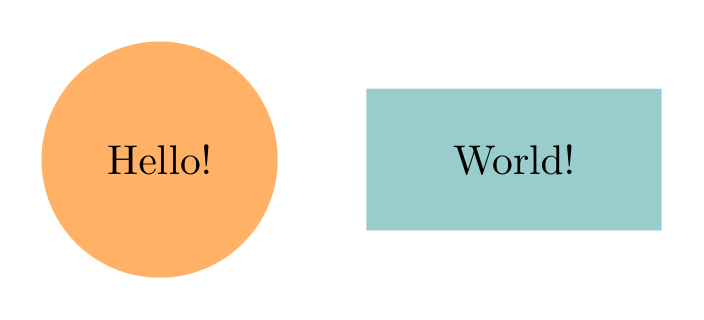
# White backgroundfig.show(transparent=False)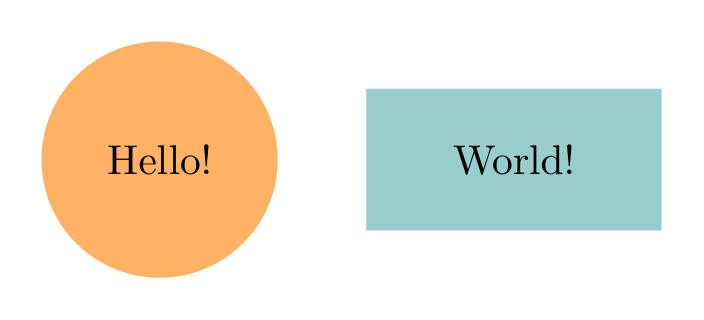
Show the TikZ code
% --------------------------------------------- %% Tikzfigure generated by tikzfigure v0.5.0 %% https://github.com/max-models/tikzfigure %% --------------------------------------------- %\begin{tikzpicture} \node[shape=circle, fill=orange!60, minimum size=2cm] (node0) at ({0}, {0}) {Hello!}; \node[shape=rectangle, fill=teal!40, minimum width=2.5cm, minimum height=1.2cm] (node1) at ({3}, {0}) {World!};\end{tikzpicture}Show the standalone LaTeX document
\documentclass[border=10pt]{standalone}\PassOptionsToPackage{dvipsnames,svgnames,x11names}{xcolor}\usepackage{tikz}\usepackage{pgfplots}\pgfplotsset{compat=newest}\usepgfplotslibrary{groupplots}\usetikzlibrary{arrows.meta}\begin{document}% --------------------------------------------- %% Tikzfigure generated by tikzfigure v0.5.0     %% https://github.com/max-models/tikzfigure      %% --------------------------------------------- %\begin{tikzpicture}    \node[shape=circle, fill=orange!60, minimum size=2cm] (node0) at ({0}, {0}) {Hello!};    \node[shape=rectangle, fill=teal!40, minimum width=2.5cm, minimum height=1.2cm] (node1) at ({3}, {0}) {World!};\end{tikzpicture}
\end{document}
# Saving examples (commented out — uncomment to run)# fig.savefig("figure_transparent.png") # transparent background (default)# fig.savefig("figure_white.png", transparent=False) # white backgroundThe transparent flag only affects PNG output. PDF output is always vector and
the background transparency is determined by the viewer.
Practical example: Venn diagram
Section titled “Practical example: Venn diagram”A classic Venn diagram uses fill_opacity so the overlapping region inherits
both colors visually.
import math
fig = TikzFigure()
R = 1.5  # circle radiusd = 1.2  # distance between centers
# Left circletheta = [2 * math.pi * k / 80 for k in range(80)]left = [(-d / 2 + R * math.cos(t), R * math.sin(t)) for t in theta]right = [(d / 2 + R * math.cos(t), R * math.sin(t)) for t in theta]
fig.draw(    left,    cycle=True,    fill="blue",    draw="blue!80",    fill_opacity=0.4,    line_width=2,)fig.draw(    right,    cycle=True,    fill="red",    draw="red!80",    fill_opacity=0.4,    line_width=2,)
# Labelsfig.node(    -d / 2 - 0.6,    0,    content="Set A",    draw="none",    font=r"\bfseries",    color="blue!80",)fig.node(    d / 2 + 0.6,    0,    content="Set B",    draw="none",    font=r"\bfseries",    color="red!80",)fig.node(    (0, 0),    content=r"$A \cap B$",    draw="none",    font=r"\small",)
fig.show()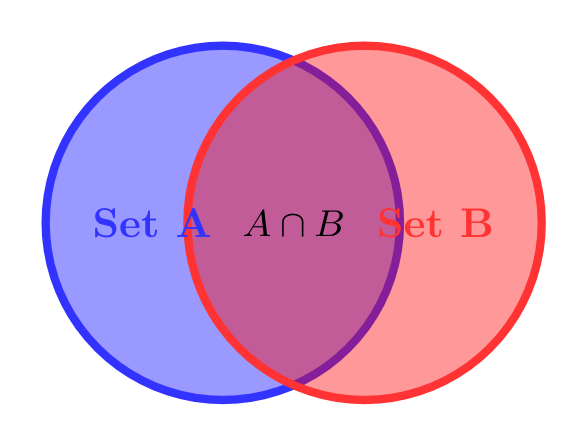
Show the TikZ code
% --------------------------------------------- %% Tikzfigure generated by tikzfigure v0.5.0 %% https://github.com/max-models/tikzfigure %% --------------------------------------------- %\begin{tikzpicture} \draw[fill=blue, draw=blue!80, fill opacity=0.4, line width=2] (0.9, 0.0) to (0.8953760005996919, 0.11768864359176742) to (0.8815325108927067, 0.23465169756034632) to (0.8585548805965147, 0.3501680457838581) to (0.8265847744427303, 0.46352549156242107) to (0.78581929876693, 0.5740251485476346) to (0.7365097862825519, 0.6809857496093201) to (0.6789602465311383, 0.7837478470739232) to (0.6135254915624212, 0.8816778784387097) to (0.5406089484000464, 0.9741720724952755) to (0.46066017177982144, 1.0606601717798212) to (0.3741720724952756, 1.1406089484000463) to (0.28167787843870973, 1.2135254915624212) to (0.18374784707392344, 1.2789602465311383) to (0.08098574960932026, 1.3365097862825517) to (-0.025974851452365222, 1.38581929876693) to (-0.1364745084375788, 1.4265847744427302) to (-0.2498319542161418, 1.4585548805965147) to (-0.3653483024396536, 1.4815325108927067) to (-0.48231135640823247, 1.495376000599692) to (-0.5999999999999999, 1.5) to (-0.7176886435917673, 1.495376000599692) to (-0.8346516975603459, 1.4815325108927067) to (-0.9501680457838579, 1.458554880596515) to (-1.063525491562421, 1.4265847744427305) to (-1.1740251485476345, 1.38581929876693) to (-1.28098574960932, 1.336509786282552) to (-1.383747847073923, 1.2789602465311385) to (-1.4816778784387097, 1.2135254915624212) to (-1.5741720724952755, 1.1406089484000466) to (-1.660660171779821, 1.0606601717798214) to (-1.7406089484000464, 0.9741720724952756) to (-1.8135254915624208, 0.8816778784387098) to (-1.8789602465311384, 0.7837478470739234) to (-1.9365097862825515, 0.6809857496093203) to (-1.98581929876693, 0.5740251485476349) to (-2.02658477444273, 0.4635254915624213) to (-2.058554880596515, 0.3501680457838583) to (-2.0815325108927065, 0.23465169756034648) to (-2.0953760005996918, 0.1176886435917676) to (-2.1, 1.8369701987210297e-16) to (-2.095376000599692, -0.11768864359176656) to (-2.0815325108927065, -0.2346516975603461) to (-2.058554880596515, -0.3501680457838579) to (-2.0265847744427306, -0.46352549156242034) to (-1.98581929876693, -0.5740251485476345) to (-1.936509786282552, -0.68098574960932) to (-1.878960246531138, -0.7837478470739236)... (127 lines skipped) ... to (-0.613525491562421, 0.8816778784387098) to (-0.6789602465311383, 0.7837478470739234) to (-0.7365097862825517, 0.6809857496093203) to (-0.78581929876693, 0.5740251485476349) to (-0.8265847744427303, 0.4635254915624213) to (-0.8585548805965147, 0.3501680457838583) to (-0.8815325108927065, 0.23465169756034648) to (-0.8953760005996919, 0.1176886435917676) to (-0.9, 1.8369701987210297e-16) to (-0.8953760005996921, -0.11768864359176656) to (-0.8815325108927067, -0.2346516975603461) to (-0.858554880596515, -0.3501680457838579) to (-0.8265847744427307, -0.46352549156242034) to (-0.7858192987669302, -0.5740251485476345) to (-0.7365097862825519, -0.68098574960932) to (-0.6789602465311381, -0.7837478470739236) to (-0.6135254915624214, -0.8816778784387096) to (-0.540608948400047, -0.9741720724952748) to (-0.46066017177982144, -1.0606601717798212) to (-0.3741720724952762, -1.140608948400046) to (-0.28167787843870984, -1.213525491562421) to (-0.1837478470739229, -1.2789602465311387) to (-0.08098574960932037, -1.3365097862825517) to (0.025974851452365777, -1.3858192987669302) to (0.13647450843757863, -1.4265847744427302) to (0.24983195421614096, -1.4585548805965147) to (0.36534830243965344, -1.4815325108927064) to (0.48231135640823164, -1.495376000599692) to (0.5999999999999998, -1.5) to (0.7176886435917678, -1.495376000599692) to (0.834651697560346, -1.4815325108927067) to (0.9501680457838585, -1.4585548805965147) to (1.0635254915624208, -1.4265847744427305) to (1.1740251485476336, -1.3858192987669304) to (1.2809857496093198, -1.336509786282552) to (1.3837478470739226, -1.2789602465311387) to (1.4816778784387092, -1.2135254915624214) to (1.574172072495276, -1.1406089484000463) to (1.660660171779821, -1.0606601717798214) to (1.7406089484000464, -0.9741720724952752) to (1.8135254915624208, -0.88167787843871) to (1.878960246531138, -0.7837478470739242) to (1.9365097862825515, -0.6809857496093205) to (1.9858192987669296, -0.5740251485476355) to (2.02658477444273, -0.4635254915624214) to (2.058554880596515, -0.3501680457838578) to (2.0815325108927065, -0.23465169756034668) to (2.0953760005996918, -0.11768864359176712) -- cycle; \node[color=blue!80, draw=none, font=\bfseries] (node0) at ({-1.2}, {0}) {Set A}; \node[color=red!80, draw=none, font=\bfseries] (node1) at ({1.2}, {0}) {Set B}; \node[draw=none, font=\small] (node2) at ({0}, {0}) {$A \cap B$};\end{tikzpicture}Show the standalone LaTeX document
\documentclass[border=10pt]{standalone}\PassOptionsToPackage{dvipsnames,svgnames,x11names}{xcolor}\usepackage{tikz}\usepackage{pgfplots}\pgfplotsset{compat=newest}\usepgfplotslibrary{groupplots}\usetikzlibrary{arrows.meta}\begin{document}% --------------------------------------------- %% Tikzfigure generated by tikzfigure v0.5.0     %% https://github.com/max-models/tikzfigure      %% --------------------------------------------- %\begin{tikzpicture}    \draw[fill=blue, draw=blue!80, fill opacity=0.4, line width=2] (0.9, 0.0)        to        (0.8953760005996919, 0.11768864359176742)        to        (0.8815325108927067, 0.23465169756034632)        to        (0.8585548805965147, 0.3501680457838581)        to        (0.8265847744427303, 0.46352549156242107)        to        (0.78581929876693, 0.5740251485476346)        to        (0.7365097862825519, 0.6809857496093201)        to        (0.6789602465311383, 0.7837478470739232)        to        (0.6135254915624212, 0.8816778784387097)        to        (0.5406089484000464, 0.9741720724952755)        to        (0.46066017177982144, 1.0606601717798212)        to        (0.3741720724952756, 1.1406089484000463)        to        (0.28167787843870973, 1.2135254915624212)        to        (0.18374784707392344, 1.2789602465311383)        to        (0.08098574960932026, 1.3365097862825517)        to        (-0.025974851452365222, 1.38581929876693)        to        (-0.1364745084375788, 1.4265847744427302)        to        (-0.2498319542161418, 1.4585548805965147)        to        (-0.3653483024396536, 1.4815325108927067)        to        (-0.48231135640823247, 1.495376000599692)        to        (-0.5999999999999999, 1.5)        to        (-0.7176886435917673, 1.495376000599692)        to        (-0.8346516975603459, 1.4815325108927067)        to        (-0.9501680457838579, 1.458554880596515)        to        (-1.063525491562421, 1.4265847744427305)        to        (-1.1740251485476345, 1.38581929876693)        to        (-1.28098574960932, 1.336509786282552)        to        (-1.383747847073923, 1.2789602465311385)        to        (-1.4816778784387097, 1.2135254915624212)        to        (-1.5741720724952755, 1.1406089484000466)        to        (-1.660660171779821, 1.0606601717798214)        to        (-1.7406089484000464, 0.9741720724952756)        to        (-1.8135254915624208, 0.8816778784387098)        to        (-1.8789602465311384, 0.7837478470739234)        to        (-1.9365097862825515, 0.6809857496093203)        to        (-1.98581929876693, 0.5740251485476349)        to        (-2.02658477444273, 0.4635254915624213)        to        (-2.058554880596515, 0.3501680457838583)        to        (-2.0815325108927065, 0.23465169756034648)        to        (-2.0953760005996918, 0.1176886435917676)        to        (-2.1, 1.8369701987210297e-16)        to        (-2.095376000599692, -0.11768864359176656)        to        (-2.0815325108927065, -0.2346516975603461)        to        (-2.058554880596515, -0.3501680457838579)... (137 lines skipped) ...        to        (-0.6789602465311383, 0.7837478470739234)        to        (-0.7365097862825517, 0.6809857496093203)        to        (-0.78581929876693, 0.5740251485476349)        to        (-0.8265847744427303, 0.4635254915624213)        to        (-0.8585548805965147, 0.3501680457838583)        to        (-0.8815325108927065, 0.23465169756034648)        to        (-0.8953760005996919, 0.1176886435917676)        to        (-0.9, 1.8369701987210297e-16)        to        (-0.8953760005996921, -0.11768864359176656)        to        (-0.8815325108927067, -0.2346516975603461)        to        (-0.858554880596515, -0.3501680457838579)        to        (-0.8265847744427307, -0.46352549156242034)        to        (-0.7858192987669302, -0.5740251485476345)        to        (-0.7365097862825519, -0.68098574960932)        to        (-0.6789602465311381, -0.7837478470739236)        to        (-0.6135254915624214, -0.8816778784387096)        to        (-0.540608948400047, -0.9741720724952748)        to        (-0.46066017177982144, -1.0606601717798212)        to        (-0.3741720724952762, -1.140608948400046)        to        (-0.28167787843870984, -1.213525491562421)        to        (-0.1837478470739229, -1.2789602465311387)        to        (-0.08098574960932037, -1.3365097862825517)        to        (0.025974851452365777, -1.3858192987669302)        to        (0.13647450843757863, -1.4265847744427302)        to        (0.24983195421614096, -1.4585548805965147)        to        (0.36534830243965344, -1.4815325108927064)        to        (0.48231135640823164, -1.495376000599692)        to        (0.5999999999999998, -1.5)        to        (0.7176886435917678, -1.495376000599692)        to        (0.834651697560346, -1.4815325108927067)        to        (0.9501680457838585, -1.4585548805965147)        to        (1.0635254915624208, -1.4265847744427305)        to        (1.1740251485476336, -1.3858192987669304)        to        (1.2809857496093198, -1.336509786282552)        to        (1.3837478470739226, -1.2789602465311387)        to        (1.4816778784387092, -1.2135254915624214)        to        (1.574172072495276, -1.1406089484000463)        to        (1.660660171779821, -1.0606601717798214)        to        (1.7406089484000464, -0.9741720724952752)        to        (1.8135254915624208, -0.88167787843871)        to        (1.878960246531138, -0.7837478470739242)        to        (1.9365097862825515, -0.6809857496093205)        to        (1.9858192987669296, -0.5740251485476355)        to        (2.02658477444273, -0.4635254915624214)        to        (2.058554880596515, -0.3501680457838578)        to        (2.0815325108927065, -0.23465169756034668)        to        (2.0953760005996918, -0.11768864359176712) -- cycle;    \node[color=blue!80, draw=none, font=\bfseries] (node0) at ({-1.2}, {0}) {Set A};    \node[color=red!80, draw=none, font=\bfseries] (node1) at ({1.2}, {0}) {Set B};    \node[draw=none, font=\small] (node2) at ({0}, {0}) {$A \cap B$};\end{tikzpicture}
\end{document}