Tokamak X-point
This tutorial builds on Mathematical Expressions and focuses on the plain TikZ plotting API by building up to a stylized tokamak X-point / separatrix drawing in a poloidal cross-section.
The goal is not to derive a full equilibrium solver inside TikZ. Instead, the point is to show how declared PGF functions, parametric expressions, and looped sampling can be combined to produce the kind of contour structure you see in an X-point divertor configuration.
Along the way we will use:
fig.plot(...)for a single sampled plotloop.plot(...)for families of curves- callable objects returned by
fig.declare_function(...) func(name, ...)when you still want the string-based interface
These plots are regular TikZ \draw ... plot(...) commands, not pgfplots axis
plots.
from tikzfigure import TikzFigure, colorsfrom tikzfigure.math import Var, cos, exp, ln, max, sin, sqrtA first sampled curve
Section titled “A first sampled curve”The simplest case is a regular function graph. Here fig.plot(...) samples a
single expression over a domain. This is the basic building block behind all of
the more complicated flux-surface-like contours later in the tutorial.
fig = TikzFigure(figsize=(8, 4))
x = Var("x")
fig.draw([(-2.4, 0), (2.4, 0)], color="gray")fig.draw([(0, -0.8), (0, 0.8)], color="gray")fig.plot(    sin(90 * x) / 2,    variable="x",    domain=(-2, 2),    samples=120,    smooth=True,    options=[colors.blue],)
fig.show()
/home/runner/work/tikzfigure/tikzfigure/.venv/lib/python3.12/site-packages/fitz/__init__.py:17: FutureWarning: The `fitz` API is deprecated and will be removed in future. Use `import pymupdf` instead. warnings.warn(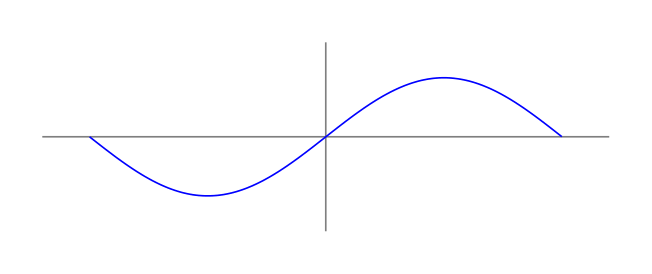
Show the TikZ code
% --------------------------------------------- %% Tikzfigure generated by tikzfigure v0.5.0 %% https://github.com/max-models/tikzfigure %% --------------------------------------------- %\begin{tikzpicture} \draw[color=gray] (-2.4, 0) to (2.4, 0); \draw[color=gray] (0, -0.8) to (0, 0.8); \draw[blue, smooth, variable=\x, domain=-2:2, samples=120] plot ({\x}, {(sin((90 * \x)) / 2)});\end{tikzpicture}Show the standalone LaTeX document
\documentclass[border=10pt]{standalone}\PassOptionsToPackage{dvipsnames,svgnames,x11names}{xcolor}\usepackage{tikz}\usepackage{pgfplots}\pgfplotsset{compat=newest}\usepgfplotslibrary{groupplots}\usetikzlibrary{arrows.meta}\begin{document}% --------------------------------------------- %% Tikzfigure generated by tikzfigure v0.5.0     %% https://github.com/max-models/tikzfigure      %% --------------------------------------------- %\begin{tikzpicture}    \draw[color=gray] (-2.4, 0) to (2.4, 0);    \draw[color=gray] (0, -0.8) to (0, 0.8);    \draw[blue, smooth, variable=\x, domain=-2:2, samples=120] plot ({\x}, {(sin((90 * \x)) / 2)});\end{tikzpicture}
\end{document}
When only one expression is passed, TikZ uses the sampling variable as the x-coordinate and the expression as the y-coordinate.
Declaring a custom shaping function
Section titled “Declaring a custom shaping function”You can declare helper functions once and reuse them in later plots. For this tutorial we will use a hyperbolic-tangent-like shaping function that will later help us bend contours into an X-point geometry.
fig = TikzFigure(figsize=(8, 4))
th = fig.declare_function(    "th",    "x",    (1 - exp(-2 * Var("x"))) / (1 + exp(-2 * Var("x"))),)
x = Var("x")
fig.draw([(-3.4, 0), (3.4, 0)], color="gray")fig.draw([(0, -1.1), (0, 1.1)], color="gray")fig.plot(    th(x),    variable="x",    domain=(-3, 3),    samples=150,    smooth=True,    options=[colors.Azure4],    line_width="0.8pt",)
fig.show()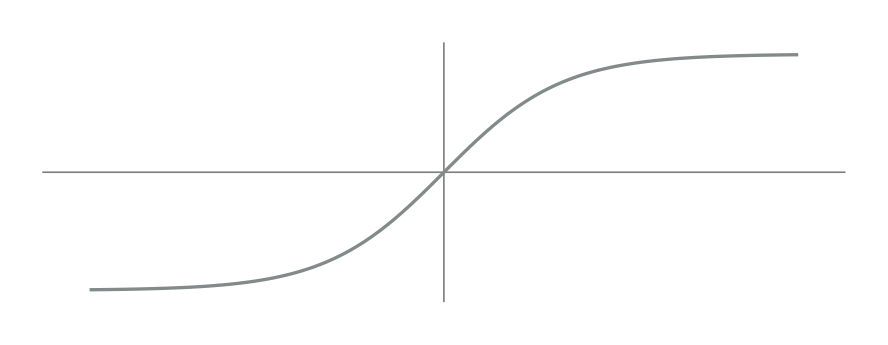
Show the TikZ code
% --------------------------------------------- %% Tikzfigure generated by tikzfigure v0.5.0 %% https://github.com/max-models/tikzfigure %% --------------------------------------------- %\begin{tikzpicture} \pgfkeys{/pgf/declare function={th(\x) = ((1 - exp((-2 * \x))) / (1 + exp((-2 * \x))));}} \draw[color=gray] (-3.4, 0) to (3.4, 0); \draw[color=gray] (0, -1.1) to (0, 1.1); \draw[Azure4, smooth, line width=0.8pt, variable=\x, domain=-3:3, samples=150] plot ({\x}, {th(\x)});\end{tikzpicture}Show the standalone LaTeX document
\documentclass[border=10pt]{standalone}\PassOptionsToPackage{dvipsnames,svgnames,x11names}{xcolor}\usepackage{tikz}\usepackage{pgfplots}\pgfplotsset{compat=newest}\usepgfplotslibrary{groupplots}\usetikzlibrary{arrows.meta}\begin{document}% --------------------------------------------- %% Tikzfigure generated by tikzfigure v0.5.0     %% https://github.com/max-models/tikzfigure      %% --------------------------------------------- %\begin{tikzpicture}    \pgfkeys{/pgf/declare function={th(\x) = ((1 - exp((-2 * \x))) / (1 + exp((-2 * \x))));}}    \draw[color=gray] (-3.4, 0) to (3.4, 0);    \draw[color=gray] (0, -1.1) to (0, 1.1);    \draw[Azure4, smooth, line width=0.8pt, variable=\x, domain=-3:3, samples=150] plot ({\x}, {th(\x)});\end{tikzpicture}
\end{document}
The object returned by fig.declare_function(...) is callable, so the most
natural way to use it is th(x). The older func("th", x) style still works
when you want it.
Your first closed flux-surface-like curve
Section titled “Your first closed flux-surface-like curve”If you pass both x and y expressions, the plot becomes parametric. This is
the key step from ordinary function graphs to closed magnetic-surface-like
contours.
fig = TikzFigure(figsize=(7, 7))
fig.variable("scale", 1.25)fig.variable("radius", 1.6)arcth = fig.declare_function(    "arcth",    "x",    0.5 * ln((1 + Var("x")) / (1 - Var("x"))),)th = fig.declare_function(    "th",    "x",    (1 - exp(-2 * Var("x"))) / (1 + exp(-2 * Var("x"))),)
theta = Var("theta")radius = Var("radius")
curve_x = Var("scale") * arcth(th(radius) * cos(theta))curve_y = Var("scale") * arcth(th(radius) * sin(theta))
fig.plot(    curve_x,    curve_y,    variable="theta",    domain=(0, 360),    samples=140,    smooth=True,    options=[colors.Azure4],)
fig.show()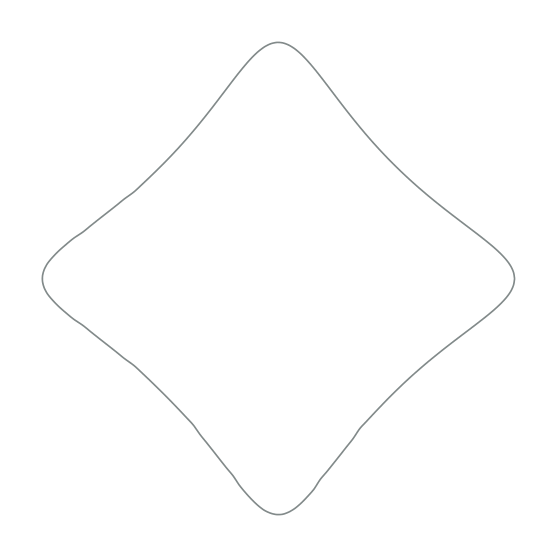
Show the TikZ code
% --------------------------------------------- %% Tikzfigure generated by tikzfigure v0.5.0 %% https://github.com/max-models/tikzfigure %% --------------------------------------------- %\begin{tikzpicture} \pgfmathsetmacro{\scale}{1.25} \pgfmathsetmacro{\radius}{1.6} \pgfkeys{/pgf/declare function={arcth(\x) = (0.5 * ln(((1 + \x) / (1 - \x))));}} \pgfkeys{/pgf/declare function={th(\x) = ((1 - exp((-2 * \x))) / (1 + exp((-2 * \x))));}} \draw[Azure4, smooth, variable=\theta, domain=0:360, samples=140] plot ({(\scale * arcth((th(\radius) * cos(\theta))))}, {(\scale * arcth((th(\radius) * sin(\theta))))});\end{tikzpicture}Show the standalone LaTeX document
\documentclass[border=10pt]{standalone}\PassOptionsToPackage{dvipsnames,svgnames,x11names}{xcolor}\usepackage{tikz}\usepackage{pgfplots}\pgfplotsset{compat=newest}\usepgfplotslibrary{groupplots}\usetikzlibrary{arrows.meta}\begin{document}% --------------------------------------------- %% Tikzfigure generated by tikzfigure v0.5.0     %% https://github.com/max-models/tikzfigure      %% --------------------------------------------- %\begin{tikzpicture}    \pgfmathsetmacro{\scale}{1.25}    \pgfmathsetmacro{\radius}{1.6}    \pgfkeys{/pgf/declare function={arcth(\x) = (0.5 * ln(((1 + \x) / (1 - \x))));}}    \pgfkeys{/pgf/declare function={th(\x) = ((1 - exp((-2 * \x))) / (1 + exp((-2 * \x))));}}    \draw[Azure4, smooth, variable=\theta, domain=0:360, samples=140] plot ({(\scale * arcth((th(\radius) * cos(\theta))))}, {(\scale * arcth((th(\radius) * sin(\theta))))});\end{tikzpicture}
\end{document}
Now the sampling variable is \theta, and both coordinates are computed from
it. You can think of \theta here as a poloidal-angle-like parameter tracing a
single closed contour.
Building a family of nested flux surfaces
Section titled “Building a family of nested flux surfaces”The same parametric expression becomes much more interesting when combined with
fig.loop(...).
fig = TikzFigure(figsize=(8, 8))
fig.variable("scale", 1.25)arcth = fig.declare_function(    "arcth",    "x",    0.5 * ln((1 + Var("x")) / (1 - Var("x"))),)th = fig.declare_function(    "th",    "x",    (1 - exp(-2 * Var("x"))) / (1 + exp(-2 * Var("x"))),)
theta = Var("theta")
with fig.loop("i", range(21)) as i:    radius = 0.2 * i    curve_x = Var("scale") * arcth(th(radius) * cos(theta))    curve_y = Var("scale") * arcth(th(radius) * sin(theta))    fig.plot(        curve_x,        curve_y,        variable="theta",        domain=(0, 360),        samples=100,        smooth=True,        options=[colors.Azure4],    )
fig.show()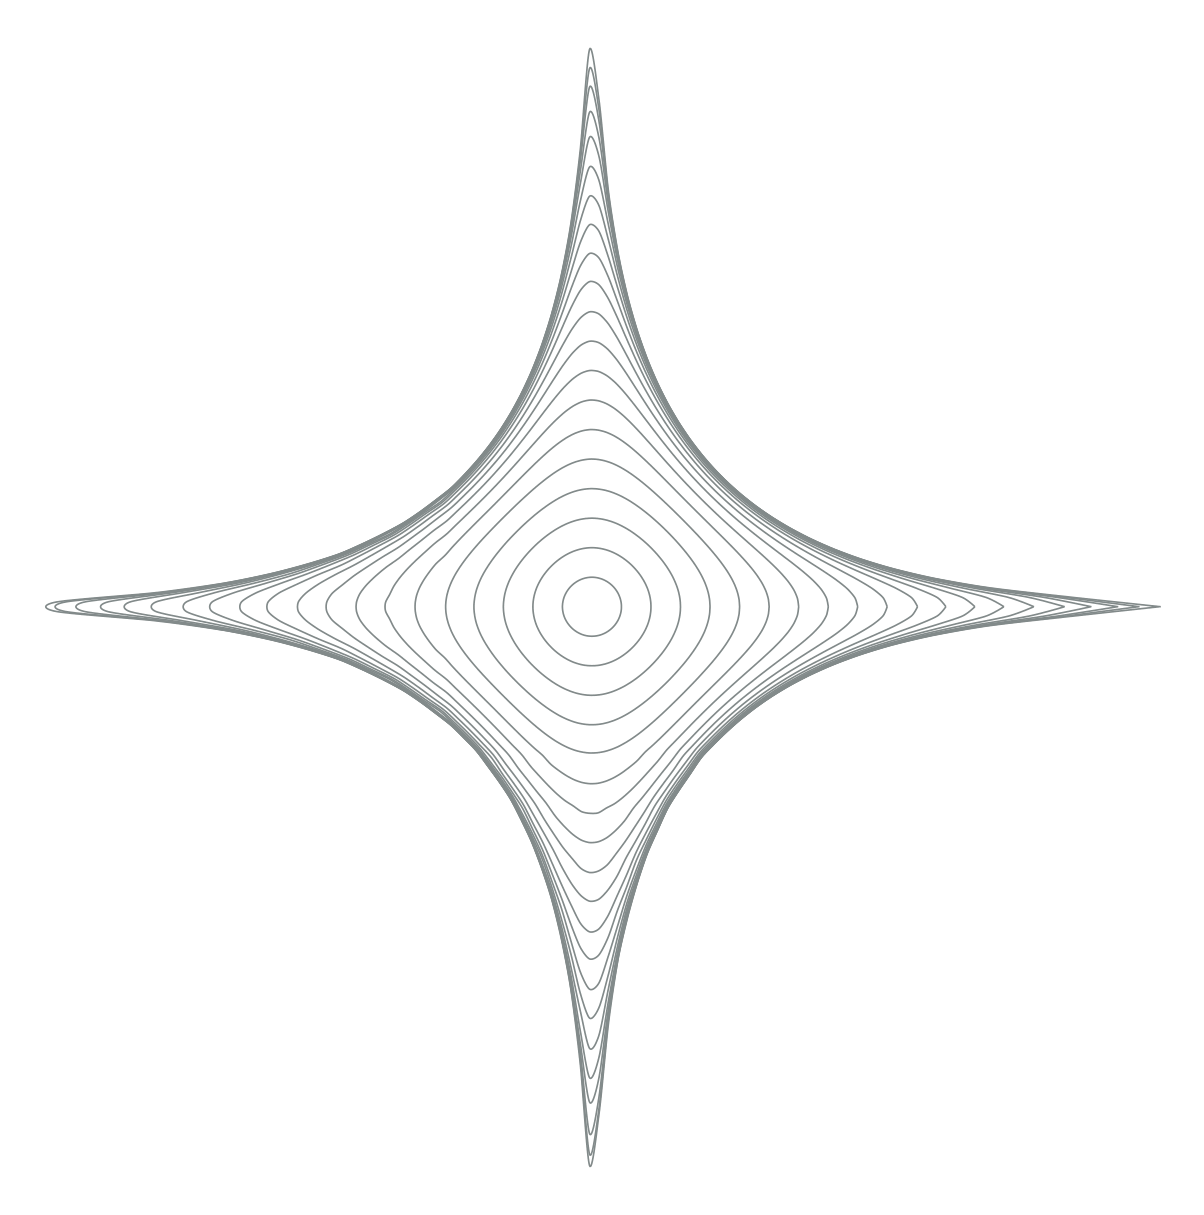
Show the TikZ code
% --------------------------------------------- %% Tikzfigure generated by tikzfigure v0.5.0 %% https://github.com/max-models/tikzfigure %% --------------------------------------------- %\begin{tikzpicture} \pgfmathsetmacro{\scale}{1.25} \pgfkeys{/pgf/declare function={arcth(\x) = (0.5 * ln(((1 + \x) / (1 - \x))));}} \pgfkeys{/pgf/declare function={th(\x) = ((1 - exp((-2 * \x))) / (1 + exp((-2 * \x))));}} \foreach \i in {0,1,...,20}{ \draw[Azure4, smooth, variable=\theta, domain=0:360, samples=100] plot ({(\scale * arcth((th((0.2 * \i)) * cos(\theta))))}, {(\scale * arcth((th((0.2 * \i)) * sin(\theta))))}); }\end{tikzpicture}Show the standalone LaTeX document
\documentclass[border=10pt]{standalone}\PassOptionsToPackage{dvipsnames,svgnames,x11names}{xcolor}\usepackage{tikz}\usepackage{pgfplots}\pgfplotsset{compat=newest}\usepgfplotslibrary{groupplots}\usetikzlibrary{arrows.meta}\begin{document}% --------------------------------------------- %% Tikzfigure generated by tikzfigure v0.5.0     %% https://github.com/max-models/tikzfigure      %% --------------------------------------------- %\begin{tikzpicture}    \pgfmathsetmacro{\scale}{1.25}    \pgfkeys{/pgf/declare function={arcth(\x) = (0.5 * ln(((1 + \x) / (1 - \x))));}}    \pgfkeys{/pgf/declare function={th(\x) = ((1 - exp((-2 * \x))) / (1 + exp((-2 * \x))));}}    \foreach \i in {0,1,...,20}{        \draw[Azure4, smooth, variable=\theta, domain=0:360, samples=100] plot ({(\scale * arcth((th((0.2 * \i)) * cos(\theta))))}, {(\scale * arcth((th((0.2 * \i)) * sin(\theta))))});    }\end{tikzpicture}
\end{document}
Each loop iteration gives TikZ a different integer value of \i. Because the
context variable i now behaves like that TikZ variable directly, you can
derive the physical radius inside the block with radius = 0.2 * i and then use
the ordinary fig.plot(...) API inside the loop body. That keeps the loop
compact while still producing a whole family of nested contours. In the tokamak
picture, these read naturally as flux surfaces moving outward from the core.
Adding the crossing family near the X-point
Section titled “Adding the crossing family near the X-point”Next, add the second family by keeping \theta fixed and varying \r. Once
both families are drawn, the contour structure starts to look like the crossing
geometry around an X-point.
fig = TikzFigure(figsize=(8, 8))
fig.variable("scale", 1.25)arcth = fig.declare_function(    "arcth",    "x",    0.5 * ln((1 + Var("x")) / (1 - Var("x"))),)th = fig.declare_function(    "th",    "x",    (1 - exp(-2 * Var("x"))) / (1 + exp(-2 * Var("x"))),)
theta = Var("theta")
with fig.loop("i", range(21)) as i:    radius = 0.2 * i    curve_x_loop = Var("scale") * arcth(th(radius) * cos(theta))    curve_y_loop = Var("scale") * arcth(th(radius) * sin(theta))    fig.plot(        curve_x_loop,        curve_y_loop,        variable="theta",        domain=(0, 360),        samples=100,        smooth=True,        options=[colors.Azure4],    )
with fig.loop("theta", range(0, 361, 9)) as theta:    r = Var("r")    curve_x_cross = Var("scale") * arcth(th(r) * cos(theta))    curve_y_cross = Var("scale") * arcth(th(r) * sin(theta))    fig.plot(        curve_x_cross,        curve_y_cross,        variable="r",        domain=(0, 4),        samples=15,        smooth=True,        options=[colors.Azure4],    )
fig.show()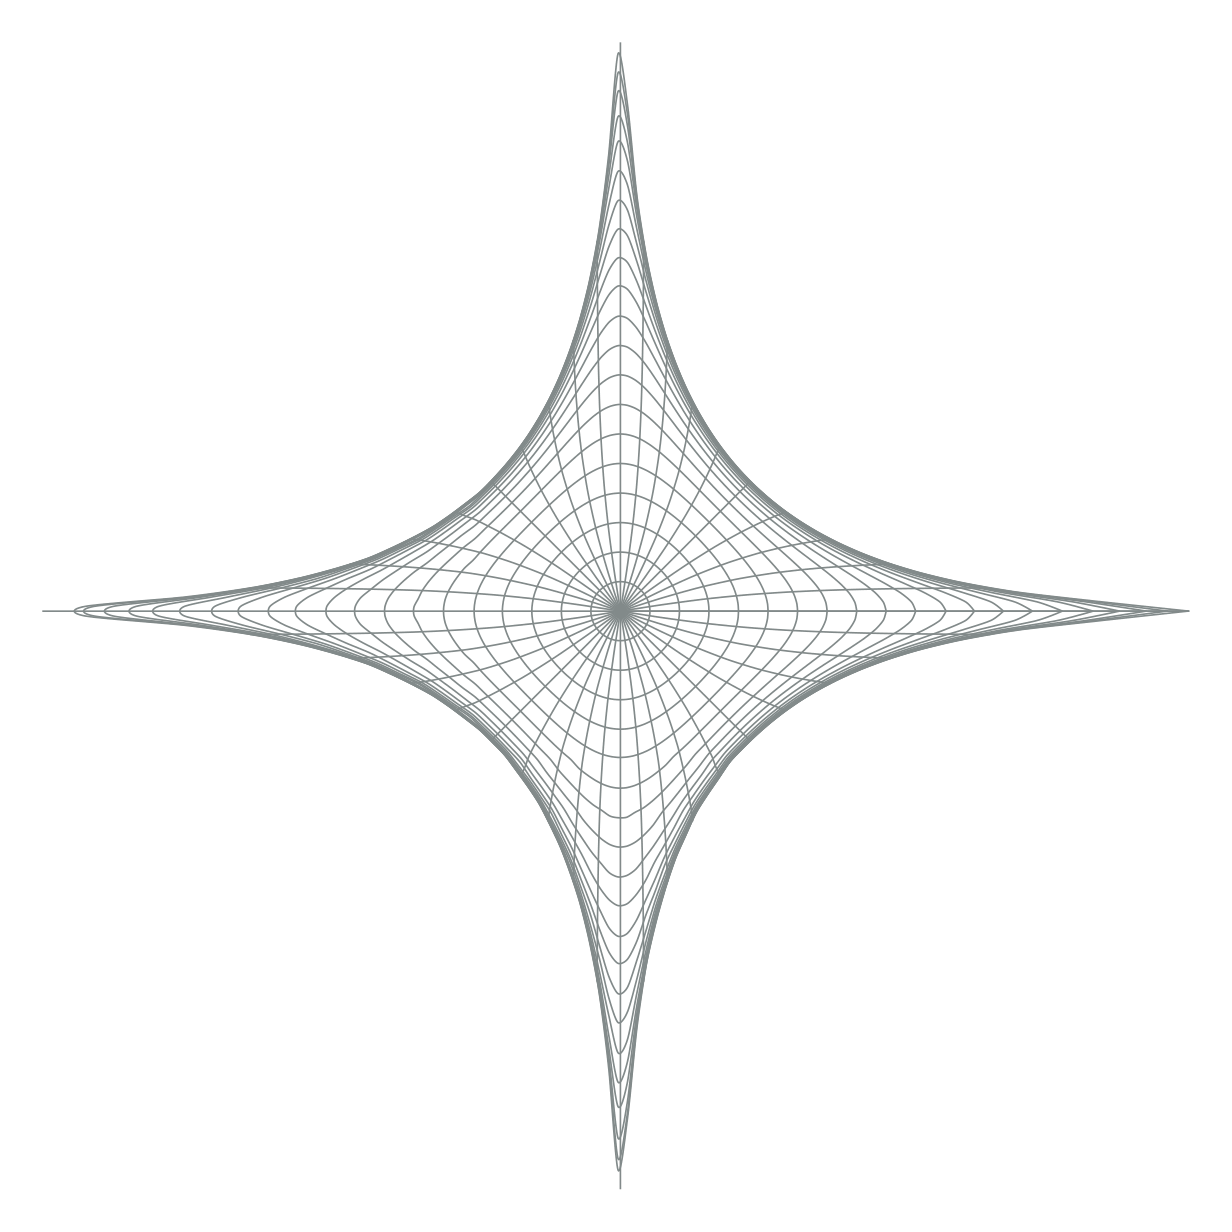
Show the TikZ code
% --------------------------------------------- %% Tikzfigure generated by tikzfigure v0.5.0 %% https://github.com/max-models/tikzfigure %% --------------------------------------------- %\begin{tikzpicture} \pgfmathsetmacro{\scale}{1.25} \pgfkeys{/pgf/declare function={arcth(\x) = (0.5 * ln(((1 + \x) / (1 - \x))));}} \pgfkeys{/pgf/declare function={th(\x) = ((1 - exp((-2 * \x))) / (1 + exp((-2 * \x))));}} \foreach \i in {0,1,...,20}{ \draw[Azure4, smooth, variable=\theta, domain=0:360, samples=100] plot ({(\scale * arcth((th((0.2 * \i)) * cos(\theta))))}, {(\scale * arcth((th((0.2 * \i)) * sin(\theta))))}); } \foreach \theta in {0,9,...,360}{ \draw[Azure4, smooth, variable=\r, domain=0:4, samples=15] plot ({(\scale * arcth((th(\r) * cos(\theta))))}, {(\scale * arcth((th(\r) * sin(\theta))))}); }\end{tikzpicture}Show the standalone LaTeX document
\documentclass[border=10pt]{standalone}\PassOptionsToPackage{dvipsnames,svgnames,x11names}{xcolor}\usepackage{tikz}\usepackage{pgfplots}\pgfplotsset{compat=newest}\usepgfplotslibrary{groupplots}\usetikzlibrary{arrows.meta}\begin{document}% --------------------------------------------- %% Tikzfigure generated by tikzfigure v0.5.0     %% https://github.com/max-models/tikzfigure      %% --------------------------------------------- %\begin{tikzpicture}    \pgfmathsetmacro{\scale}{1.25}    \pgfkeys{/pgf/declare function={arcth(\x) = (0.5 * ln(((1 + \x) / (1 - \x))));}}    \pgfkeys{/pgf/declare function={th(\x) = ((1 - exp((-2 * \x))) / (1 + exp((-2 * \x))));}}    \foreach \i in {0,1,...,20}{        \draw[Azure4, smooth, variable=\theta, domain=0:360, samples=100] plot ({(\scale * arcth((th((0.2 * \i)) * cos(\theta))))}, {(\scale * arcth((th((0.2 * \i)) * sin(\theta))))});    }    \foreach \theta in {0,9,...,360}{        \draw[Azure4, smooth, variable=\r, domain=0:4, samples=15] plot ({(\scale * arcth((th(\r) * cos(\theta))))}, {(\scale * arcth((th(\r) * sin(\theta))))});    }\end{tikzpicture}
\end{document}
The full X-point / separatrix sketch
Section titled “The full X-point / separatrix sketch”Now add a second pass with thicker red guide curves to highlight a few selected surfaces and the separatrix-like branches.
fig = TikzFigure(figsize=(9, 9))
fig.variable("scale", 1.25)arcth = fig.declare_function(    "arcth",    "x",    0.5 * ln((1 + Var("x")) / (1 - Var("x"))),)th = fig.declare_function(    "th",    "x",    (1 - exp(-2 * Var("x"))) / (1 + exp(-2 * Var("x"))),)
theta = Var("theta")
fine_radii = range(21)major_radii = range(5, 21, 5)fine_angles = range(0, 361, 9)major_angles = range(0, 360, 30)
with fig.loop("i", fine_radii) as i:    radius = 0.2 * i    curve_x_loop = Var("scale") * arcth(th(radius) * cos(theta))    curve_y_loop = Var("scale") * arcth(th(radius) * sin(theta))    fig.plot(        curve_x_loop,        curve_y_loop,        variable="theta",        domain=(0, 360),        samples=100,        smooth=True,        options=[colors.Azure4],    )
with fig.loop("theta", fine_angles) as theta:    r = Var("r")    curve_x_cross = Var("scale") * arcth(th(r) * cos(theta))    curve_y_cross = Var("scale") * arcth(th(r) * sin(theta))    fig.plot(        curve_x_cross,        curve_y_cross,        variable="r",        domain=(0, 4),        samples=15,        smooth=True,        options=[colors.Azure4],    )
with fig.loop("i", major_radii) as i:    radius = 0.2 * i    curve_x_loop = Var("scale") * arcth(th(radius) * cos(theta))    curve_y_loop = Var("scale") * arcth(th(radius) * sin(theta))    fig.plot(        curve_x_loop,        curve_y_loop,        variable="theta",        domain=(0, 360),        samples=120,        smooth=True,        options=[colors.Red3],        line_width="0.9pt",    )
with fig.loop("theta", major_angles) as theta:    r = Var("r")    curve_x_cross = Var("scale") * arcth(th(r) * cos(theta))    curve_y_cross = Var("scale") * arcth(th(r) * sin(theta))    fig.plot(        curve_x_cross,        curve_y_cross,        variable="r",        domain=(0, 4),        samples=25,        smooth=True,        options=[colors.Red3],        line_width="0.9pt",    )
fig.show()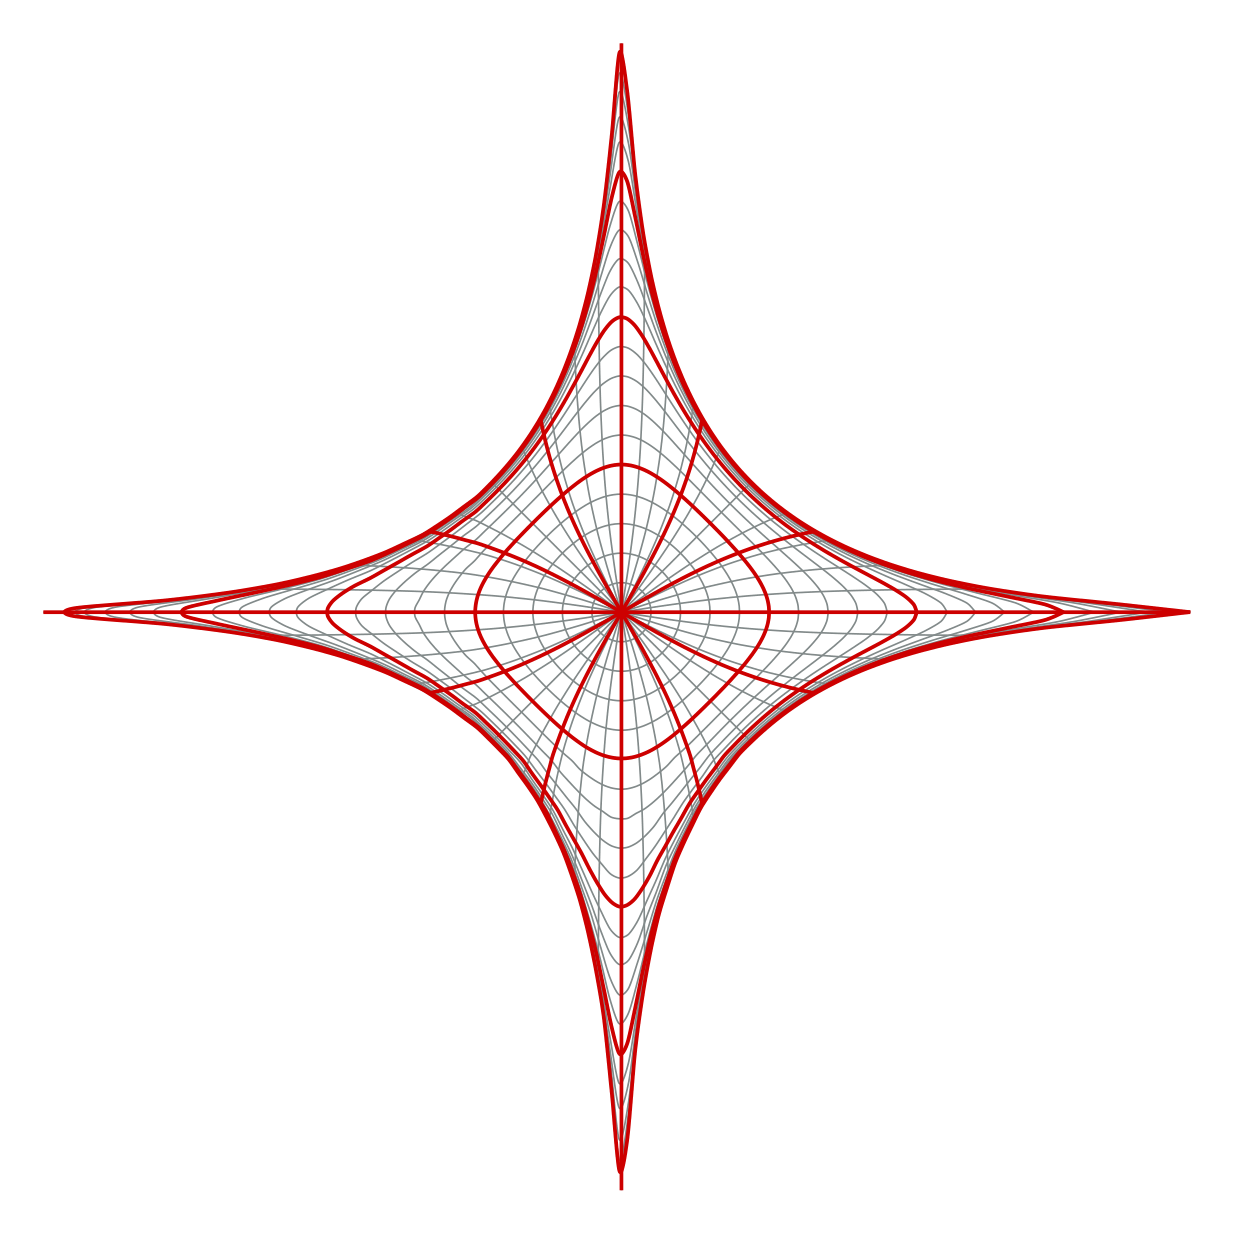
Show the TikZ code
% --------------------------------------------- %% Tikzfigure generated by tikzfigure v0.5.0 %% https://github.com/max-models/tikzfigure %% --------------------------------------------- %\begin{tikzpicture} \pgfmathsetmacro{\scale}{1.25} \pgfkeys{/pgf/declare function={arcth(\x) = (0.5 * ln(((1 + \x) / (1 - \x))));}} \pgfkeys{/pgf/declare function={th(\x) = ((1 - exp((-2 * \x))) / (1 + exp((-2 * \x))));}} \foreach \i in {0,1,...,20}{ \draw[Azure4, smooth, variable=\theta, domain=0:360, samples=100] plot ({(\scale * arcth((th((0.2 * \i)) * cos(\theta))))}, {(\scale * arcth((th((0.2 * \i)) * sin(\theta))))}); } \foreach \theta in {0,9,...,360}{ \draw[Azure4, smooth, variable=\r, domain=0:4, samples=15] plot ({(\scale * arcth((th(\r) * cos(\theta))))}, {(\scale * arcth((th(\r) * sin(\theta))))}); } \foreach \i in {5,10,...,20}{ \draw[Red3, smooth, line width=0.9pt, variable=\theta, domain=0:360, samples=120] plot ({(\scale * arcth((th((0.2 * \i)) * cos(\theta))))}, {(\scale * arcth((th((0.2 * \i)) * sin(\theta))))}); } \foreach \theta in {0,30,...,330}{ \draw[Red3, smooth, line width=0.9pt, variable=\r, domain=0:4, samples=25] plot ({(\scale * arcth((th(\r) * cos(\theta))))}, {(\scale * arcth((th(\r) * sin(\theta))))}); }\end{tikzpicture}Show the standalone LaTeX document
\documentclass[border=10pt]{standalone}\PassOptionsToPackage{dvipsnames,svgnames,x11names}{xcolor}\usepackage{tikz}\usepackage{pgfplots}\pgfplotsset{compat=newest}\usepgfplotslibrary{groupplots}\usetikzlibrary{arrows.meta}\begin{document}% --------------------------------------------- %% Tikzfigure generated by tikzfigure v0.5.0     %% https://github.com/max-models/tikzfigure      %% --------------------------------------------- %\begin{tikzpicture}    \pgfmathsetmacro{\scale}{1.25}    \pgfkeys{/pgf/declare function={arcth(\x) = (0.5 * ln(((1 + \x) / (1 - \x))));}}    \pgfkeys{/pgf/declare function={th(\x) = ((1 - exp((-2 * \x))) / (1 + exp((-2 * \x))));}}    \foreach \i in {0,1,...,20}{        \draw[Azure4, smooth, variable=\theta, domain=0:360, samples=100] plot ({(\scale * arcth((th((0.2 * \i)) * cos(\theta))))}, {(\scale * arcth((th((0.2 * \i)) * sin(\theta))))});    }    \foreach \theta in {0,9,...,360}{        \draw[Azure4, smooth, variable=\r, domain=0:4, samples=15] plot ({(\scale * arcth((th(\r) * cos(\theta))))}, {(\scale * arcth((th(\r) * sin(\theta))))});    }    \foreach \i in {5,10,...,20}{        \draw[Red3, smooth, line width=0.9pt, variable=\theta, domain=0:360, samples=120] plot ({(\scale * arcth((th((0.2 * \i)) * cos(\theta))))}, {(\scale * arcth((th((0.2 * \i)) * sin(\theta))))});    }    \foreach \theta in {0,30,...,330}{        \draw[Red3, smooth, line width=0.9pt, variable=\r, domain=0:4, samples=25] plot ({(\scale * arcth((th(\r) * cos(\theta))))}, {(\scale * arcth((th(\r) * sin(\theta))))});    }\end{tikzpicture}
\end{document}
This final figure uses the exact same ingredients as the earlier steps: declared functions, composable expressions, sampled plots, and loops. The result is a stylized tokamak X-point drawing with a separatrix-like structure, built entirely from plain TikZ plots.
A flux-surface-aligned curvilinear mesh
Section titled “A flux-surface-aligned curvilinear mesh”The same API can also draw a mesh aligned to an X-point map. The next example
adds the patch layout with native filldraw and grid calls, then uses
parametric_grid(...) to draw both coordinate families of the mapped mesh.
def add_eight_patch_background(fig, radius=6, color="Azure4"):    patches = [        [(0, 0), (radius, 0), (radius, radius), (0, radius)],        [(0, 0), (-radius, 0), (-radius, radius), (0, radius)],        [(0, 0), (radius, 0), (radius, -radius), (0, -radius)],        [(0, 0), (-radius, 0), (-radius, -radius), (0, -radius)],        [(radius, 0), (2 * radius, 0), (2 * radius, radius), (radius, radius)],        [(-2 * radius, 0), (-radius, 0), (-radius, radius), (-2 * radius, radius)],        [(0, radius), (radius, radius), (radius, 2 * radius), (0, 2 * radius)],        [(0, -2 * radius), (radius, -2 * radius), (radius, -radius), (0, -radius)],    ]    for patch in patches:        fig.filldraw(            patch,            cycle=True,            fill=color,            fill_opacity=0.06,            draw=color,            draw_opacity=0.35,            line_width="0.4pt",        )

fig = TikzFigure(figsize=(8, 8))add_eight_patch_background(fig)fig.grid((-6, -6), (6, 6), step="1", color=colors.Azure4, opacity=0.25)
<tikzfigure.core.grid.Grid at 0x7fdc6c4e5310>The square-root map and the smooth blending function are declared once as PGF
functions. Var keeps the expressions symbolic until TikZ samples the plots.
arg_eta = Var("argEta")arg_xi = Var("argXi")x_mesh = Var("sampleParam")x_mesh_two = Var("sampleParamTwo")u_max = 6v_max = 6
map_x = fig.function(    "map_x", ("x", "y"), sqrt(max(0, sqrt(Var("x") ** 2 + Var("y") ** 2) - Var("x"))))map_y = fig.function(    "map_y", ("x", "y"), sqrt(max(0, sqrt(Var("x") ** 2 + Var("y") ** 2) + Var("x"))))mapped_x = lambda a, b: sqrt(max(0, sqrt(a**2 + b**2) - a))mapped_y = lambda a, b: sqrt(max(0, sqrt(a**2 + b**2) + a))fig.function("smoothstep", "x", r"6*\x^5 - 15*\x^4 + 10*\x^3")fig.function(    "blend",    "x",    r"ifthenelse(\x < 0, 0, ifthenelse(\x > 1, 1, smoothstep(\x)))",)fig.function("q", "x", r"blend(2*(\x - 0.4))")
<tikzfigure.core.declared_function.DeclaredFunction at 0x7fdc6c5085f0>parametric_grid emits one loop for fixed parameter values and one for the
other parameter family. The outer sign loops reuse the first-quadrant map in
all four sectors; the second call draws its coordinate-swapped counterpart.
u_values = [i / 6 for i in range(7)]v_values = [i / 6 for i in range(7)]arg_eta_two = Var("argEtaTwo")
fig.parametric_grid(    mapped_x(arg_eta, x_mesh),    mapped_y(arg_eta, x_mesh),    u_variable="argEta",    v_variable="sampleParam",    u_values=u_values,    v_values=v_values,    samples=18,    smooth=True,    options=[colors.Azure4],    line_width="0.7pt",)fig.parametric_grid(    mapped_y(arg_eta_two, x_mesh_two),    mapped_x(arg_eta_two, x_mesh_two),    u_variable="argEtaTwo",    v_variable="sampleParamTwo",    u_values=u_values,    v_values=v_values,    samples=18,    smooth=True,    options=[colors.Azure4],    line_width="0.7pt",)
fig.node((-2, 0.5), content=r"$\times$", text=colors.black)fig.node((-2, 0.0), content=r"$\bullet$", text=colors.Orange1)fig.show()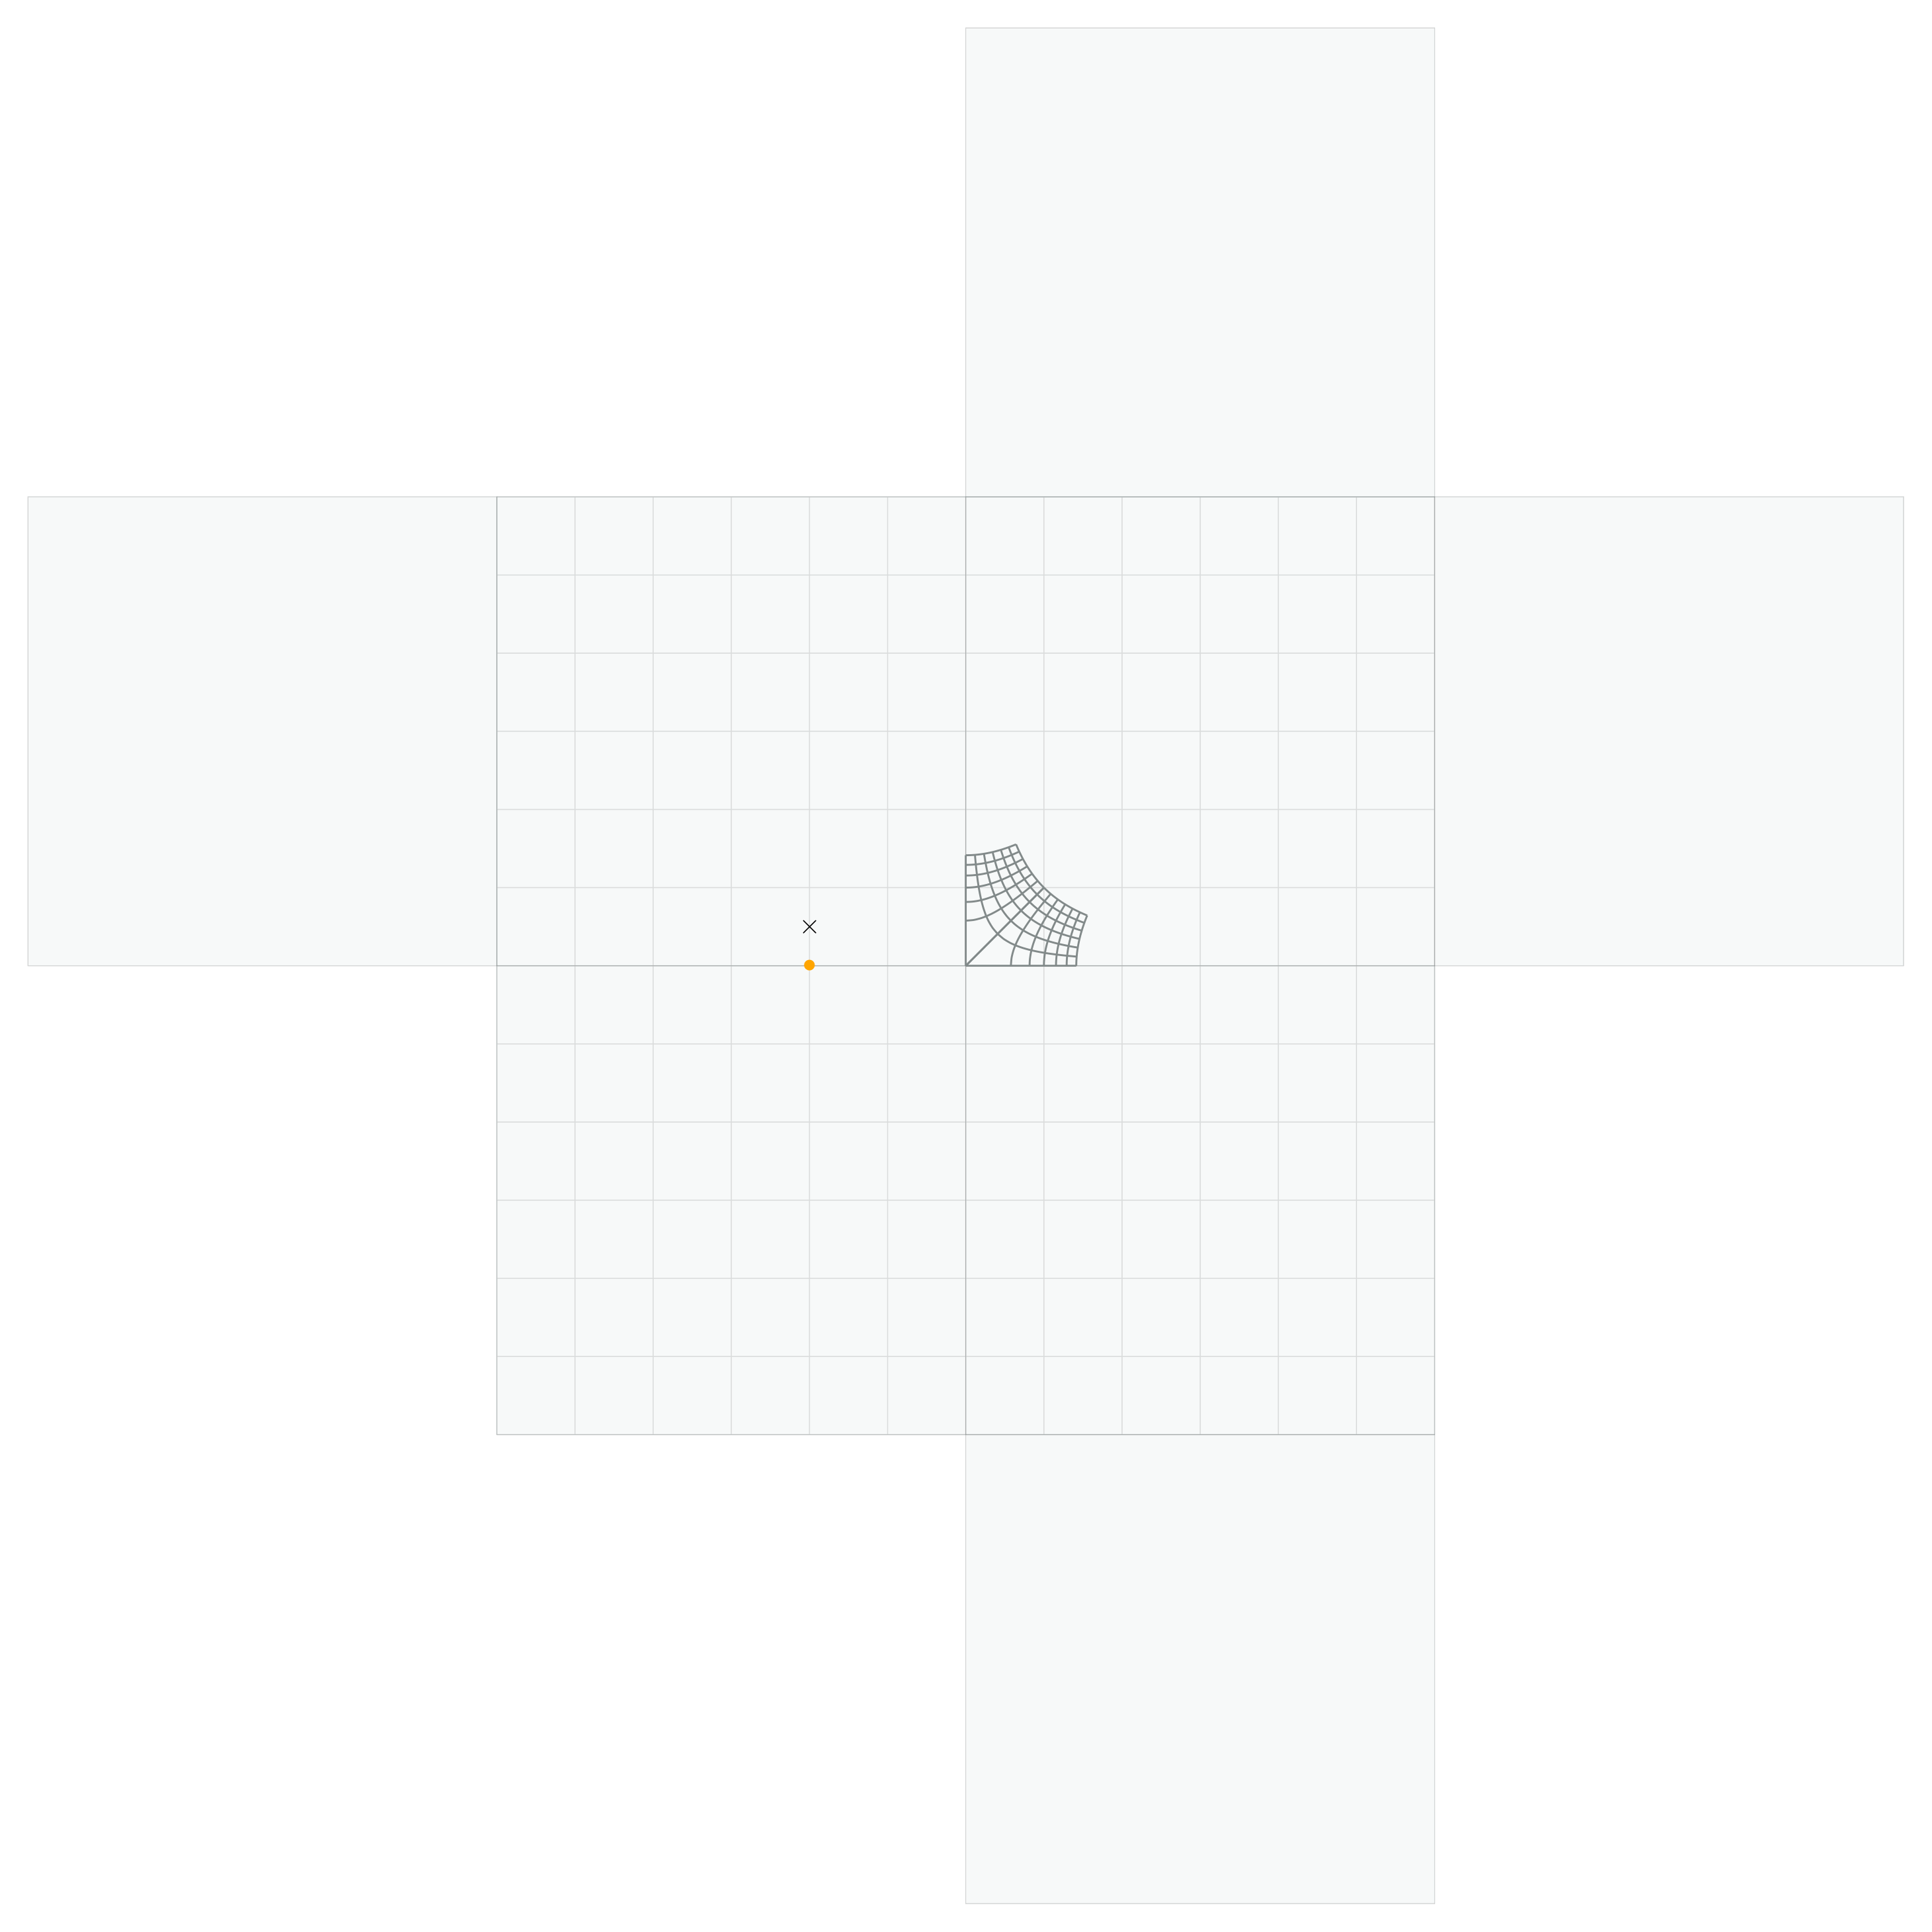
Show the TikZ code
% --------------------------------------------- %% Tikzfigure generated by tikzfigure v0.5.0 %% https://github.com/max-models/tikzfigure %% --------------------------------------------- %\begin{tikzpicture} \pgfkeys{/pgf/declare function={map_x(\x, \y) = sqrt(max(0, (sqrt(((\x^2) + (\y^2))) - \x)));}} \pgfkeys{/pgf/declare function={map_y(\x, \y) = sqrt(max(0, (sqrt(((\x^2) + (\y^2))) + \x)));}} \pgfkeys{/pgf/declare function={smoothstep(\x) = 6*\x^5 - 15*\x^4 + 10*\x^3;}} \pgfkeys{/pgf/declare function={blend(\x) = ifthenelse(\x < 0, 0, ifthenelse(\x > 1, 1, smoothstep(\x)));}} \pgfkeys{/pgf/declare function={q(\x) = blend(2*(\x - 0.4));}} \filldraw[fill=Azure4, draw=Azure4, draw opacity=0.35, fill opacity=0.06, line width=0.4pt] (0, 0) to (6, 0) to (6, 6) to (0, 6) -- cycle; \filldraw[fill=Azure4, draw=Azure4, draw opacity=0.35, fill opacity=0.06, line width=0.4pt] (0, 0) to (-6, 0) to (-6, 6) to (0, 6) -- cycle; \filldraw[fill=Azure4, draw=Azure4, draw opacity=0.35, fill opacity=0.06, line width=0.4pt] (0, 0) to (6, 0) to (6, -6) to (0, -6) -- cycle; \filldraw[fill=Azure4, draw=Azure4, draw opacity=0.35, fill opacity=0.06, line width=0.4pt] (0, 0) to (-6, 0) to (-6, -6) to (0, -6) -- cycle; \filldraw[fill=Azure4, draw=Azure4, draw opacity=0.35, fill opacity=0.06, line width=0.4pt] (6, 0) to (12, 0) to (12, 6) to (6, 6) -- cycle; \filldraw[fill=Azure4, draw=Azure4, draw opacity=0.35, fill opacity=0.06, line width=0.4pt] (-12, 0) to (-6, 0) to (-6, 6) to (-12, 6) -- cycle; \filldraw[fill=Azure4, draw=Azure4, draw opacity=0.35, fill opacity=0.06, line width=0.4pt] (0, 6) to (6, 6) to (6, 12) to (0, 12) -- cycle; \filldraw[fill=Azure4, draw=Azure4, draw opacity=0.35, fill opacity=0.06, line width=0.4pt] (0, -12) to (6, -12) to (6, -6) to (0, -6) -- cycle; \draw[color=Azure4, opacity=0.25, step=1] ({-6}, {-6}) grid ({6}, {6}); \foreach \argEta in {0.0,0.16666666666666666,0.3333333333333333,0.5,0.6666666666666666,0.8333333333333334,1.0}{ \draw[Azure4, smooth, line width=0.7pt, variable=\sampleParam, domain=0:1, samples=18] plot ({sqrt(max(0, (sqrt(((\argEta^2) + (\sampleParam^2))) - \argEta)))}, {sqrt(max(0, (sqrt(((\argEta^2) + (\sampleParam^2))) + \argEta)))}); } \foreach \sampleParam in {0.0,0.16666666666666666,0.3333333333333333,0.5,0.6666666666666666,0.8333333333333334,1.0}{ \draw[Azure4, smooth, line width=0.7pt, variable=\argEta, domain=0:1, samples=18] plot ({sqrt(max(0, (sqrt(((\argEta^2) + (\sampleParam^2))) - \argEta)))}, {sqrt(max(0, (sqrt(((\argEta^2) + (\sampleParam^2))) + \argEta)))}); } \foreach \argEtaTwo in {0.0,0.16666666666666666,0.3333333333333333,0.5,0.6666666666666666,0.8333333333333334,1.0}{ \draw[Azure4, smooth, line width=0.7pt, variable=\sampleParamTwo, domain=0:1, samples=18] plot ({sqrt(max(0, (sqrt(((\argEtaTwo^2) + (\sampleParamTwo^2))) + \argEtaTwo)))}, {sqrt(max(0, (sqrt(((\argEtaTwo^2) + (\sampleParamTwo^2))) - \argEtaTwo)))}); } \foreach \sampleParamTwo in {0.0,0.16666666666666666,0.3333333333333333,0.5,0.6666666666666666,0.8333333333333334,1.0}{ \draw[Azure4, smooth, line width=0.7pt, variable=\argEtaTwo, domain=0:1, samples=18] plot ({sqrt(max(0, (sqrt(((\argEtaTwo^2) + (\sampleParamTwo^2))) + \argEtaTwo)))}, {sqrt(max(0, (sqrt(((\argEtaTwo^2) + (\sampleParamTwo^2))) - \argEtaTwo)))}); } \node[text=black] (node0) at ({-2}, {0.5}) {$\times$}; \node[text=Orange1] (node1) at ({-2}, {0.0}) {$\bullet$};\end{tikzpicture}Show the standalone LaTeX document
\documentclass[border=10pt]{standalone}\PassOptionsToPackage{dvipsnames,svgnames,x11names}{xcolor}\usepackage{tikz}\usepackage{pgfplots}\pgfplotsset{compat=newest}\usepgfplotslibrary{groupplots}\usetikzlibrary{arrows.meta}\begin{document}% --------------------------------------------- %% Tikzfigure generated by tikzfigure v0.5.0     %% https://github.com/max-models/tikzfigure      %% --------------------------------------------- %\begin{tikzpicture}    \pgfkeys{/pgf/declare function={map_x(\x, \y) = sqrt(max(0, (sqrt(((\x^2) + (\y^2))) - \x)));}}    \pgfkeys{/pgf/declare function={map_y(\x, \y) = sqrt(max(0, (sqrt(((\x^2) + (\y^2))) + \x)));}}    \pgfkeys{/pgf/declare function={smoothstep(\x) = 6*\x^5 - 15*\x^4 + 10*\x^3;}}    \pgfkeys{/pgf/declare function={blend(\x) = ifthenelse(\x < 0, 0, ifthenelse(\x > 1, 1, smoothstep(\x)));}}    \pgfkeys{/pgf/declare function={q(\x) = blend(2*(\x - 0.4));}}    \filldraw[fill=Azure4, draw=Azure4, draw opacity=0.35, fill opacity=0.06, line width=0.4pt] (0, 0)        to        (6, 0)        to        (6, 6)        to        (0, 6) -- cycle;    \filldraw[fill=Azure4, draw=Azure4, draw opacity=0.35, fill opacity=0.06, line width=0.4pt] (0, 0)        to        (-6, 0)        to        (-6, 6)        to        (0, 6) -- cycle;    \filldraw[fill=Azure4, draw=Azure4, draw opacity=0.35, fill opacity=0.06, line width=0.4pt] (0, 0)        to        (6, 0)        to        (6, -6)        to        (0, -6) -- cycle;    \filldraw[fill=Azure4, draw=Azure4, draw opacity=0.35, fill opacity=0.06, line width=0.4pt] (0, 0)        to        (-6, 0)        to        (-6, -6)        to        (0, -6) -- cycle;    \filldraw[fill=Azure4, draw=Azure4, draw opacity=0.35, fill opacity=0.06, line width=0.4pt] (6, 0)        to        (12, 0)        to        (12, 6)        to        (6, 6) -- cycle;    \filldraw[fill=Azure4, draw=Azure4, draw opacity=0.35, fill opacity=0.06, line width=0.4pt] (-12, 0)        to        (-6, 0)        to        (-6, 6)        to        (-12, 6) -- cycle;    \filldraw[fill=Azure4, draw=Azure4, draw opacity=0.35, fill opacity=0.06, line width=0.4pt] (0, 6)        to        (6, 6)        to        (6, 12)        to        (0, 12) -- cycle;    \filldraw[fill=Azure4, draw=Azure4, draw opacity=0.35, fill opacity=0.06, line width=0.4pt] (0, -12)        to        (6, -12)        to        (6, -6)        to        (0, -6) -- cycle;    \draw[color=Azure4, opacity=0.25, step=1] ({-6}, {-6}) grid ({6}, {6});    \foreach \argEta in {0.0,0.16666666666666666,0.3333333333333333,0.5,0.6666666666666666,0.8333333333333334,1.0}{        \draw[Azure4, smooth, line width=0.7pt, variable=\sampleParam, domain=0:1, samples=18] plot ({sqrt(max(0, (sqrt(((\argEta^2) + (\sampleParam^2))) - \argEta)))}, {sqrt(max(0, (sqrt(((\argEta^2) + (\sampleParam^2))) + \argEta)))});    }    \foreach \sampleParam in {0.0,0.16666666666666666,0.3333333333333333,0.5,0.6666666666666666,0.8333333333333334,1.0}{        \draw[Azure4, smooth, line width=0.7pt, variable=\argEta, domain=0:1, samples=18] plot ({sqrt(max(0, (sqrt(((\argEta^2) + (\sampleParam^2))) - \argEta)))}, {sqrt(max(0, (sqrt(((\argEta^2) + (\sampleParam^2))) + \argEta)))});    }    \foreach \argEtaTwo in {0.0,0.16666666666666666,0.3333333333333333,0.5,0.6666666666666666,0.8333333333333334,1.0}{        \draw[Azure4, smooth, line width=0.7pt, variable=\sampleParamTwo, domain=0:1, samples=18] plot ({sqrt(max(0, (sqrt(((\argEtaTwo^2) + (\sampleParamTwo^2))) + \argEtaTwo)))}, {sqrt(max(0, (sqrt(((\argEtaTwo^2) + (\sampleParamTwo^2))) - \argEtaTwo)))});    }    \foreach \sampleParamTwo in {0.0,0.16666666666666666,0.3333333333333333,0.5,0.6666666666666666,0.8333333333333334,1.0}{        \draw[Azure4, smooth, line width=0.7pt, variable=\argEtaTwo, domain=0:1, samples=18] plot ({sqrt(max(0, (sqrt(((\argEtaTwo^2) + (\sampleParamTwo^2))) + \argEtaTwo)))}, {sqrt(max(0, (sqrt(((\argEtaTwo^2) + (\sampleParamTwo^2))) - \argEtaTwo)))});    }    \node[text=black] (node0) at ({-2}, {0.5}) {$\times$};    \node[text=Orange1] (node1) at ({-2}, {0.0}) {$\bullet$};\end{tikzpicture}
\end{document}