3D Figures
tikzfigure supports 3-D plots via fig.plot3d(xvec, yvec, zvec). Pass ndim=3
when creating the figure to switch to pgfplots’ \begin{axis} environment with
a default perspective of view={20}{30}.
Key facts: - Multiple plot3d calls on the same figure stack as separate
curves. - node(x, y, z=z, ...) places a marker in 3-D space. -
show_axes=True adds labelled axis lines and a grid.
This tutorial covers: - Simple helix - the minimal 3-D setup - Torus
knot - a parametric knot wound on a torus surface - Double helix - two
interleaved helices with connecting rungs - Sphere wireframe - a sphere
assembled from many short plot3d curves - Butterfly effect - two nearby
Lorenz trajectories diverging over time
import numpy as npfrom scipy.integrate import odeint
from tikzfigure import TikzFigure, styles
A simple 3-D helix
Section titled “A simple 3-D helix”Before tackling the Lorenz system, here is a simple parametric helix to illustrate the 3-D setup.
fig = TikzFigure(ndim=3)
t = np.linspace(0, 4 * np.pi, 200)xvec = np.cos(t)yvec = np.sin(t)zvec = t / (4 * np.pi) * 4  # rise from 0 to 4
fig.plot3d(    xvec,    yvec,    zvec,    color="blue",    options=[styles.thick],    layer=0,)
# Mark start and endfig.node(    (xvec[0], yvec[0], zvec[0]),    fill="green!60!black",    inner_sep="3pt",    options="circle",)fig.node(    (xvec[-1], yvec[-1], zvec[-1]),    fill="red!70!black",    inner_sep="3pt",    options="circle",)
fig.show(width=400)
/home/runner/work/tikzfigure/tikzfigure/.venv/lib/python3.12/site-packages/fitz/__init__.py:17: FutureWarning: The `fitz` API is deprecated and will be removed in future. Use `import pymupdf` instead. warnings.warn(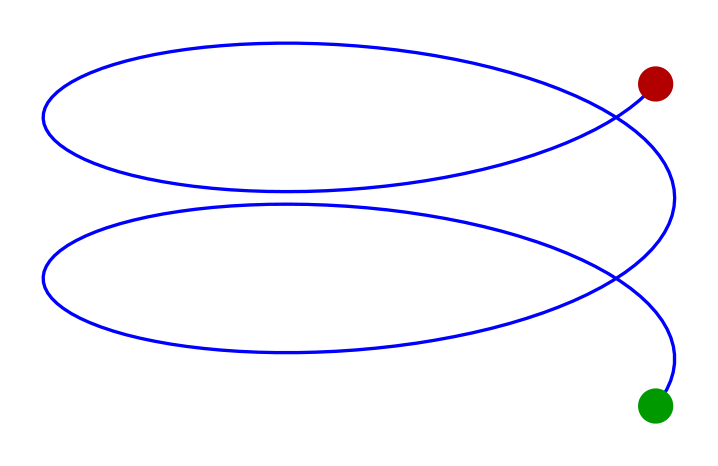
Lorenz attractor
Section titled “Lorenz attractor”The Lorenz system is the ODE, based on this example:
with , , . Small differences in initial conditions lead to wildly different trajectories - the butterfly effect.
We integrate for 20 time units, scale the result down, and plot the trajectory. The green dot marks the start; red marks the end.
rho, sigma, beta = 28.0, 10.0, 8.0 / 3.0

def lorenz(state, t):    x, y, z = state    return [sigma * (y - x), x * (rho - z) - y, x * y - beta * z]

t = np.arange(0.0, 20.0, 0.01)states = odeint(lorenz, y0=[1.0, 1.0, 1.0], t=t) * 0.25
fig = TikzFigure(ndim=3)
fig.plot3d(    states[:, 0],    states[:, 1],    states[:, 2],    color="black",    options=[styles.thick],    layer=0,)
fig.node(    (states[0, 0], states[0, 1], states[0, 2]),    fill="green!50!black",    inner_sep="2.0pt",    options="circle",)fig.node(    (states[-1, 0], states[-1, 1], states[-1, 2]),    fill="red!50!black",    inner_sep="2.0pt",    options="circle",)
fig.show(width=500)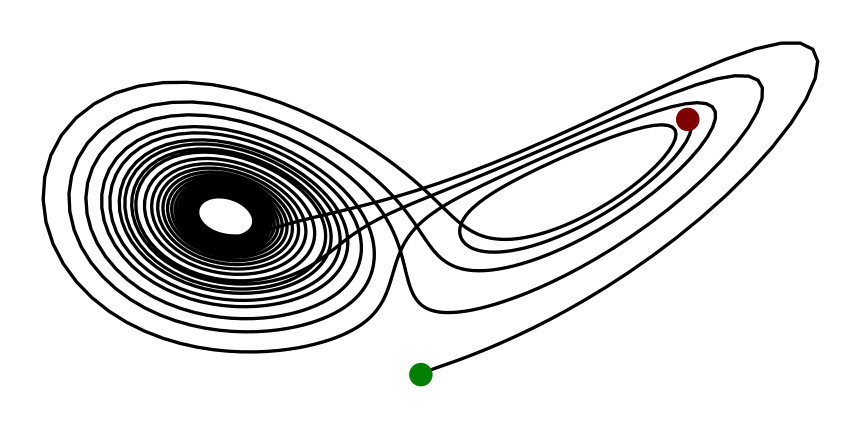
Torus knot
Section titled “Torus knot”A torus knot winds times around the torus in the longitudinal direction and times in the meridional direction. The parametric equations are:
With we get the trefoil knot - the simplest non-trivial knot. Increasing and produces more complex knots; try or .
fig = TikzFigure(ndim=3)
p, q = 2, 3  # (2,3) = trefoil knotR, r = 2.0, 0.8  # torus major / minor radii
t = np.linspace(0, 2 * np.pi, 600)x = (R + r * np.cos(q * t)) * np.cos(p * t)y = (R + r * np.cos(q * t)) * np.sin(p * t)z = r * np.sin(q * t)
fig.plot3d(    x,    y,    z,    color="purple",    options=[styles.thick],    layer=0,)
fig.show(width=450)