Karl's students
This tutorial recreates the classic “A picture for Karl’s students” example
from the TikZ/PGF manual using the current tikzfigure Python API.
Most of the figure maps directly to high-level helpers:
- figure-scoped named styles via
add_style() - local option blocks via
scope() - named colors via
colorlet() - arc path segments via
.arc(...)/ arc segment options - per-segment labels via
"node"insegment_options
The main approximation is the tangent intersection point: instead of using
TikZ’s intersections library, this tutorial computes that helper point in
Python and then draws the same geometry through the API.
import math
from tikzfigure import TikzFigure, arrows, colors, styles, units
Recreating the figure
Section titled “Recreating the figure”alpha_deg = 30alpha = math.radians(alpha_deg)
# Helper geometry computed in Pythonpoint_on_circle = (math.cos(alpha), math.sin(alpha))projection_on_x = (point_on_circle[0], 0)tangent_point = (1, math.tan(alpha))angle_label = ( 0.2 * math.cos(alpha / 2), 0.2 * math.sin(alpha / 2),)
fig = TikzFigure( figure_setup="scale=3, line cap=round", figsize=(13, 7),)fig.add_package("amsmath")
axes = fig.add_style("axes")important_line = fig.add_style("important line", options=[styles.very_thick])information_text = fig.add_style( "information text", options=["rounded corners"], fill=colors.red.mix(percent=10), inner_sep="1ex",)
fig.colorlet("anglecolor", colors.green.mix(colors.black, percent=50))fig.colorlet("sincolor", colors.red)fig.colorlet("tancolor", colors.orange.mix(colors.black, percent=80))fig.colorlet("coscolor", colors.blue)
# Background grid and unit circlefig.grid( (-1.4, -1.4), (1.4, 1.4), step="0.5cm", color=colors.lightgray, line_width="0.2pt",)fig.circle((0, 0), "1cm")
# Axes, ticks, and axis labelswith fig.scope(options=[axes]) as local: local.draw( [(-1.5, 0), (1.5, 0)], options=[arrows.forward], color=colors.black, segment_options=[ { "connector": "--", "node": {"content": r"$x$", "right": True}, } ], ) local.draw( [(0, -1.5), (0, 1.5)], options=[arrows.forward], color=colors.black, segment_options=[ { "connector": "--", "node": {"content": r"$y$", "above": True}, } ], )
for x, xtext in [ (-1, "-1"), (-0.5, r"-\frac{1}{2}"), (1, "1"), ]: local.draw( [(x, 1 * units.pt), (x, -1 * units.pt)], color=colors.black, segment_options=[{"connector": "--"}], ) local.node( (x, -5 * units.pt), content=rf"${xtext}$", fill=colors.white, draw="none", anchor="north", )
for y, ytext in [ (-1, "-1"), (-0.5, r"-\frac{1}{2}"), (0.5, r"\frac{1}{2}"), (1, "1"), ]: local.draw( [(1 * units.pt, y), (-1 * units.pt, y)], color=colors.black, segment_options=[{"connector": "--"}], ) local.node( (-5 * units.pt, y), content=rf"${ytext}$", fill=colors.white,... (6 lines skipped) ... [(0, 0), (3 * units.mm, 0)], fill=colors.green.mix(percent=20), draw="anglecolor", segment_options=[ {"connector": "--"}, { "connector": "arc", "start_angle": 0, "end_angle": alpha_deg, "radius": "3mm", }, ],)fig.node( angle_label, content=r"$\alpha$", text="anglecolor", draw="none",)
# Sine and cosine legsfig.draw( [point_on_circle, projection_on_x], options=[important_line], color="sincolor", segment_options=[ { "connector": "--", "node": { "content": r"$\sin \alpha$", "left": "1pt", "fill": "white", }, } ],)fig.draw( [projection_on_x, (0, 0)], options=[important_line], color="coscolor", segment_options=[ { "connector": "--", "node": { "content": r"$\cos \alpha$", "below": "2pt", "fill": "white", }, } ],)
# Tangent segment and sloped radius linetan_label = ( r"$\displaystyle \tan \alpha \color{black}=" r"\frac{{\color{red}\sin \alpha}}{{\color{blue}\cos \alpha}}$")tan_base = fig.add_coordinate("tan_base", (1, 0))tan_tip = fig.add_coordinate("tan_tip", tangent_point)
fig.draw( tan_base.to( tan_tip, options=[styles.very_thick], node={ "content": tan_label, "right": "1pt", "fill": "white", }, ), color="tancolor",)fig.draw( [(0, 0), tangent_point], color=colors.black, segment_options=[{"connector": "--"}],)
# Explanatory text boxinfo_text = r"""The {\color{anglecolor} angle $\alpha$} is $30^\circ$ in thisexample ($\pi/6$ in radians). The {\color{sincolor}sine of$\alpha$}, which is the height of the red line, is\[{\color{sincolor}\sin \alpha} = 1/2.\]The blue cosine segment and orange tangent segment completethe same right-triangle picture."""
fig.node( (1.85, 0.45), anchor="west", text_width="6cm", align="left", options=[information_text], content=info_text,)
fig.show()/home/runner/work/tikzfigure/tikzfigure/.venv/lib/python3.12/site-packages/fitz/__init__.py:17: FutureWarning: The `fitz` API is deprecated and will be removed in future. Use `import pymupdf` instead. warnings.warn(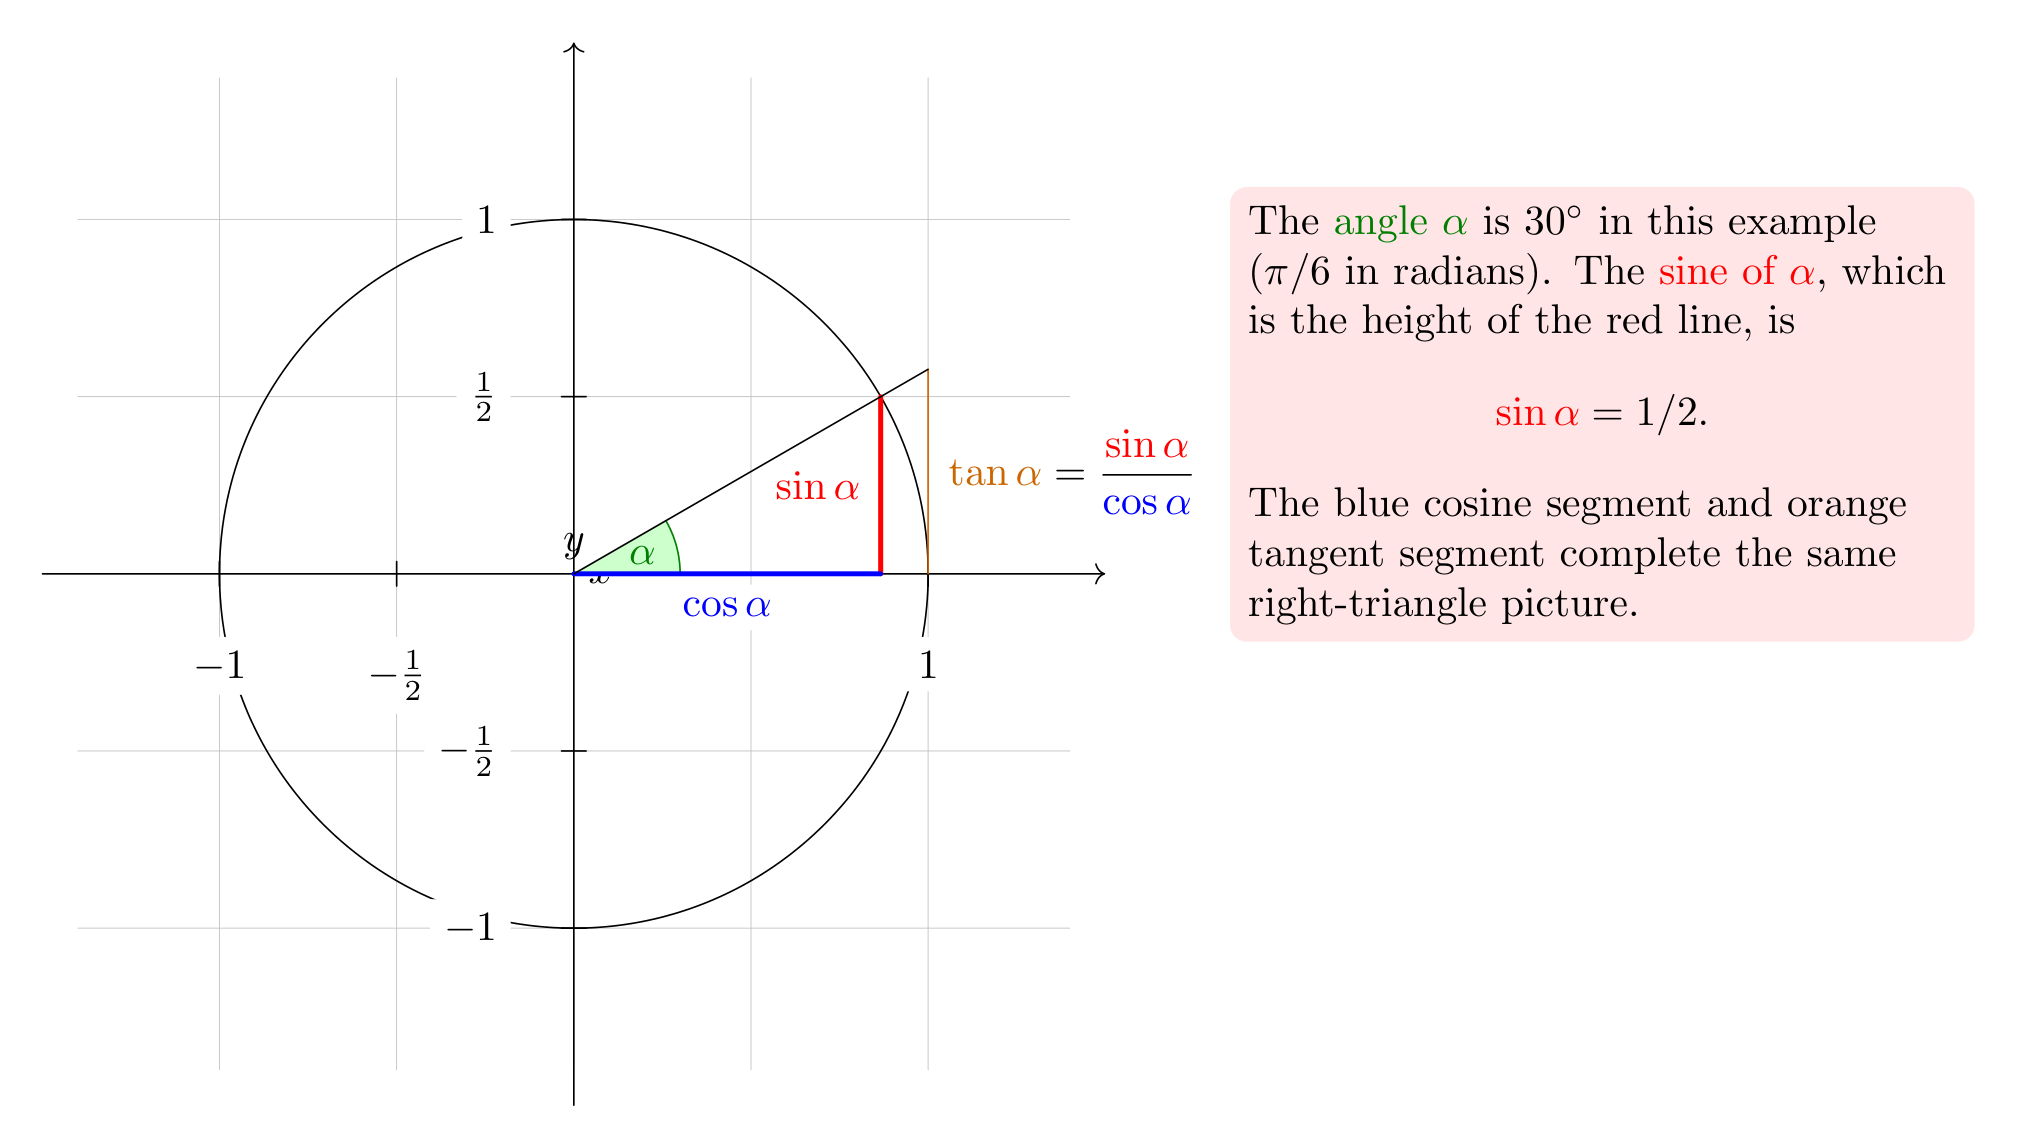
Show the TikZ code
% --------------------------------------------- %% Tikzfigure generated by tikzfigure v0.5.0 %% https://github.com/max-models/tikzfigure %% --------------------------------------------- %\begin{tikzpicture}[ scale=3, line cap=round, axes/.style={}, important line/.style={very thick}, information text/.style={rounded corners, fill=red!10!white, inner sep=1ex} ] \colorlet{anglecolor}{green!50!black} \colorlet{sincolor}{red} \colorlet{tancolor}{orange!80!black} \colorlet{coscolor}{blue} \draw[color=lightgray, line width=0.2pt, step=0.5cm] ({-1.4}, {-1.4}) grid ({1.4}, {1.4}); \draw ({0}, {0}) circle (1cm); \begin{scope}[axes] \draw[->, color=black] (-1.5, 0) -- node[right] {$x$} (1.5, 0); \draw[->, color=black] (0, -1.5) -- node[above] {$y$} (0, 1.5); \draw[color=black] (-1, 1pt) -- (-1, -1pt); \node[fill=white, draw=none, anchor=north] () at ({-1}, {-5pt}) {$-1$}; \draw[color=black] (-0.5, 1pt) -- (-0.5, -1pt); \node[fill=white, draw=none, anchor=north] () at ({-0.5}, {-5pt}) {$-\frac{1}{2}$}; \draw[color=black] (1, 1pt) -- (1, -1pt); \node[fill=white, draw=none, anchor=north] () at ({1}, {-5pt}) {$1$}; \draw[color=black] (1pt, -1) -- (-1pt, -1); \node[fill=white, draw=none, anchor=east] () at ({-5pt}, {-1}) {$-1$}; \draw[color=black] (1pt, -0.5) -- (-1pt, -0.5); \node[fill=white, draw=none, anchor=east] () at ({-5pt}, {-0.5}) {$-\frac{1}{2}$}; \draw[color=black] (1pt, 0.5) -- (-1pt, 0.5); \node[fill=white, draw=none, anchor=east] () at ({-5pt}, {0.5}) {$\frac{1}{2}$}; \draw[color=black] (1pt, 1) -- (-1pt, 1); \node[fill=white, draw=none, anchor=east] () at ({-5pt}, {1}) {$1$}; \end{scope} \filldraw[fill=green!20!white, draw=anglecolor] (0, 0) -- (3mm, 0) arc[start angle=0, end angle=30, radius=3mm]; \node[draw=none, text=anglecolor] (node0) at ({0.19318516525781368}, {0.05176380902050415}) {$\alpha$}; \draw[important line, color=sincolor] (0.8660254037844387, 0.49999999999999994) -- node[left=1pt, fill=white] {$\sin \alpha$} (0.8660254037844387, 0); \draw[important line, color=coscolor] (0.8660254037844387, 0) -- node[below=2pt, fill=white] {$\cos \alpha$} (0, 0); \coordinate (tan_base) at ({1}, {0}); \coordinate (tan_tip) at ({1}, {0.5773502691896257}); \draw[color=tancolor] (tan_base) to[very thick] node[right=1pt, fill=white] {$\displaystyle \tan \alpha \color{black}=\frac{{\color{red}\sin \alpha}}{{\color{blue}\cos \alpha}}$} (tan_tip); \draw[color=black] (0, 0) -- (1, 0.5773502691896257); \node[information text, text width=6cm, align=left, anchor=west] (node1) at ({1.85}, {0.45}) { The {\color{anglecolor} angle $\alpha$} is $30^\circ$ in this example ($\pi/6$ in radians). The {\color{sincolor}sine of $\alpha$}, which is the height of the red line, is \[ {\color{sincolor}\sin \alpha} = 1/2. \] The blue cosine segment and orange tangent segment complete the same right-triangle picture. };\end{tikzpicture}Show the standalone LaTeX document
\documentclass[border=10pt]{standalone}\PassOptionsToPackage{dvipsnames,svgnames,x11names}{xcolor}\usepackage{tikz}\usepackage{pgfplots}\pgfplotsset{compat=newest}\usepgfplotslibrary{groupplots}\usetikzlibrary{arrows.meta}\usepackage{amsmath}\begin{document}% --------------------------------------------- %% Tikzfigure generated by tikzfigure v0.5.0     %% https://github.com/max-models/tikzfigure      %% --------------------------------------------- %\begin{tikzpicture}[        scale=3, line cap=round,        axes/.style={},        important line/.style={very thick},        information text/.style={rounded corners, fill=red!10!white, inner sep=1ex}    ]    \colorlet{anglecolor}{green!50!black}    \colorlet{sincolor}{red}    \colorlet{tancolor}{orange!80!black}    \colorlet{coscolor}{blue}    \draw[color=lightgray, line width=0.2pt, step=0.5cm] ({-1.4}, {-1.4}) grid ({1.4}, {1.4});    \draw ({0}, {0}) circle (1cm);    \begin{scope}[axes]        \draw[->, color=black] (-1.5, 0) -- node[right] {$x$} (1.5, 0);        \draw[->, color=black] (0, -1.5) -- node[above] {$y$} (0, 1.5);        \draw[color=black] (-1, 1pt) -- (-1, -1pt);        \node[fill=white, draw=none, anchor=north] () at ({-1}, {-5pt}) {$-1$};        \draw[color=black] (-0.5, 1pt) -- (-0.5, -1pt);        \node[fill=white, draw=none, anchor=north] () at ({-0.5}, {-5pt}) {$-\frac{1}{2}$};        \draw[color=black] (1, 1pt) -- (1, -1pt);        \node[fill=white, draw=none, anchor=north] () at ({1}, {-5pt}) {$1$};        \draw[color=black] (1pt, -1) -- (-1pt, -1);        \node[fill=white, draw=none, anchor=east] () at ({-5pt}, {-1}) {$-1$};        \draw[color=black] (1pt, -0.5) -- (-1pt, -0.5);        \node[fill=white, draw=none, anchor=east] () at ({-5pt}, {-0.5}) {$-\frac{1}{2}$};        \draw[color=black] (1pt, 0.5) -- (-1pt, 0.5);        \node[fill=white, draw=none, anchor=east] () at ({-5pt}, {0.5}) {$\frac{1}{2}$};        \draw[color=black] (1pt, 1) -- (-1pt, 1);        \node[fill=white, draw=none, anchor=east] () at ({-5pt}, {1}) {$1$};    \end{scope}    \filldraw[fill=green!20!white, draw=anglecolor] (0, 0) -- (3mm, 0) arc[start angle=0, end angle=30, radius=3mm];    \node[draw=none, text=anglecolor] (node0) at ({0.19318516525781368}, {0.05176380902050415}) {$\alpha$};    \draw[important line, color=sincolor] (0.8660254037844387, 0.49999999999999994) -- node[left=1pt, fill=white] {$\sin \alpha$} (0.8660254037844387, 0);    \draw[important line, color=coscolor] (0.8660254037844387, 0) -- node[below=2pt, fill=white] {$\cos \alpha$} (0, 0);    \coordinate (tan_base) at ({1}, {0});    \coordinate (tan_tip) at ({1}, {0.5773502691896257});    \draw[color=tancolor] (tan_base) to[very thick] node[right=1pt, fill=white] {$\displaystyle \tan \alpha \color{black}=\frac{{\color{red}\sin \alpha}}{{\color{blue}\cos \alpha}}$} (tan_tip);    \draw[color=black] (0, 0) -- (1, 0.5773502691896257);    \node[information text, text width=6cm, align=left, anchor=west] (node1) at ({1.85}, {0.45}) {    The {\color{anglecolor} angle $\alpha$} is $30^\circ$ in this    example ($\pi/6$ in radians). The {\color{sincolor}sine of    $\alpha$}, which is the height of the red line, is    \[    {\color{sincolor}\sin \alpha} = 1/2.    \]    The blue cosine segment and orange tangent segment complete    the same right-triangle picture.    };\end{tikzpicture}
\end{document}
Even without a first-class intersections helper yet, the current API already gets very close to the original:
- named styles and local scopes match the manual structure closely
- arc segments, labeled paths, and xcolor mixes all stay in the Python layer
- only the tangent helper point is computed numerically instead of through a TikZ library-driven intersection