Paths and shapes
Beyond simple node-to-node connections, tikzfigure lets you draw arbitrary paths
from lists of (x, y) coordinates.
- drawing open and closed coordinate paths
filldrawfor filled closed shapes- rounded corners
- per-segment styling with
segment_options - node paths and
.centeranchors for correct fills - custom shapes (heart, star)
- parametric curves with NumPy (spiral, sun)
fillfor stroke-free fills and even-odd ruleclipfor clipping regionspathfor invisible named paths and mid-path labels
import numpy as np
from tikzfigure import TikzFigure, arrows, styles, units
Open and closed coordinate paths
Section titled “Open and closed coordinate paths”Pass a list of [x, y] pairs (or (x, y) tuples) to fig.draw(). Set
cycle=True to close the path back to the starting point.
fig = TikzFigure()
# Open path - a zigzagzigzag = [[0, 0], [1, 1], [2, 0], [3, 1], [4, 0]]fig.draw(zigzag, line_width=2, color="blue")
# Closed path - a triangletriangle = [[6, 0], [8, 0], [7, 1.5]]fig.draw(    triangle,    cycle=True,    line_width=2,    color="red",)
fig.show()
/home/runner/work/tikzfigure/tikzfigure/.venv/lib/python3.12/site-packages/fitz/__init__.py:17: FutureWarning: The `fitz` API is deprecated and will be removed in future. Use `import pymupdf` instead. warnings.warn(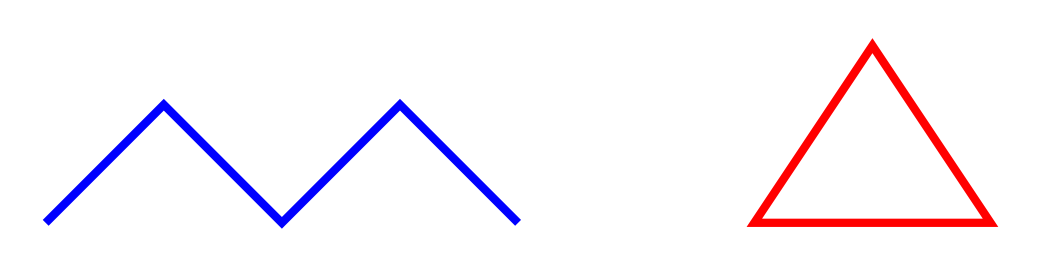
Show the TikZ code
% --------------------------------------------- %% Tikzfigure generated by tikzfigure v0.5.0 %% https://github.com/max-models/tikzfigure %% --------------------------------------------- %\begin{tikzpicture} \draw[color=blue, line width=2] (0, 0) to (1, 1) to (2, 0) to (3, 1) to (4, 0); \draw[color=red, line width=2] (6, 0) to (8, 0) to (7, 1.5) -- cycle;\end{tikzpicture}Show the standalone LaTeX document
\documentclass[border=10pt]{standalone}\PassOptionsToPackage{dvipsnames,svgnames,x11names}{xcolor}\usepackage{tikz}\usepackage{pgfplots}\pgfplotsset{compat=newest}\usepgfplotslibrary{groupplots}\usetikzlibrary{arrows.meta}\begin{document}% --------------------------------------------- %% Tikzfigure generated by tikzfigure v0.5.0     %% https://github.com/max-models/tikzfigure      %% --------------------------------------------- %\begin{tikzpicture}    \draw[color=blue, line width=2] (0, 0)        to        (1, 1)        to        (2, 0)        to        (3, 1)        to        (4, 0);    \draw[color=red, line width=2] (6, 0) to (8, 0) to (7, 1.5) -- cycle;\end{tikzpicture}
\end{document}
Filled shapes with filldraw
Section titled “Filled shapes with filldraw”fig.filldraw() is shorthand for a closed path that is both drawn (outline) and
filled. You can also use fig.draw(..., fill="color") for the same effect.
fig = TikzFigure()
# Pentagon via filldrawangles = np.linspace(np.pi / 2, np.pi / 2 + 2 * np.pi, 6)[:-1]pentagon = list(    zip(        np.cos(angles) * 2 + 2,        np.sin(angles) * 2 + 2,    ),)fig.filldraw(    pentagon,    cycle=True,    line_width=2,    color="purple",    fill="purple!20",)
# Same via draw(..., fill=...)hexagon_angles = np.linspace(0, 2 * np.pi, 7)[:-1]hexagon = list(    zip(        np.cos(hexagon_angles) * 2 + 7,        np.sin(hexagon_angles) * 2 + 2,    ),)fig.draw(    hexagon,    cycle=True,    line_width=2,    color="teal",    fill="teal!20",)
fig.show()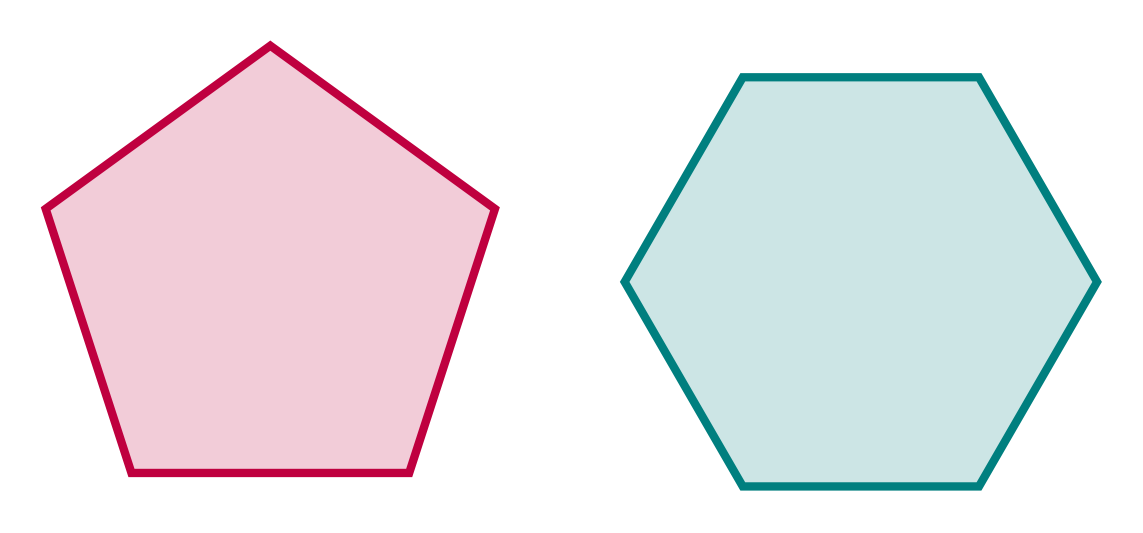
Show the TikZ code
% --------------------------------------------- %% Tikzfigure generated by tikzfigure v0.5.0 %% https://github.com/max-models/tikzfigure %% --------------------------------------------- %\begin{tikzpicture} \filldraw[color=purple, fill=purple!20, line width=2] (2.0, 4.0) to (0.09788696740969294, 2.618033988749895) to (0.8244294954150535, 0.3819660112501053) to (3.175570504584946, 0.3819660112501049) to (3.9021130325903073, 2.6180339887498945) -- cycle; \draw[color=teal, fill=teal!20, line width=2] (9.0, 2.0) to (8.0, 3.732050807568877) to (6.0, 3.7320508075688776) to (5.0, 2.0000000000000004) to (5.999999999999999, 0.26794919243112325) to (7.999999999999998, 0.2679491924311219) -- cycle;\end{tikzpicture}Show the standalone LaTeX document
\documentclass[border=10pt]{standalone}\PassOptionsToPackage{dvipsnames,svgnames,x11names}{xcolor}\usepackage{tikz}\usepackage{pgfplots}\pgfplotsset{compat=newest}\usepgfplotslibrary{groupplots}\usetikzlibrary{arrows.meta}\begin{document}% --------------------------------------------- %% Tikzfigure generated by tikzfigure v0.5.0     %% https://github.com/max-models/tikzfigure      %% --------------------------------------------- %\begin{tikzpicture}    \filldraw[color=purple, fill=purple!20, line width=2] (2.0, 4.0)        to        (0.09788696740969294, 2.618033988749895)        to        (0.8244294954150535, 0.3819660112501053)        to        (3.175570504584946, 0.3819660112501049)        to        (3.9021130325903073, 2.6180339887498945) -- cycle;    \draw[color=teal, fill=teal!20, line width=2] (9.0, 2.0)        to        (8.0, 3.732050807568877)        to        (6.0, 3.7320508075688776)        to        (5.0, 2.0000000000000004)        to        (5.999999999999999, 0.26794919243112325)        to        (7.999999999999998, 0.2679491924311219) -- cycle;\end{tikzpicture}
\end{document}
Rounded corners
Section titled “Rounded corners”The rounded_corners parameter (in pt) smooths the corners of any path.
fig = TikzFigure()
# Same square, with increasing corner radiusfor i, radius in enumerate([0, 5, 15, 30]):    x0 = i * 3.5    square = [[x0, 0], [x0 + 2, 0], [x0 + 2, 2], [x0, 2]]    fig.draw(        square,        cycle=True,        line_width=2,        color="black",        fill="orange!20",        rounded_corners=f"{radius}pt",    )    fig.node(        x0 + 1,        -0.5,        content=f"{radius}pt",        draw="none",    )
fig.show()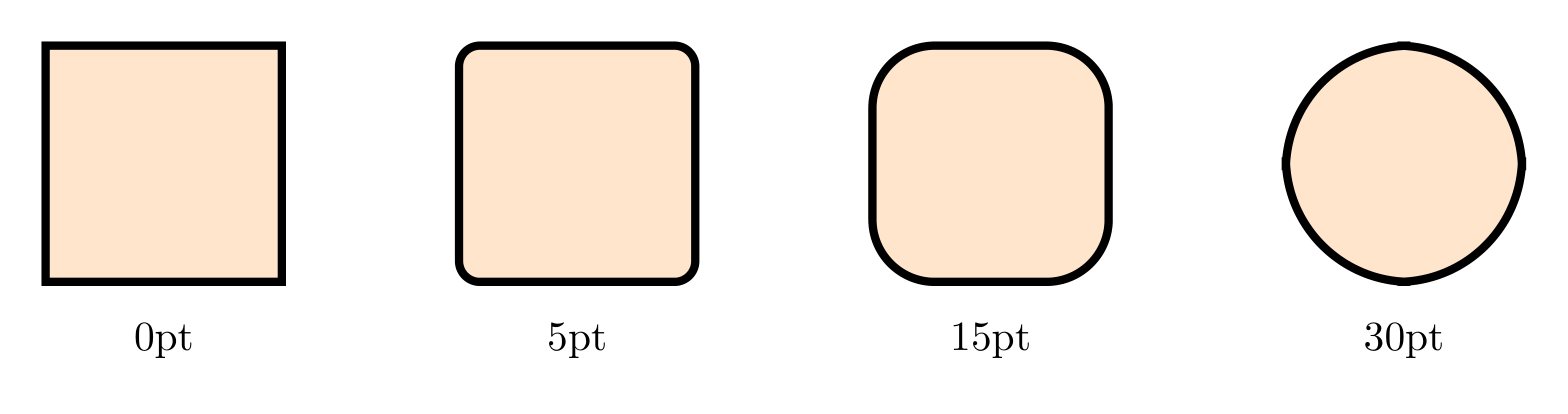
Show the TikZ code
% --------------------------------------------- %% Tikzfigure generated by tikzfigure v0.5.0 %% https://github.com/max-models/tikzfigure %% --------------------------------------------- %\begin{tikzpicture} \draw[color=black, fill=orange!20, line width=2, rounded corners=0pt] (0.0, 0) to (2.0, 0) to (2.0, 2) to (0.0, 2) -- cycle; \node[draw=none] (node0) at ({1.0}, {-0.5}) {0pt}; \draw[color=black, fill=orange!20, line width=2, rounded corners=5pt] (3.5, 0) to (5.5, 0) to (5.5, 2) to (3.5, 2) -- cycle; \node[draw=none] (node1) at ({4.5}, {-0.5}) {5pt}; \draw[color=black, fill=orange!20, line width=2, rounded corners=15pt] (7.0, 0) to (9.0, 0) to (9.0, 2) to (7.0, 2) -- cycle; \node[draw=none] (node2) at ({8.0}, {-0.5}) {15pt}; \draw[color=black, fill=orange!20, line width=2, rounded corners=30pt] (10.5, 0) to (12.5, 0) to (12.5, 2) to (10.5, 2) -- cycle; \node[draw=none] (node3) at ({11.5}, {-0.5}) {30pt};\end{tikzpicture}Show the standalone LaTeX document
\documentclass[border=10pt]{standalone}\PassOptionsToPackage{dvipsnames,svgnames,x11names}{xcolor}\usepackage{tikz}\usepackage{pgfplots}\pgfplotsset{compat=newest}\usepgfplotslibrary{groupplots}\usetikzlibrary{arrows.meta}\begin{document}% --------------------------------------------- %% Tikzfigure generated by tikzfigure v0.5.0     %% https://github.com/max-models/tikzfigure      %% --------------------------------------------- %\begin{tikzpicture}    \draw[color=black, fill=orange!20, line width=2, rounded corners=0pt] (0.0, 0)        to        (2.0, 0)        to        (2.0, 2)        to        (0.0, 2) -- cycle;    \node[draw=none] (node0) at ({1.0}, {-0.5}) {0pt};    \draw[color=black, fill=orange!20, line width=2, rounded corners=5pt] (3.5, 0)        to        (5.5, 0)        to        (5.5, 2)        to        (3.5, 2) -- cycle;    \node[draw=none] (node1) at ({4.5}, {-0.5}) {5pt};    \draw[color=black, fill=orange!20, line width=2, rounded corners=15pt] (7.0, 0)        to        (9.0, 0)        to        (9.0, 2)        to        (7.0, 2) -- cycle;    \node[draw=none] (node2) at ({8.0}, {-0.5}) {15pt};    \draw[color=black, fill=orange!20, line width=2, rounded corners=30pt] (10.5, 0)        to        (12.5, 0)        to        (12.5, 2)        to        (10.5, 2) -- cycle;    \node[draw=none] (node3) at ({11.5}, {-0.5}) {30pt};\end{tikzpicture}
\end{document}
Per-segment styling
Section titled “Per-segment styling”segment_options accepts a list of per-connector option dicts, one for each
to step in the path. Each dict uses keyword-style TikZ options (underscores
become spaces) plus an optional "options" key for flag-style items like
styles.dashed or arrows.forward.
Here four segments are given different colors and styles in a single draw
call:
fig = TikzFigure()
waypoints = [[0, 0], [2, 2], [4, 0], [6, 2], [8, 0]]
fig.draw(    waypoints,    line_width=2,    segment_options=[        {"color": "red"},        {"color": "blue", "options": [styles.dashed], "line_width": 1.5},        {"color": "green!60!black", "line_width": 3},        {"color": "purple", "options": [styles.dotted], "line_width": 2},    ],)
fig.show()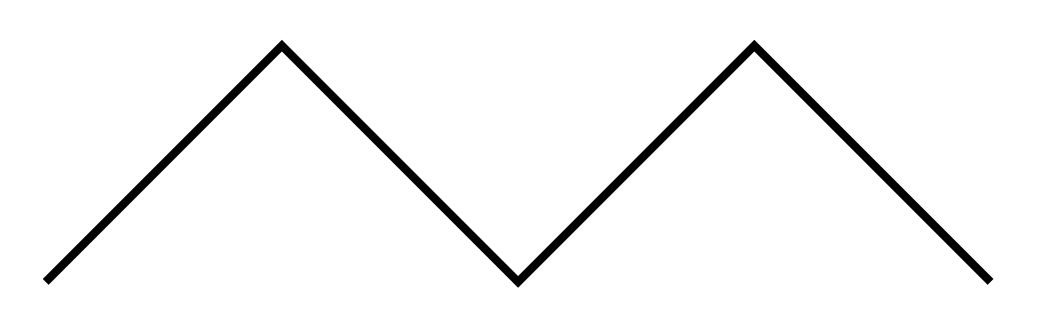
Show the TikZ code
% --------------------------------------------- %% Tikzfigure generated by tikzfigure v0.5.0 %% https://github.com/max-models/tikzfigure %% --------------------------------------------- %\begin{tikzpicture} \draw[line width=2] (0, 0) to[color=red] (2, 2) to[dashed, color=blue, line width=1.5] (4, 0) to[color=green!60!black, line width=3] (6, 2) to[dotted, color=purple, line width=2] (8, 0);\end{tikzpicture}Show the standalone LaTeX document
\documentclass[border=10pt]{standalone}\PassOptionsToPackage{dvipsnames,svgnames,x11names}{xcolor}\usepackage{tikz}\usepackage{pgfplots}\pgfplotsset{compat=newest}\usepgfplotslibrary{groupplots}\usetikzlibrary{arrows.meta}\begin{document}% --------------------------------------------- %% Tikzfigure generated by tikzfigure v0.5.0     %% https://github.com/max-models/tikzfigure      %% --------------------------------------------- %\begin{tikzpicture}    \draw[line width=2] (0, 0)        to[color=red]        (2, 2)        to[dashed, color=blue, line width=1.5]        (4, 0)        to[color=green!60!black, line width=3]        (6, 2)        to[dotted, color=purple, line width=2]        (8, 0);\end{tikzpicture}
\end{document}
Per-segment bending works the same way. Here three nodes are connected with arrows where each segment curves in a different direction:
fig = TikzFigure()
specs = [("src", 0, 1, "teal"), ("mid", 4, 3, "orange"), ("dst", 8, 1, "purple")]for label, x, y, color in specs:    fig.node(        (x, y),        label=label,        shape="circle",        fill=f"{color}!25",        draw=f"{color}!70",        minimum_size=1.0 * units.cm,        content=label.upper(),    )
fig.draw(    ["src.center", "mid.center", "dst.center"],    arrows=arrows.forward,    options=[styles.thick],    segment_options=[        {"bend_left": 30},  # src → mid curves upward-left        {"bend_right": 25},  # mid → dst curves downward-right    ],)
fig.show()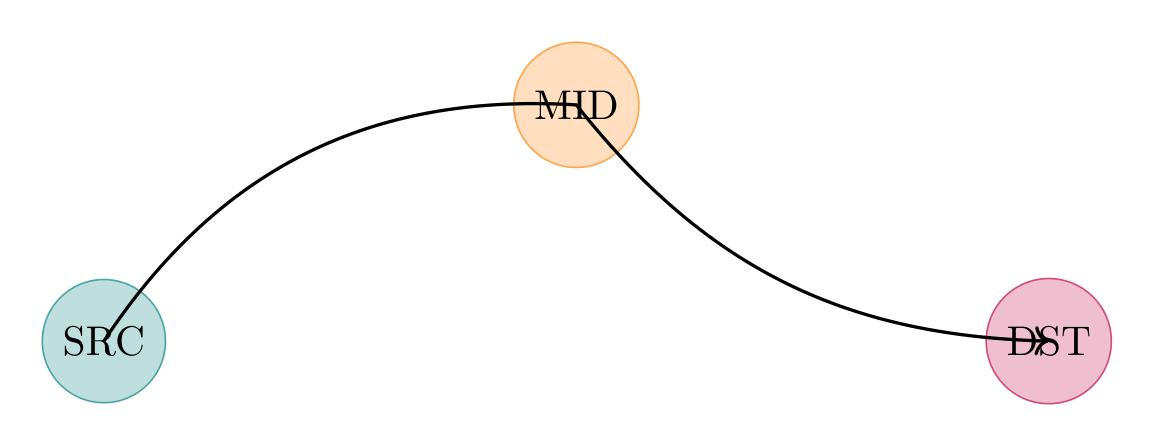
Show the TikZ code
% --------------------------------------------- %% Tikzfigure generated by tikzfigure v0.5.0 %% https://github.com/max-models/tikzfigure %% --------------------------------------------- %\begin{tikzpicture} \node[shape=circle, fill=teal!25, draw=teal!70, minimum size=1cm] (src) at ({0}, {1}) {SRC}; \node[shape=circle, fill=orange!25, draw=orange!70, minimum size=1cm] (mid) at ({4}, {3}) {MID}; \node[shape=circle, fill=purple!25, draw=purple!70, minimum size=1cm] (dst) at ({8}, {1}) {DST}; \draw[thick, ->] (src.center) to[bend left=30] (mid.center) to[bend right=25] (dst.center);\end{tikzpicture}Show the standalone LaTeX document
\documentclass[border=10pt]{standalone}\PassOptionsToPackage{dvipsnames,svgnames,x11names}{xcolor}\usepackage{tikz}\usepackage{pgfplots}\pgfplotsset{compat=newest}\usepgfplotslibrary{groupplots}\usetikzlibrary{arrows.meta}\begin{document}% --------------------------------------------- %% Tikzfigure generated by tikzfigure v0.5.0     %% https://github.com/max-models/tikzfigure      %% --------------------------------------------- %\begin{tikzpicture}    \node[shape=circle, fill=teal!25, draw=teal!70, minimum size=1cm] (src) at ({0}, {1}) {SRC};    \node[shape=circle, fill=orange!25, draw=orange!70, minimum size=1cm] (mid) at ({4}, {3}) {MID};    \node[shape=circle, fill=purple!25, draw=purple!70, minimum size=1cm] (dst) at ({8}, {1}) {DST};    \draw[thick, ->] (src.center) to[bend left=30] (mid.center) to[bend right=25] (dst.center);\end{tikzpicture}
\end{document}
Fluent node chaining
Section titled “Fluent node chaining”If you’re connecting named nodes, .to(...) is a concise alternative to
building segment_options by hand. Options passed to .to(...) affect only
that connector.
fig = TikzFigure()
A = fig.node(    (0, 1),    label="A",    shape="circle",    fill="teal!25",    draw="teal!70",    minimum_size=1.0 * units.cm,    content="A",)B = fig.node(    (4, 3),    label="B",    shape="circle",    fill="orange!25",    draw="orange!70",    minimum_size="1cm",    content="B",)C = fig.node(    (8, 1),    label="C",    shape="circle",    fill="purple!25",    draw="purple!70",    minimum_size="1cm",    content="C",)
fig.draw(    A.to(B).to(C, options=styles.bend_left()),    arrows=arrows.forward,    options=[styles.thick],    color="teal!70",)
fig.show()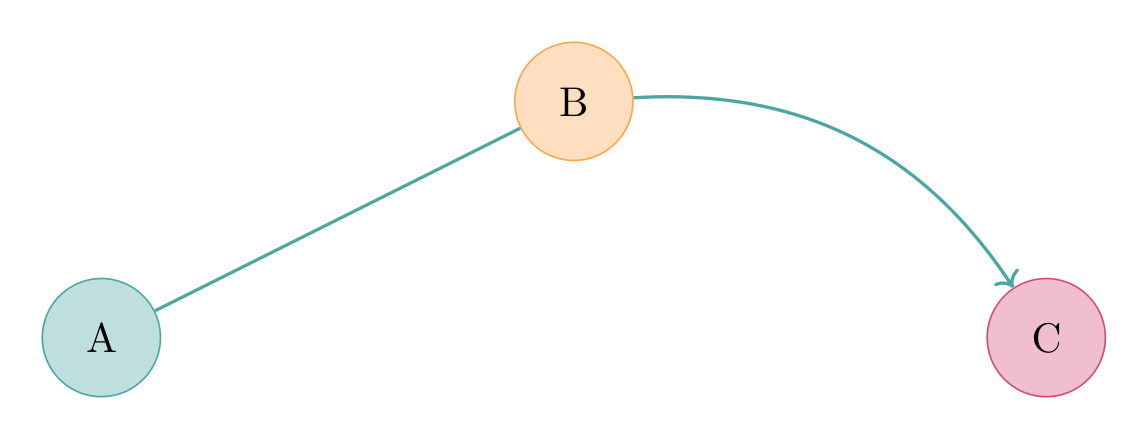
Show the TikZ code
% --------------------------------------------- %% Tikzfigure generated by tikzfigure v0.5.0 %% https://github.com/max-models/tikzfigure %% --------------------------------------------- %\begin{tikzpicture} \node[shape=circle, fill=teal!25, draw=teal!70, minimum size=1cm] (A) at ({0}, {1}) {A}; \node[shape=circle, fill=orange!25, draw=orange!70, minimum size=1cm] (B) at ({4}, {3}) {B}; \node[shape=circle, fill=purple!25, draw=purple!70, minimum size=1cm] (C) at ({8}, {1}) {C}; \draw[thick, ->, color=teal!70] (A) to (B) to[bend left] (C);\end{tikzpicture}Show the standalone LaTeX document
\documentclass[border=10pt]{standalone}\PassOptionsToPackage{dvipsnames,svgnames,x11names}{xcolor}\usepackage{tikz}\usepackage{pgfplots}\pgfplotsset{compat=newest}\usepgfplotslibrary{groupplots}\usetikzlibrary{arrows.meta}\begin{document}% --------------------------------------------- %% Tikzfigure generated by tikzfigure v0.5.0     %% https://github.com/max-models/tikzfigure      %% --------------------------------------------- %\begin{tikzpicture}    \node[shape=circle, fill=teal!25, draw=teal!70, minimum size=1cm] (A) at ({0}, {1}) {A};    \node[shape=circle, fill=orange!25, draw=orange!70, minimum size=1cm] (B) at ({4}, {3}) {B};    \node[shape=circle, fill=purple!25, draw=purple!70, minimum size=1cm] (C) at ({8}, {1}) {C};    \draw[thick, ->, color=teal!70] (A) to (B) to[bend left] (C);\end{tikzpicture}
\end{document}
Arc segments fit into the same fluent API. Unlike .to(...), .arc(...) does
not consume another waypoint — it appends a TikZ arc[...] operation at the
current point, and you can keep chaining afterward:
fig = TikzFigure()
A = fig.node(    (0, 0),    label="A",    shape="circle",    fill="teal!25",    draw="teal!70",    minimum_size="1cm",    content="A",)B = fig.node(    (4, 0),    label="B",    shape="circle",    fill="orange!25",    draw="orange!70",    minimum_size="1cm",    content="B",)C = fig.node(    (7, 1.5),    label="C",    shape="circle",    fill="purple!25",    draw="purple!70",    minimum_size="1cm",    content="C",)
fig.draw(    A.to(B)    .arc(start_angle=-90, end_angle=90, radius="1.5cm")    .to(C, options=styles.bend_right()),    arrows=arrows.forward,    options=[styles.thick],    color="blue!70",)
fig.show()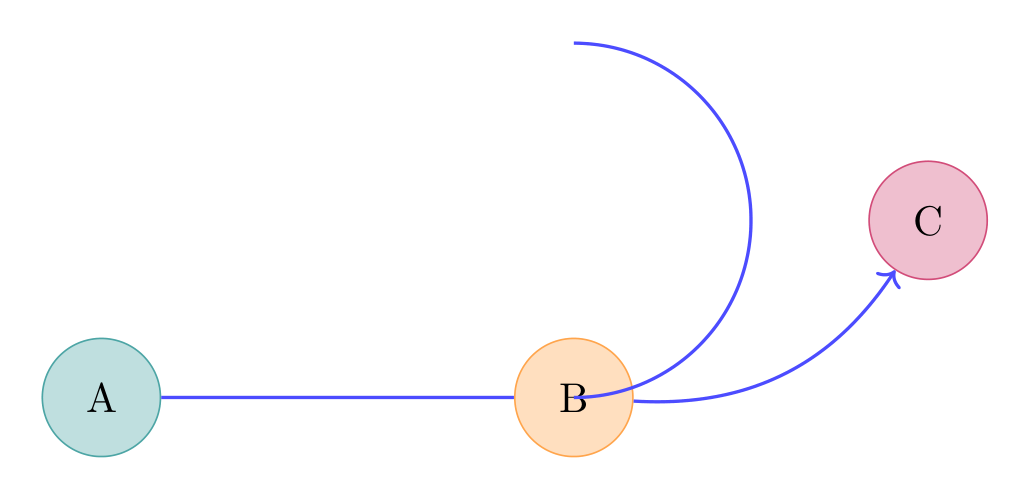
Show the TikZ code
% --------------------------------------------- %% Tikzfigure generated by tikzfigure v0.5.0 %% https://github.com/max-models/tikzfigure %% --------------------------------------------- %\begin{tikzpicture} \node[shape=circle, fill=teal!25, draw=teal!70, minimum size=1cm] (A) at ({0}, {0}) {A}; \node[shape=circle, fill=orange!25, draw=orange!70, minimum size=1cm] (B) at ({4}, {0}) {B}; \node[shape=circle, fill=purple!25, draw=purple!70, minimum size=1cm] (C) at ({7}, {1.5}) {C}; \draw[thick, ->, color=blue!70] (A) to (B) arc[start angle=-90, end angle=90, radius=1.5cm] to[bend right] (C);\end{tikzpicture}Show the standalone LaTeX document
\documentclass[border=10pt]{standalone}\PassOptionsToPackage{dvipsnames,svgnames,x11names}{xcolor}\usepackage{tikz}\usepackage{pgfplots}\pgfplotsset{compat=newest}\usepgfplotslibrary{groupplots}\usetikzlibrary{arrows.meta}\begin{document}% --------------------------------------------- %% Tikzfigure generated by tikzfigure v0.5.0     %% https://github.com/max-models/tikzfigure      %% --------------------------------------------- %\begin{tikzpicture}    \node[shape=circle, fill=teal!25, draw=teal!70, minimum size=1cm] (A) at ({0}, {0}) {A};    \node[shape=circle, fill=orange!25, draw=orange!70, minimum size=1cm] (B) at ({4}, {0}) {B};    \node[shape=circle, fill=purple!25, draw=purple!70, minimum size=1cm] (C) at ({7}, {1.5}) {C};    \draw[thick, ->, color=blue!70] (A) to (B) arc[start angle=-90, end angle=90, radius=1.5cm] to[bend right] (C);\end{tikzpicture}
\end{document}
Use "out" and "in" keys for explicit departure and arrival angles (in
degrees). This gives precise control over how each segment enters and leaves its
endpoints — useful when bend_left/bend_right doesn’t give you the exact
shape you need:
fig = TikzFigure()
for label, x, y, color in [    ("A", 0, 2, "blue"),    ("B", 5, 4, "orange"),    ("C", 10, 2, "purple"),]:    fig.node(        (x, y),        label=label,        shape="circle",        fill=f"{color}!20",        draw=f"{color}!70",        minimum_size="1.2cm",        content=f"${label}$",    )
fig.draw(    ["A.center", "B.center", "C.center"],    arrows=arrows.forward,    options=[styles.thick],    segment_options=[        {"out": 45, "in": 195},  # A→B: leave at 45°, arrive at 195°        {"out": -15, "in": 135},  # B→C: leave at -15°, arrive at 135°    ],)
fig.show()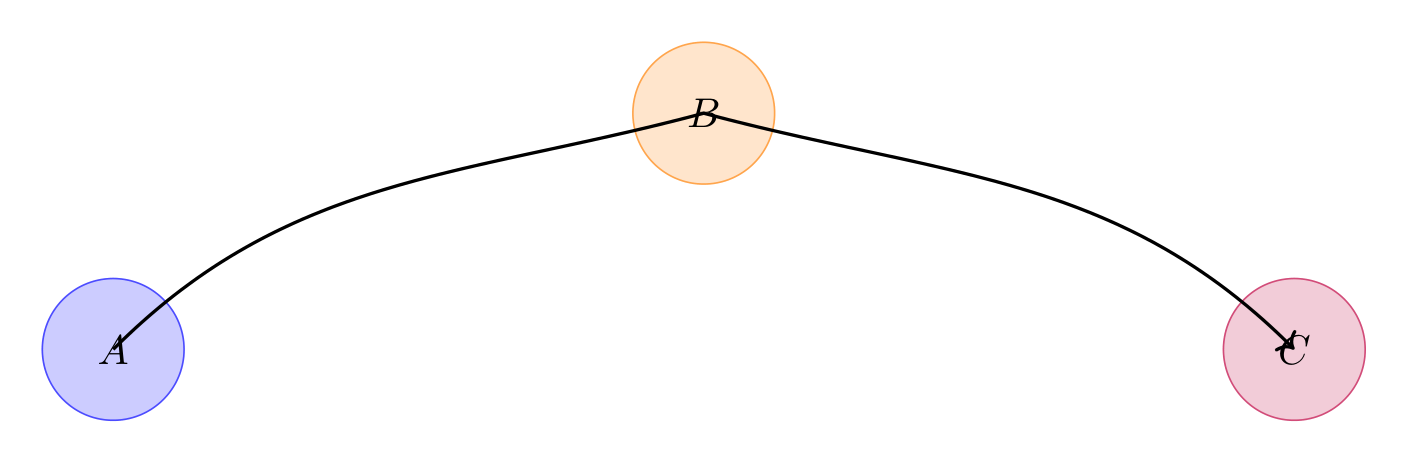
Show the TikZ code
% --------------------------------------------- %% Tikzfigure generated by tikzfigure v0.5.0 %% https://github.com/max-models/tikzfigure %% --------------------------------------------- %\begin{tikzpicture} \node[shape=circle, fill=blue!20, draw=blue!70, minimum size=1.2cm] (A) at ({0}, {2}) {$A$}; \node[shape=circle, fill=orange!20, draw=orange!70, minimum size=1.2cm] (B) at ({5}, {4}) {$B$}; \node[shape=circle, fill=purple!20, draw=purple!70, minimum size=1.2cm] (C) at ({10}, {2}) {$C$}; \draw[thick, ->] (A.center) to[out=45, in=195] (B.center) to[out=-15, in=135] (C.center);\end{tikzpicture}Show the standalone LaTeX document
\documentclass[border=10pt]{standalone}\PassOptionsToPackage{dvipsnames,svgnames,x11names}{xcolor}\usepackage{tikz}\usepackage{pgfplots}\pgfplotsset{compat=newest}\usepgfplotslibrary{groupplots}\usetikzlibrary{arrows.meta}\begin{document}% --------------------------------------------- %% Tikzfigure generated by tikzfigure v0.5.0     %% https://github.com/max-models/tikzfigure      %% --------------------------------------------- %\begin{tikzpicture}    \node[shape=circle, fill=blue!20, draw=blue!70, minimum size=1.2cm] (A) at ({0}, {2}) {$A$};    \node[shape=circle, fill=orange!20, draw=orange!70, minimum size=1.2cm] (B) at ({5}, {4}) {$B$};    \node[shape=circle, fill=purple!20, draw=purple!70, minimum size=1.2cm] (C) at ({10}, {2}) {$C$};    \draw[thick, ->] (A.center) to[out=45, in=195] (B.center) to[out=-15, in=135] (C.center);\end{tikzpicture}
\end{document}
looseness scales how far the control handles extend, making the same bend
either tighter (looseness < 1) or more exaggerated (looseness > 1). Here the
two segments of the same symmetric path use opposite looseness values:
fig = TikzFigure()
for label, x, y in [("A", 0, 2), ("B", 5, 2), ("C", 10, 2)]:    fig.node(        (x, y),        label=label,        shape="circle",        fill="gray!15",        draw="gray!60",        minimum_size="1cm",        content=f"${label}$",    )
fig.draw(    ["A.center", "B.center", "C.center"],    arrows=arrows.forward,    options=[styles.thick],    segment_options=[        {"bend_left": 50, "looseness": 2.5},  # A→B: wide exaggerated arc        {"bend_right": 50, "looseness": 0.5},  # B→C: tight compressed arc    ],)
fig.show()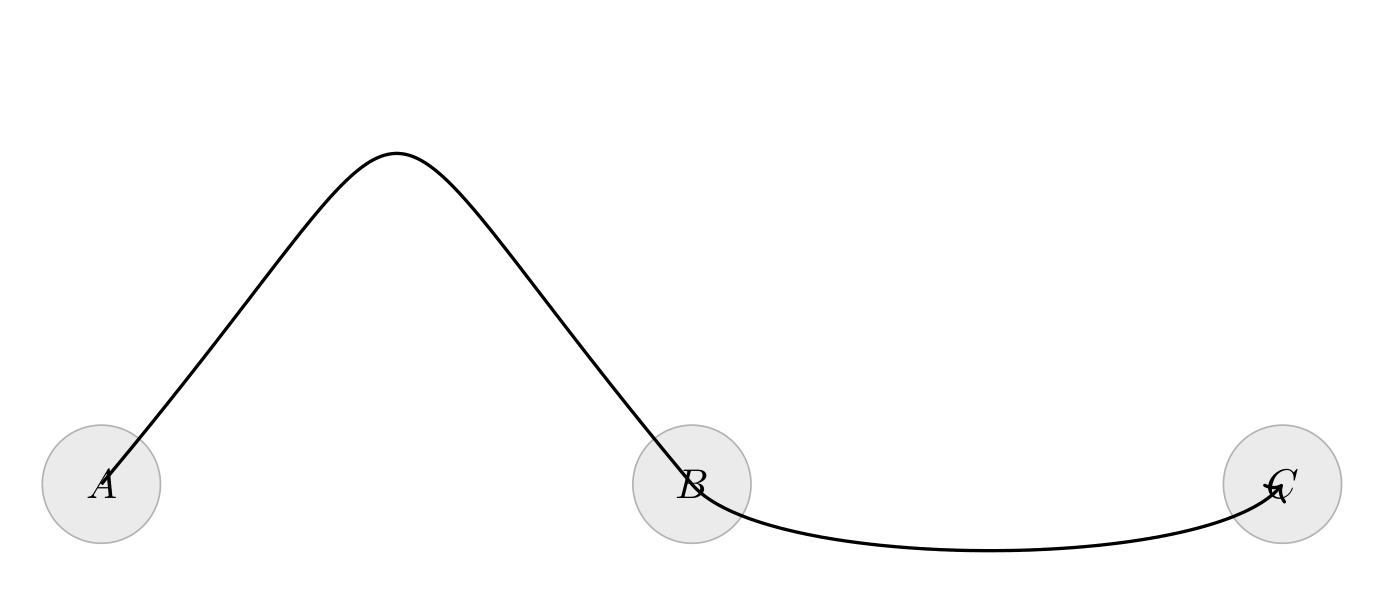
Show the TikZ code
% --------------------------------------------- %% Tikzfigure generated by tikzfigure v0.5.0 %% https://github.com/max-models/tikzfigure %% --------------------------------------------- %\begin{tikzpicture} \node[shape=circle, fill=gray!15, draw=gray!60, minimum size=1cm] (A) at ({0}, {2}) {$A$}; \node[shape=circle, fill=gray!15, draw=gray!60, minimum size=1cm] (B) at ({5}, {2}) {$B$}; \node[shape=circle, fill=gray!15, draw=gray!60, minimum size=1cm] (C) at ({10}, {2}) {$C$}; \draw[thick, ->] (A.center) to[bend left=50, looseness=2.5] (B.center) to[bend right=50, looseness=0.5] (C.center);\end{tikzpicture}Show the standalone LaTeX document
\documentclass[border=10pt]{standalone}\PassOptionsToPackage{dvipsnames,svgnames,x11names}{xcolor}\usepackage{tikz}\usepackage{pgfplots}\pgfplotsset{compat=newest}\usepgfplotslibrary{groupplots}\usetikzlibrary{arrows.meta}\begin{document}% --------------------------------------------- %% Tikzfigure generated by tikzfigure v0.5.0     %% https://github.com/max-models/tikzfigure      %% --------------------------------------------- %\begin{tikzpicture}    \node[shape=circle, fill=gray!15, draw=gray!60, minimum size=1cm] (A) at ({0}, {2}) {$A$};    \node[shape=circle, fill=gray!15, draw=gray!60, minimum size=1cm] (B) at ({5}, {2}) {$B$};    \node[shape=circle, fill=gray!15, draw=gray!60, minimum size=1cm] (C) at ({10}, {2}) {$C$};    \draw[thick, ->] (A.center) to[bend left=50, looseness=2.5] (B.center) to[bend right=50, looseness=0.5] (C.center);\end{tikzpicture}
\end{document}
All segment options can be combined freely. Here each segment gets its own
color, line style, and curve geometry in a single draw call:
fig = TikzFigure()
for label, x, y, color in [    ("A", 0, 0, "teal"),    ("B", 4, 3, "red"),    ("C", 8, 0, "blue"),]:    fig.node(        (x, y),        label=label,        shape="circle",        fill=f"{color}!20",        draw=f"{color}!60",        minimum_size="1.2cm",        content=f"${label}$",    )
fig.draw(    ["A.center", "B.center", "C.center"],    segment_options=[        {  # A→B            "options": [arrows.forward],            "color": "teal!80",            "line_width": 2,            "out": 60,            "in": 240,        },        {  # B→C            "options": [arrows.forward, styles.dashed],            "color": "red!70",            "line_width": 1.5,            "out": -60,            "in": 120,        },    ],)
fig.show()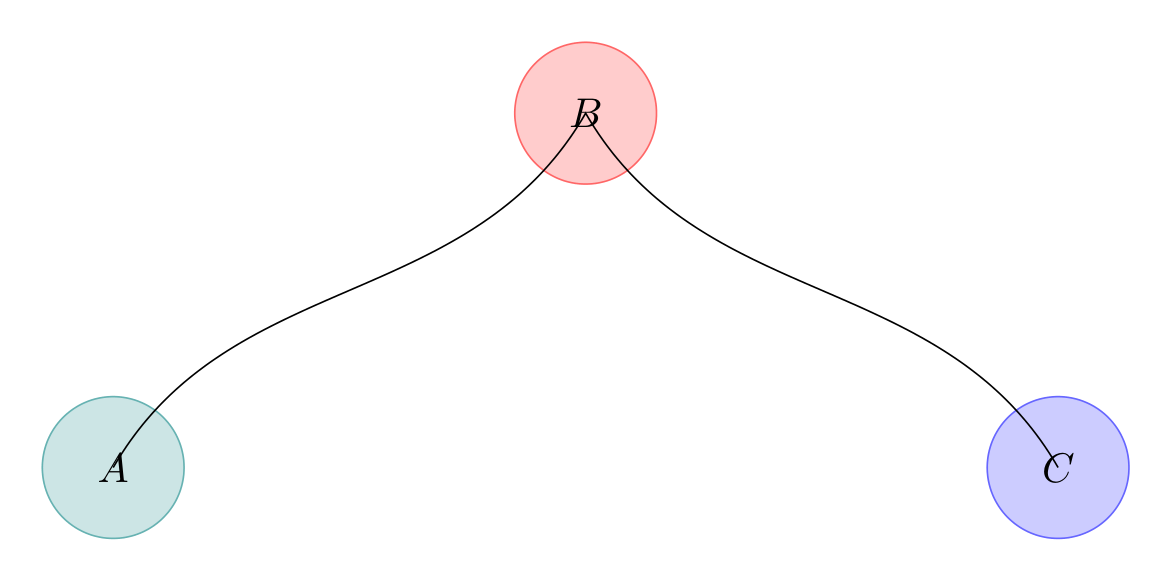
Show the TikZ code
% --------------------------------------------- %% Tikzfigure generated by tikzfigure v0.5.0 %% https://github.com/max-models/tikzfigure %% --------------------------------------------- %\begin{tikzpicture} \node[shape=circle, fill=teal!20, draw=teal!60, minimum size=1.2cm] (A) at ({0}, {0}) {$A$}; \node[shape=circle, fill=red!20, draw=red!60, minimum size=1.2cm] (B) at ({4}, {3}) {$B$}; \node[shape=circle, fill=blue!20, draw=blue!60, minimum size=1.2cm] (C) at ({8}, {0}) {$C$}; \draw (A.center) to[->, color=teal!80, line width=2, out=60, in=240] (B.center) to[->, dashed, color=red!70, line width=1.5, out=-60, in=120] (C.center);\end{tikzpicture}Show the standalone LaTeX document
\documentclass[border=10pt]{standalone}\PassOptionsToPackage{dvipsnames,svgnames,x11names}{xcolor}\usepackage{tikz}\usepackage{pgfplots}\pgfplotsset{compat=newest}\usepgfplotslibrary{groupplots}\usetikzlibrary{arrows.meta}\begin{document}% --------------------------------------------- %% Tikzfigure generated by tikzfigure v0.5.0     %% https://github.com/max-models/tikzfigure      %% --------------------------------------------- %\begin{tikzpicture}    \node[shape=circle, fill=teal!20, draw=teal!60, minimum size=1.2cm] (A) at ({0}, {0}) {$A$};    \node[shape=circle, fill=red!20, draw=red!60, minimum size=1.2cm] (B) at ({4}, {3}) {$B$};    \node[shape=circle, fill=blue!20, draw=blue!60, minimum size=1.2cm] (C) at ({8}, {0}) {$C$};    \draw (A.center) to[->, color=teal!80, line width=2, out=60, in=240] (B.center) to[->, dashed, color=red!70, line width=1.5, out=-60, in=120] (C.center);\end{tikzpicture}
\end{document}
Node paths and .center anchors
Section titled “Node paths and .center anchors”When you fill a closed path that goes through named nodes, TikZ routes to each node’s border by default. For circular nodes this means the filled area has indented corners — it doesn’t look like a triangle.
Appending .center to a node label in the path list routes the segment through
the node’s geometric center instead. The path then bounds a proper filled
polygon.
fig = TikzFigure()
node_specs = [    ("top", 3, 4, "blue", r"$v_1$"),    ("bl", 0, 0, "blue", r"$v_2$"),    ("br", 6, 0, "blue", r"$v_3$"),]for label, x, y, color, text in node_specs:    fig.node(        (x, y),        label=label,        shape="circle",        draw=f"{color}!60",        fill="white",        minimum_size="1.4cm",        content=text,    )
# Border anchors: the fill "leaks" under the node circlesfig.draw(    ["top", "bl", "br"],    cycle=True,    fill="red!25",    draw="red!60",    line_width=1,    fill_opacity=0.6,)
# .center anchors: fills the exact triangle spanned by node centresfig.draw(    ["top.center", "bl.center", "br.center"],    cycle=True,    fill="blue!30",    draw="blue!70",    line_width=1.5,    fill_opacity=0.7,)
# Labels outside the shapesfig.node(    (7.5, 2),    content=r"\textcolor{red!60}{border anchors}",    draw="none",    anchor="west",    font=r"\small",)fig.node(    (7.5, 1),    content=r"\textcolor{blue!70}{.center anchors}",    draw="none",    anchor="west",    font=r"\small",)
fig.show()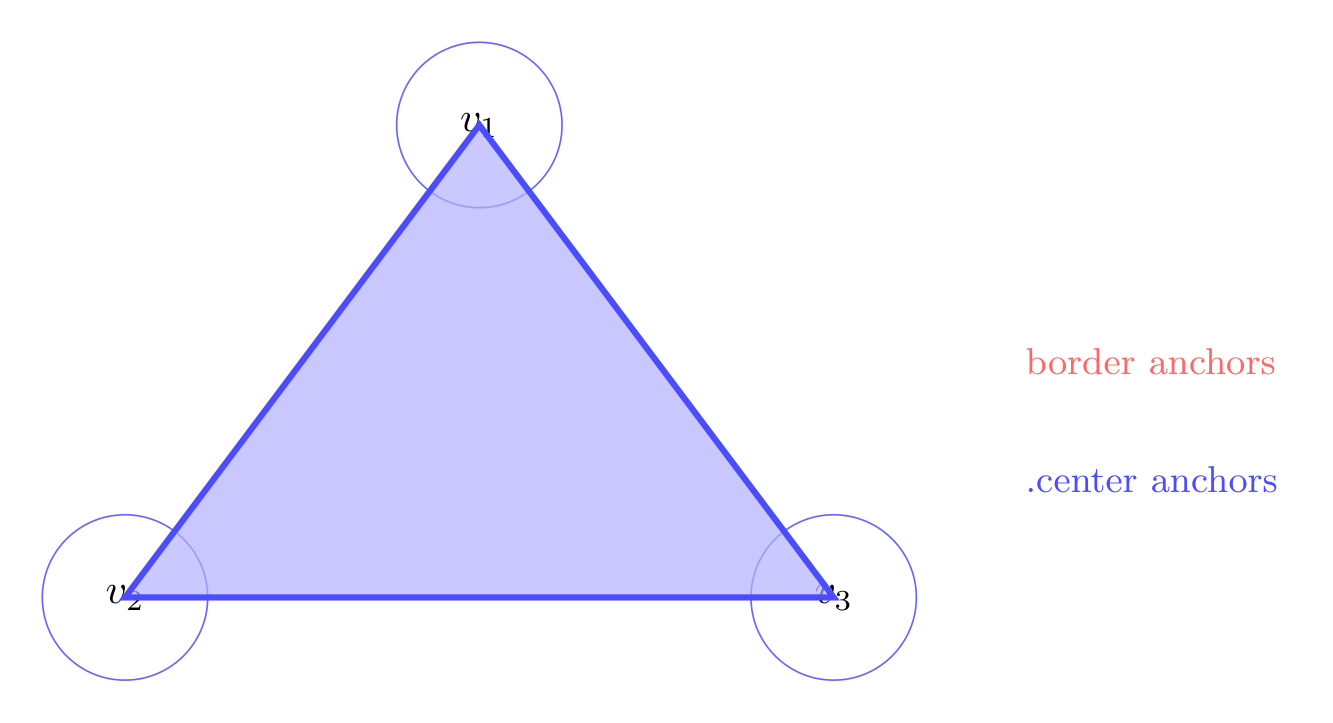
Show the TikZ code
% --------------------------------------------- %% Tikzfigure generated by tikzfigure v0.5.0 %% https://github.com/max-models/tikzfigure %% --------------------------------------------- %\begin{tikzpicture} \node[shape=circle, fill=white, draw=blue!60, minimum size=1.4cm] (top) at ({3}, {4}) {$v_1$}; \node[shape=circle, fill=white, draw=blue!60, minimum size=1.4cm] (bl) at ({0}, {0}) {$v_2$}; \node[shape=circle, fill=white, draw=blue!60, minimum size=1.4cm] (br) at ({6}, {0}) {$v_3$}; \draw[fill=red!25, draw=red!60, fill opacity=0.6, line width=1] (top) to (bl) to (br) -- cycle; \draw[fill=blue!30, draw=blue!70, fill opacity=0.7, line width=1.5] (top.center) to (bl.center) to (br.center) -- cycle; \node[draw=none, font=\small, anchor=west] (node3) at ({7.5}, {2}) {\textcolor{red!60}{border anchors}}; \node[draw=none, font=\small, anchor=west] (node4) at ({7.5}, {1}) {\textcolor{blue!70}{.center anchors}};\end{tikzpicture}Show the standalone LaTeX document
\documentclass[border=10pt]{standalone}\PassOptionsToPackage{dvipsnames,svgnames,x11names}{xcolor}\usepackage{tikz}\usepackage{pgfplots}\pgfplotsset{compat=newest}\usepgfplotslibrary{groupplots}\usetikzlibrary{arrows.meta}\begin{document}% --------------------------------------------- %% Tikzfigure generated by tikzfigure v0.5.0     %% https://github.com/max-models/tikzfigure      %% --------------------------------------------- %\begin{tikzpicture}    \node[shape=circle, fill=white, draw=blue!60, minimum size=1.4cm] (top) at ({3}, {4}) {$v_1$};    \node[shape=circle, fill=white, draw=blue!60, minimum size=1.4cm] (bl) at ({0}, {0}) {$v_2$};    \node[shape=circle, fill=white, draw=blue!60, minimum size=1.4cm] (br) at ({6}, {0}) {$v_3$};    \draw[fill=red!25, draw=red!60, fill opacity=0.6, line width=1] (top) to (bl) to (br) -- cycle;    \draw[fill=blue!30, draw=blue!70, fill opacity=0.7, line width=1.5] (top.center) to (bl.center) to (br.center) -- cycle;    \node[draw=none, font=\small, anchor=west] (node3) at ({7.5}, {2}) {\textcolor{red!60}{border anchors}};    \node[draw=none, font=\small, anchor=west] (node4) at ({7.5}, {1}) {\textcolor{blue!70}{.center anchors}};\end{tikzpicture}
\end{document}
You can mix anchors: only the nodes that need a specific anchor require the dot
suffix. Any TikZ anchor string works — "north", "south east", "west", etc.
fig = TikzFigure()
fig.node(    (0, 0),    label="A",    shape="rectangle",    draw="black",    fill="gray!15",    minimum_width="2cm",    minimum_height="1cm",    content="A",)fig.node(    (5, 2),    label="B",    shape="rectangle",    draw="black",    fill="gray!15",    minimum_width="2cm",    minimum_height="1cm",    content="B",)fig.node(    (10, 0),    label="C",    shape="rectangle",    draw="black",    fill="gray!15",    minimum_width="2cm",    minimum_height="1cm",    content="C",)
# Connect from the east side of A, enter B from the west, leave from east, arrive at C.westfig.draw(    ["A.east", "B.west"],    arrows=arrows.forward,    options=[styles.thick],    color="teal",    segment_options=[{"bend_left": 15}],)fig.draw(    ["B.east", "C.west"],    arrows=arrows.forward,    options=[styles.thick],    color="orange",    segment_options=[{"bend_right": 15}],)
fig.show()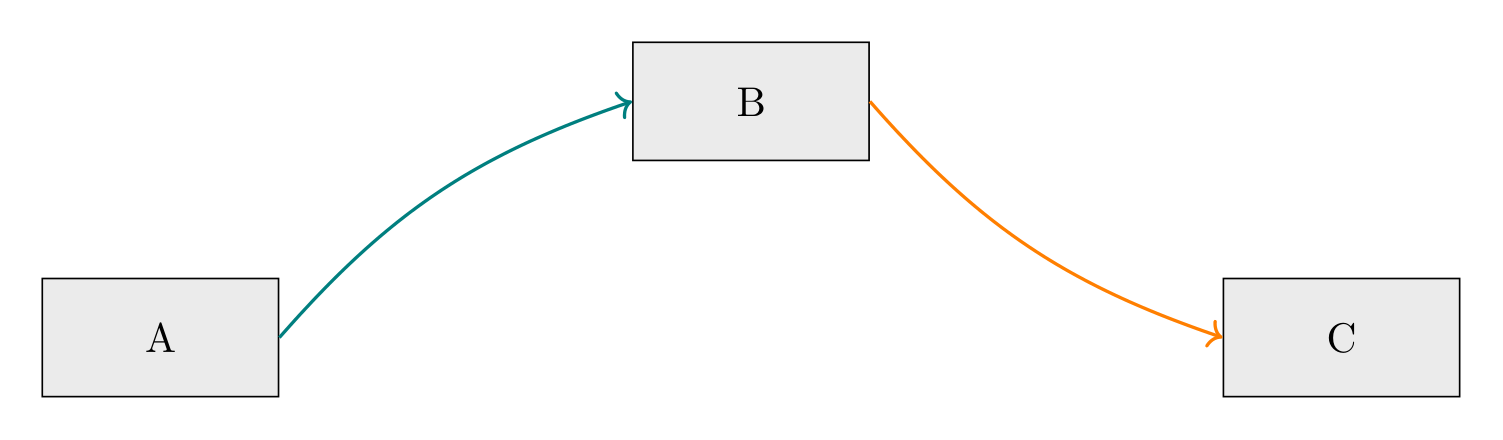
Show the TikZ code
% --------------------------------------------- %% Tikzfigure generated by tikzfigure v0.5.0 %% https://github.com/max-models/tikzfigure %% --------------------------------------------- %\begin{tikzpicture} \node[shape=rectangle, fill=gray!15, draw=black, minimum width=2cm, minimum height=1cm] (A) at ({0}, {0}) {A}; \node[shape=rectangle, fill=gray!15, draw=black, minimum width=2cm, minimum height=1cm] (B) at ({5}, {2}) {B}; \node[shape=rectangle, fill=gray!15, draw=black, minimum width=2cm, minimum height=1cm] (C) at ({10}, {0}) {C}; \draw[thick, ->, color=teal] (A.east) to[bend left=15] (B.west); \draw[thick, ->, color=orange] (B.east) to[bend right=15] (C.west);\end{tikzpicture}Show the standalone LaTeX document
\documentclass[border=10pt]{standalone}\PassOptionsToPackage{dvipsnames,svgnames,x11names}{xcolor}\usepackage{tikz}\usepackage{pgfplots}\pgfplotsset{compat=newest}\usepgfplotslibrary{groupplots}\usetikzlibrary{arrows.meta}\begin{document}% --------------------------------------------- %% Tikzfigure generated by tikzfigure v0.5.0     %% https://github.com/max-models/tikzfigure      %% --------------------------------------------- %\begin{tikzpicture}    \node[shape=rectangle, fill=gray!15, draw=black, minimum width=2cm, minimum height=1cm] (A) at ({0}, {0}) {A};    \node[shape=rectangle, fill=gray!15, draw=black, minimum width=2cm, minimum height=1cm] (B) at ({5}, {2}) {B};    \node[shape=rectangle, fill=gray!15, draw=black, minimum width=2cm, minimum height=1cm] (C) at ({10}, {0}) {C};    \draw[thick, ->, color=teal] (A.east) to[bend left=15] (B.west);    \draw[thick, ->, color=orange] (B.east) to[bend right=15] (C.west);\end{tikzpicture}
\end{document}
Heart shape
Section titled “Heart shape”A heart with circular lobes drawn by fig.arc() and a pointed bottom built from
a chained path.
width, height = 1.75, 2.0
fig = TikzFigure()
fig.colorlet("lightred", "red!40!white")
A = fig.node(-width, height)B = fig.node((0, 0))C = fig.node(width, height)D = fig.node(0, height)
fig.draw(    A.to(B, options=["out=-90, in=135"])    .to(C, options=["out=45, in=-90"])    .to(D, options=["in=80, out=100"])    .to(A, options=["in=80, out=100"]),    color="red",    line_width=4,    cycle=True,    center=True,    fill="lightred",)
fig.show()
Show the TikZ code
% --------------------------------------------- %% Tikzfigure generated by tikzfigure v0.5.0 %% https://github.com/max-models/tikzfigure %% --------------------------------------------- %\begin{tikzpicture} \colorlet{lightred}{red!40!white} \node (node0) at ({-1.75}, {2.0}) {}; \node (node1) at ({0}, {0}) {}; \node (node2) at ({1.75}, {2.0}) {}; \node (node3) at ({0}, {2.0}) {}; \draw[color=red, fill=lightred, line width=4] (node0.center) to[out=-90, in=135] (node1.center) to[out=45, in=-90] (node2.center) to[in=80, out=100] (node3.center) to[in=80, out=100] (node0.center) -- cycle;\end{tikzpicture}Show the standalone LaTeX document
\documentclass[border=10pt]{standalone}\PassOptionsToPackage{dvipsnames,svgnames,x11names}{xcolor}\usepackage{tikz}\usepackage{pgfplots}\pgfplotsset{compat=newest}\usepgfplotslibrary{groupplots}\usetikzlibrary{arrows.meta}\begin{document}% --------------------------------------------- %% Tikzfigure generated by tikzfigure v0.5.0     %% https://github.com/max-models/tikzfigure      %% --------------------------------------------- %\begin{tikzpicture}    \colorlet{lightred}{red!40!white}    \node (node0) at ({-1.75}, {2.0}) {};    \node (node1) at ({0}, {0}) {};    \node (node2) at ({1.75}, {2.0}) {};    \node (node3) at ({0}, {2.0}) {};    \draw[color=red, fill=lightred, line width=4] (node0.center)        to[out=-90, in=135]        (node1.center)        to[out=45, in=-90]        (node2.center)        to[in=80, out=100]        (node3.center)        to[in=80, out=100]        (node0.center) -- cycle;\end{tikzpicture}
\end{document}
Star shape
Section titled “Star shape”A five-pointed star drawn from six points (the last one closes back to the first).
fig = TikzFigure()
star = [[0, 0], [1, 2.5], [2, 0], [-0.5, 1.5], [2.5, 1.5], [0, 0]]
fig.draw(    star,    line_width=3,    cycle=True,    color="Gold",    fill="yellow!50!white",)
fig.show()print(fig)
% --------------------------------------------- %% Tikzfigure generated by tikzfigure v0.5.0 %% https://github.com/max-models/tikzfigure %% --------------------------------------------- %\begin{tikzpicture} \draw[color=Gold, fill=yellow!50!white, line width=3] (0, 0) to (1, 2.5) to (2, 0) to (-0.5, 1.5) to (2.5, 1.5) to (0, 0) -- cycle;\end{tikzpicture}Show the TikZ code
% --------------------------------------------- %% Tikzfigure generated by tikzfigure v0.5.0 %% https://github.com/max-models/tikzfigure %% --------------------------------------------- %\begin{tikzpicture} \draw[color=Gold, fill=yellow!50!white, line width=3] (0, 0) to (1, 2.5) to (2, 0) to (-0.5, 1.5) to (2.5, 1.5) to (0, 0) -- cycle;\end{tikzpicture}Show the standalone LaTeX document
\documentclass[border=10pt]{standalone}\PassOptionsToPackage{dvipsnames,svgnames,x11names}{xcolor}\usepackage{tikz}\usepackage{pgfplots}\pgfplotsset{compat=newest}\usepgfplotslibrary{groupplots}\usetikzlibrary{arrows.meta}\begin{document}% --------------------------------------------- %% Tikzfigure generated by tikzfigure v0.5.0     %% https://github.com/max-models/tikzfigure      %% --------------------------------------------- %\begin{tikzpicture}    \draw[color=Gold, fill=yellow!50!white, line width=3] (0, 0)        to        (1, 2.5)        to        (2, 0)        to        (-0.5, 1.5)        to        (2.5, 1.5)        to        (0, 0) -- cycle;\end{tikzpicture}
\end{document}
Parametric curves with NumPy
Section titled “Parametric curves with NumPy”Any iterable of (x, y) pairs works as a path, so NumPy arrays plug in
naturally for smooth parametric curves.
fig = TikzFigure()
# SpiralN = 300theta = np.linspace(0, 8 * np.pi, N)r = np.linspace(0.1, 3, N)spiral = list(    zip(r * np.cos(theta) + 4, r * np.sin(theta) + 4),)fig.draw(spiral, line_width=2, color="teal")
fig.show()
Show the TikZ code
% --------------------------------------------- %% Tikzfigure generated by tikzfigure v0.5.0 %% https://github.com/max-models/tikzfigure %% --------------------------------------------- %\begin{tikzpicture} \draw[color=teal, line width=2] (4.1, 4.0) to (4.109311690604932, 4.009210003491806) to (4.117714771684789, 4.0199778210498645) to (4.125014140190605, 4.0322102091087375) to (4.1310244108487, 4.0457922445851455) to (4.135572170308709, 4.060588337957058) to (4.138498126494149, 4.076443470909478) to (4.139659131447931, 4.093184647828918) to (4.138930057047688, 4.110622548377246) to (4.136205504238648, 4.1285533664322065) to (4.131401327884473, 4.146760818863925) to (4.1244559609566736, 4.16501830594048) to (4.115331523557323, 4.183091203636362) to (4.1040147041826955, 4.200739266769233) to (4.090517402670937, 4.217719120725341) to (4.074877126417452, 4.233786818563121) to (4.057157133669126, 4.248700439517244) to (4.037446320003529, 4.262222704369247) to (4.015858846442181, 4.274123582811634) to (3.992533510017395, 4.2841828678139935) to (3.9676328599896475, 4.292192692104246) to (3.941342065276122, 4.297959962205803) to (3.9138675409802377, 4.30130868602048) to (3.885435344186258, 4.302082170713749) to (3.8562893513822503, 4.300145068637881) to (3.8266892319792523, 4.295385250212327) to (3.7969082343856337, 4.287715484060199) to (3.7672308029553765, 4.277074906264027) to (3.737950045840418, 4.263430262340699) to (3.7093650753245533, 4.246776907430545) to (3.681778243585305, 4.227139552233507) to (3.6554922980075863, 4.204572744389498) to (3.630807481147599, 4.17916107727256) to (3.608018601207345, 4.151019120530304) to (3.587412099421529, 4.120291069131659) to (3.569263141073152, 4.087150110166676) to (3.553832756937631, 4.051797509150986) to (3.5413650618053008, 4.014461420103296) to (3.5320845763484034, 3.9753954261652082) to (3.5261936779826244, 3.9348768199974473) to (3.52387020552851, 3.893204635593605) to (3.5252652414101338, 3.85069744548097) to (3.530501093844663, 3.8076909395072507) to (3.5396694999861733, 3.764535303522364) to (3.5528300693013968, 3.7215924182369275) to (3.570008984586681, 3.679232900355887) to (3.59119797599886, 3.637833009730027) to (3.6163535812837715, 3.5977714477247242)... (405 lines skipped) ... (2.5876895046812542, 6.092782216410311) to (2.4108907248996347, 5.974375645673798) to (2.2440443398469627, 5.84100637614803) to (2.088418704670728, 5.693513250276495) to (1.9452112636265038, 5.532842779783124) to (1.8155393988602846, 5.360043132752432) to (1.7004317906812538, 5.176257342106588) to (1.600820355625463, 4.982715779129724) to (1.5175328248738253, 4.780727941339094) to (1.451286021369198, 4.571673609331009) to (1.4026798893047498, 4.356993432195811) to (1.372192324560483, 4.138179005661769) to (1.360174849181094, 3.916762511256756) to (1.366849167153882, 3.6943059884358007) to (1.3923046326003976, 3.472390314782422) to (1.4364966550828666, 3.2526039720255535) to (1.4992460600911253, 3.036531677699588) to (1.5802394159649444, 2.8257429637930533) to (1.679030331568638, 2.6217807846680836) to (1.7950417220196457, 2.4261502368764734) to (1.9275690327309571, 2.240307473243073) to (2.0757844050100154, 2.0656488927313963) to (2.2387417595154053, 1.9035006861519488) to (2.4153827670582784, 1.7551088157278287) to (2.604543669598571, 1.6216295039056332) to (2.80496290787612, 1.5041203036082176) to (3.0152895059818836, 1.403531818388963) to (3.234092157361091, 1.3207001366887505) to (3.4598689512925773, 1.2563400396445843) to (3.6910576738488485, 1.2110390366841615) to (3.9260466127487543, 1.1852522774988081) to (4.163185791405042, 1.1792983829565347) to (4.400798553876146, 1.1933562311387504) to (4.637193419383466, 1.2274627280030441) to (4.870676122578959, 1.2815115852367405) to (5.099561753863689, 1.3552531207208278) to (5.3221869127838755, 1.448295089721869) to (5.5369217868798115, 1.5601045475228523) to (5.742182068343344, 1.690010736745803) to (5.9364406214553895, 1.8372089851632132) to (6.118238815025682, 2.000765592396273) to (6.286197435937275, 2.1796236766094577) to (6.439027102398422, 2.372609945187002) to (6.575538098609998, 2.578442346469836) to (6.694649556248553, 2.7957385529931558) to (6.795397912420222, 3.0230252203448638) to (6.876944578531459, 3.2587479598110862) to (6.938582759817475, 3.5012819574330707) to (6.979743371032608, 3.74894316701145) to (7.0, 3.999999999999997);\end{tikzpicture}Show the standalone LaTeX document
\documentclass[border=10pt]{standalone}\PassOptionsToPackage{dvipsnames,svgnames,x11names}{xcolor}\usepackage{tikz}\usepackage{pgfplots}\pgfplotsset{compat=newest}\usepgfplotslibrary{groupplots}\usetikzlibrary{arrows.meta}\begin{document}% --------------------------------------------- %% Tikzfigure generated by tikzfigure v0.5.0     %% https://github.com/max-models/tikzfigure      %% --------------------------------------------- %\begin{tikzpicture}    \draw[color=teal, line width=2] (4.1, 4.0)        to        (4.109311690604932, 4.009210003491806)        to        (4.117714771684789, 4.0199778210498645)        to        (4.125014140190605, 4.0322102091087375)        to        (4.1310244108487, 4.0457922445851455)        to        (4.135572170308709, 4.060588337957058)        to        (4.138498126494149, 4.076443470909478)        to        (4.139659131447931, 4.093184647828918)        to        (4.138930057047688, 4.110622548377246)        to        (4.136205504238648, 4.1285533664322065)        to        (4.131401327884473, 4.146760818863925)        to        (4.1244559609566736, 4.16501830594048)        to        (4.115331523557323, 4.183091203636362)        to        (4.1040147041826955, 4.200739266769233)        to        (4.090517402670937, 4.217719120725341)        to        (4.074877126417452, 4.233786818563121)        to        (4.057157133669126, 4.248700439517244)        to        (4.037446320003529, 4.262222704369247)        to        (4.015858846442181, 4.274123582811634)        to        (3.992533510017395, 4.2841828678139935)        to        (3.9676328599896475, 4.292192692104246)        to        (3.941342065276122, 4.297959962205803)        to        (3.9138675409802377, 4.30130868602048)        to        (3.885435344186258, 4.302082170713749)        to        (3.8562893513822503, 4.300145068637881)        to        (3.8266892319792523, 4.295385250212327)        to        (3.7969082343856337, 4.287715484060199)        to        (3.7672308029553765, 4.277074906264027)        to        (3.737950045840418, 4.263430262340699)        to        (3.7093650753245533, 4.246776907430545)        to        (3.681778243585305, 4.227139552233507)        to        (3.6554922980075863, 4.204572744389498)        to        (3.630807481147599, 4.17916107727256)        to        (3.608018601207345, 4.151019120530304)        to        (3.587412099421529, 4.120291069131659)        to        (3.569263141073152, 4.087150110166676)        to        (3.553832756937631, 4.051797509150986)        to        (3.5413650618053008, 4.014461420103296)        to        (3.5320845763484034, 3.9753954261652082)        to        (3.5261936779826244, 3.9348768199974473)        to        (3.52387020552851, 3.893204635593605)        to        (3.5252652414101338, 3.85069744548097)        to        (3.530501093844663, 3.8076909395072507)        to        (3.5396694999861733, 3.764535303522364)... (415 lines skipped) ...        (2.4108907248996347, 5.974375645673798)        to        (2.2440443398469627, 5.84100637614803)        to        (2.088418704670728, 5.693513250276495)        to        (1.9452112636265038, 5.532842779783124)        to        (1.8155393988602846, 5.360043132752432)        to        (1.7004317906812538, 5.176257342106588)        to        (1.600820355625463, 4.982715779129724)        to        (1.5175328248738253, 4.780727941339094)        to        (1.451286021369198, 4.571673609331009)        to        (1.4026798893047498, 4.356993432195811)        to        (1.372192324560483, 4.138179005661769)        to        (1.360174849181094, 3.916762511256756)        to        (1.366849167153882, 3.6943059884358007)        to        (1.3923046326003976, 3.472390314782422)        to        (1.4364966550828666, 3.2526039720255535)        to        (1.4992460600911253, 3.036531677699588)        to        (1.5802394159649444, 2.8257429637930533)        to        (1.679030331568638, 2.6217807846680836)        to        (1.7950417220196457, 2.4261502368764734)        to        (1.9275690327309571, 2.240307473243073)        to        (2.0757844050100154, 2.0656488927313963)        to        (2.2387417595154053, 1.9035006861519488)        to        (2.4153827670582784, 1.7551088157278287)        to        (2.604543669598571, 1.6216295039056332)        to        (2.80496290787612, 1.5041203036082176)        to        (3.0152895059818836, 1.403531818388963)        to        (3.234092157361091, 1.3207001366887505)        to        (3.4598689512925773, 1.2563400396445843)        to        (3.6910576738488485, 1.2110390366841615)        to        (3.9260466127487543, 1.1852522774988081)        to        (4.163185791405042, 1.1792983829565347)        to        (4.400798553876146, 1.1933562311387504)        to        (4.637193419383466, 1.2274627280030441)        to        (4.870676122578959, 1.2815115852367405)        to        (5.099561753863689, 1.3552531207208278)        to        (5.3221869127838755, 1.448295089721869)        to        (5.5369217868798115, 1.5601045475228523)        to        (5.742182068343344, 1.690010736745803)        to        (5.9364406214553895, 1.8372089851632132)        to        (6.118238815025682, 2.000765592396273)        to        (6.286197435937275, 2.1796236766094577)        to        (6.439027102398422, 2.372609945187002)        to        (6.575538098609998, 2.578442346469836)        to        (6.694649556248553, 2.7957385529931558)        to        (6.795397912420222, 3.0230252203448638)        to        (6.876944578531459, 3.2587479598110862)        to        (6.938582759817475, 3.5012819574330707)        to        (6.979743371032608, 3.74894316701145)        to        (7.0, 3.999999999999997);\end{tikzpicture}
\end{document}
Sun: circle core + radial rays
Section titled “Sun: circle core + radial rays”A filled circle for the core, plus short line segments for rays at equal angles.
fig = TikzFigure()
cx, cy, R = 4, 4, 1.0  # center and core radius
# Coretheta = np.linspace(0, 2 * np.pi, 60)core = list(    zip(        cx + R * np.cos(theta),        cy + R * np.sin(theta),    ),)fig.filldraw(    core,    cycle=True,    line_width=2,    color="orange",    fill="yellow!60",)
# Raysfor angle in np.linspace(    0,    2 * np.pi,    12,    endpoint=False,):    x0 = cx + R * np.cos(angle)    y0 = cy + R * np.sin(angle)    x1 = cx + (R + 0.7) * np.cos(angle)    y1 = cy + (R + 0.7) * np.sin(angle)    fig.draw(        [(x0, y0), (x1, y1)],        line_width=2,        color="orange",    )
fig.show()
Show the TikZ code
% --------------------------------------------- %% Tikzfigure generated by tikzfigure v0.5.0 %% https://github.com/max-models/tikzfigure %% --------------------------------------------- %\begin{tikzpicture} \filldraw[color=orange, fill=yellow!60, line width=2] (5.0, 4.0) to (4.994334800210137, 4.106293485647365) to (4.977403389817867, 4.211382623629624) to (4.949397608468381, 4.314076712021949) to (4.910634772854913, 4.413212185768378) to (4.861554081393806, 4.50766580033884) to (4.802711637930964, 4.596367358538501) to (4.734774150863068, 4.678311836269616) to (4.658511379065039, 4.752570769856138) to (4.574787410214407, 4.818302775908169) to (4.48455087033265, 4.874763084531962) to (4.388824175473321, 4.921311977870413) to (4.288691947339621, 4.957422038362005) to (4.185288724087115, 4.982684124592521) to (4.079786105553083, 4.9968120070307505) to (3.9733794785622254, 4.999645611123452) to (3.867274472716278, 4.991152831004007) to (3.7626733001288852, 4.97142989326471) to (3.66076113388197, 4.940700266671033) to (3.5626926795411444, 4.89931213017122) to (3.4695790918802576, 4.847734427889671) to (3.3824753850538083, 4.786551555802642) to (3.3023684788650156, 4.716456740298315) to (3.230166016570094, 4.6382441836448205) to (3.166686080917485, 4.552800065361193) to (3.1126479249434285, 4.461092501449326) to (3.068663822547662, 4.364160575252822) to (3.035232131185484, 4.2631025642275215) to (3.0127316452786554, 4.159063496019072) to (3.001417304323238, 4.053222174842179) to (3.001417304323238, 3.9467778251578216) to (3.0127316452786554, 3.8409365039809282) to (3.035232131185484, 3.736897435772479) to (3.0686638225476615, 3.635839424747178) to (3.1126479249434285, 3.5389074985506745) to (3.1666860809174846, 3.4471999346388067) to (3.2301660165700934, 3.3617558163551804) to (3.3023684788650147, 3.2835432597016854) to (3.382475385053808, 3.2134484441973576) to (3.4695790918802576, 3.152265572110329) to (3.5626926795411444, 3.1006878698287808) to (3.6607611338819694, 3.0592997333289667) to (3.762673300128885, 3.02857010673529) to (3.8672744727162778, 3.008847168995993) to (3.973379478562225, 3.0003543888765476) to (4.079786105553083, 3.0031879929692495) to (4.185288724087114, 3.017315875407479) to (4.28869194733962, 3.042577961637994) to (4.38882417547332, 3.0786880221295867) to (4.48455087033265, 3.1252369154680384) to (4.574787410214406, 3.1816972240918306) to (4.658511379065038, 3.2474292301438608) to (4.734774150863067, 3.3216881637303834) to (4.802711637930964, 3.403632641461498) to (4.861554081393806, 3.49233419966116) to (4.910634772854913, 3.586787814231622) to (4.949397608468381, 3.685923287978051) to (4.977403389817867, 3.7886173763703757) to (4.994334800210137, 3.8937065143526346) to (5.0, 3.9999999999999996) -- cycle; \draw[color=orange, line width=2] (5.0, 4.0) to (5.7, 4.0); \draw[color=orange, line width=2] (4.866025403784438, 4.5) to (5.472243186433546, 4.85); \draw[color=orange, line width=2] (4.5, 4.866025403784438) to (4.8500000000000005, 5.472243186433546); \draw[color=orange, line width=2] (4.0, 5.0) to (4.0, 5.7); \draw[color=orange, line width=2] (3.5, 4.866025403784438) to (3.1500000000000004, 5.472243186433546); \draw[color=orange, line width=2] (3.1339745962155616, 4.5) to (2.5277568135664543, 4.8500000000000005); \draw[color=orange, line width=2] (3.0, 4.0) to (2.3, 4.0); \draw[color=orange, line width=2] (3.133974596215561, 3.5000000000000004) to (2.5277568135664543, 3.1500000000000004); \draw[color=orange, line width=2] (3.4999999999999996, 3.1339745962155616) to (3.1499999999999995, 2.5277568135664548); \draw[color=orange, line width=2] (4.0, 3.0) to (3.9999999999999996, 2.3); \draw[color=orange, line width=2] (4.499999999999999, 3.1339745962155607) to (4.849999999999999, 2.5277568135664534); \draw[color=orange, line width=2] (4.866025403784438, 3.4999999999999996) to (5.472243186433545, 3.1499999999999995);\end{tikzpicture}Show the standalone LaTeX document
\documentclass[border=10pt]{standalone}\PassOptionsToPackage{dvipsnames,svgnames,x11names}{xcolor}\usepackage{tikz}\usepackage{pgfplots}\pgfplotsset{compat=newest}\usepgfplotslibrary{groupplots}\usetikzlibrary{arrows.meta}\begin{document}% --------------------------------------------- %% Tikzfigure generated by tikzfigure v0.5.0     %% https://github.com/max-models/tikzfigure      %% --------------------------------------------- %\begin{tikzpicture}    \filldraw[color=orange, fill=yellow!60, line width=2] (5.0, 4.0)        to        (4.994334800210137, 4.106293485647365)        to        (4.977403389817867, 4.211382623629624)        to        (4.949397608468381, 4.314076712021949)        to        (4.910634772854913, 4.413212185768378)        to        (4.861554081393806, 4.50766580033884)        to        (4.802711637930964, 4.596367358538501)        to        (4.734774150863068, 4.678311836269616)        to        (4.658511379065039, 4.752570769856138)        to        (4.574787410214407, 4.818302775908169)        to        (4.48455087033265, 4.874763084531962)        to        (4.388824175473321, 4.921311977870413)        to        (4.288691947339621, 4.957422038362005)        to        (4.185288724087115, 4.982684124592521)        to        (4.079786105553083, 4.9968120070307505)        to        (3.9733794785622254, 4.999645611123452)        to        (3.867274472716278, 4.991152831004007)        to        (3.7626733001288852, 4.97142989326471)        to        (3.66076113388197, 4.940700266671033)        to        (3.5626926795411444, 4.89931213017122)        to        (3.4695790918802576, 4.847734427889671)        to        (3.3824753850538083, 4.786551555802642)        to        (3.3023684788650156, 4.716456740298315)        to        (3.230166016570094, 4.6382441836448205)        to        (3.166686080917485, 4.552800065361193)        to        (3.1126479249434285, 4.461092501449326)        to        (3.068663822547662, 4.364160575252822)        to        (3.035232131185484, 4.2631025642275215)        to        (3.0127316452786554, 4.159063496019072)        to        (3.001417304323238, 4.053222174842179)        to        (3.001417304323238, 3.9467778251578216)        to        (3.0127316452786554, 3.8409365039809282)        to        (3.035232131185484, 3.736897435772479)        to        (3.0686638225476615, 3.635839424747178)        to        (3.1126479249434285, 3.5389074985506745)        to        (3.1666860809174846, 3.4471999346388067)        to        (3.2301660165700934, 3.3617558163551804)        to        (3.3023684788650147, 3.2835432597016854)        to        (3.382475385053808, 3.2134484441973576)        to        (3.4695790918802576, 3.152265572110329)        to        (3.5626926795411444, 3.1006878698287808)        to        (3.6607611338819694, 3.0592997333289667)        to        (3.762673300128885, 3.02857010673529)        to        (3.8672744727162778, 3.008847168995993)        to        (3.973379478562225, 3.0003543888765476)        to        (4.079786105553083, 3.0031879929692495)        to        (4.185288724087114, 3.017315875407479)        to        (4.28869194733962, 3.042577961637994)        to        (4.38882417547332, 3.0786880221295867)        to        (4.48455087033265, 3.1252369154680384)        to        (4.574787410214406, 3.1816972240918306)        to        (4.658511379065038, 3.2474292301438608)        to        (4.734774150863067, 3.3216881637303834)        to        (4.802711637930964, 3.403632641461498)        to        (4.861554081393806, 3.49233419966116)        to        (4.910634772854913, 3.586787814231622)        to        (4.949397608468381, 3.685923287978051)        to        (4.977403389817867, 3.7886173763703757)        to        (4.994334800210137, 3.8937065143526346)        to        (5.0, 3.9999999999999996) -- cycle;    \draw[color=orange, line width=2] (5.0, 4.0) to (5.7, 4.0);    \draw[color=orange, line width=2] (4.866025403784438, 4.5) to (5.472243186433546, 4.85);    \draw[color=orange, line width=2] (4.5, 4.866025403784438) to (4.8500000000000005, 5.472243186433546);    \draw[color=orange, line width=2] (4.0, 5.0) to (4.0, 5.7);    \draw[color=orange, line width=2] (3.5, 4.866025403784438) to (3.1500000000000004, 5.472243186433546);    \draw[color=orange, line width=2] (3.1339745962155616, 4.5) to (2.5277568135664543, 4.8500000000000005);    \draw[color=orange, line width=2] (3.0, 4.0) to (2.3, 4.0);    \draw[color=orange, line width=2] (3.133974596215561, 3.5000000000000004) to (2.5277568135664543, 3.1500000000000004);    \draw[color=orange, line width=2] (3.4999999999999996, 3.1339745962155616) to (3.1499999999999995, 2.5277568135664548);    \draw[color=orange, line width=2] (4.0, 3.0) to (3.9999999999999996, 2.3);    \draw[color=orange, line width=2] (4.499999999999999, 3.1339745962155607) to (4.849999999999999, 2.5277568135664534);    \draw[color=orange, line width=2] (4.866025403784438, 3.4999999999999996) to (5.472243186433545, 3.1499999999999995);\end{tikzpicture}
\end{document}
Fill without stroke
Section titled “Fill without stroke”fig.fill() fills a closed path without drawing any outline — the equivalent of
\fill[...] in TikZ. Use it when you want pure flat colour with no border.
fig = TikzFigure()
# Three overlapping filled triangles — no outlines at alltriangles = [    ([[1, 0], [4, 0], [2.5, 2.5]], "red!60"),    ([[2, 0], [5, 0], [3.5, 2.5]], "blue!50"),    ([[3, 0], [6, 0], [4.5, 2.5]], "green!60"),]for pts, color in triangles:    fig.fill(        pts,        cycle=True,        fill=color,        fill_opacity=0.6,    )
fig.show()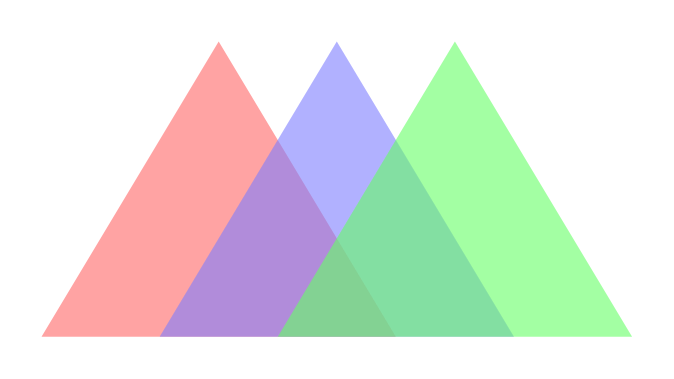
Show the TikZ code
% --------------------------------------------- %% Tikzfigure generated by tikzfigure v0.5.0 %% https://github.com/max-models/tikzfigure %% --------------------------------------------- %\begin{tikzpicture} \fill[fill=red!60, fill opacity=0.6] (1, 0) to (4, 0) to (2.5, 2.5) -- cycle; \fill[fill=blue!50, fill opacity=0.6] (2, 0) to (5, 0) to (3.5, 2.5) -- cycle; \fill[fill=green!60, fill opacity=0.6] (3, 0) to (6, 0) to (4.5, 2.5) -- cycle;\end{tikzpicture}Show the standalone LaTeX document
\documentclass[border=10pt]{standalone}\PassOptionsToPackage{dvipsnames,svgnames,x11names}{xcolor}\usepackage{tikz}\usepackage{pgfplots}\pgfplotsset{compat=newest}\usepgfplotslibrary{groupplots}\usetikzlibrary{arrows.meta}\begin{document}% --------------------------------------------- %% Tikzfigure generated by tikzfigure v0.5.0     %% https://github.com/max-models/tikzfigure      %% --------------------------------------------- %\begin{tikzpicture}    \fill[fill=red!60, fill opacity=0.6] (1, 0) to (4, 0) to (2.5, 2.5) -- cycle;    \fill[fill=blue!50, fill opacity=0.6] (2, 0) to (5, 0) to (3.5, 2.5) -- cycle;    \fill[fill=green!60, fill opacity=0.6] (3, 0) to (6, 0) to (4.5, 2.5) -- cycle;\end{tikzpicture}
\end{document}
The even_odd_rule flag corrects the fill for self-intersecting paths. Without
it, TikZ fills the interior using the non-zero winding rule, which fills the
overlapping centre region twice — visually it looks like a solid shape. With
even_odd_rule=True the centre hole is punched out correctly.
fig = TikzFigure()
# A five-pointed star is self-intersectingangles = np.linspace(np.pi / 2, np.pi / 2 + 4 * np.pi, 6)[:-1]star_pts = list(    zip(        np.cos(angles) * 2 + 2,        np.sin(angles) * 2 + 2,    ),)
# Default winding rule: centre is filled solidfig.fill(    star_pts,    cycle=True,    fill="orange!80",    fill_opacity=0.9,)fig.node(    (2, -0.3),    content="winding rule (default)",    draw="none",    font=r"\small",    anchor="center",)
# Even-odd rule: centre is hollowangles2 = np.linspace(np.pi / 2, np.pi / 2 + 4 * np.pi, 6)[:-1]star_pts2 = list(    zip(        np.cos(angles2) * 2 + 8,        np.sin(angles2) * 2 + 2,    ),)fig.fill(    star_pts2,    cycle=True,    fill="teal!70",    fill_opacity=0.9,    even_odd_rule=True,)fig.node(    (8, -0.3),    content="even odd rule",    draw="none",    font=r"\small",    anchor="center",)
fig.show()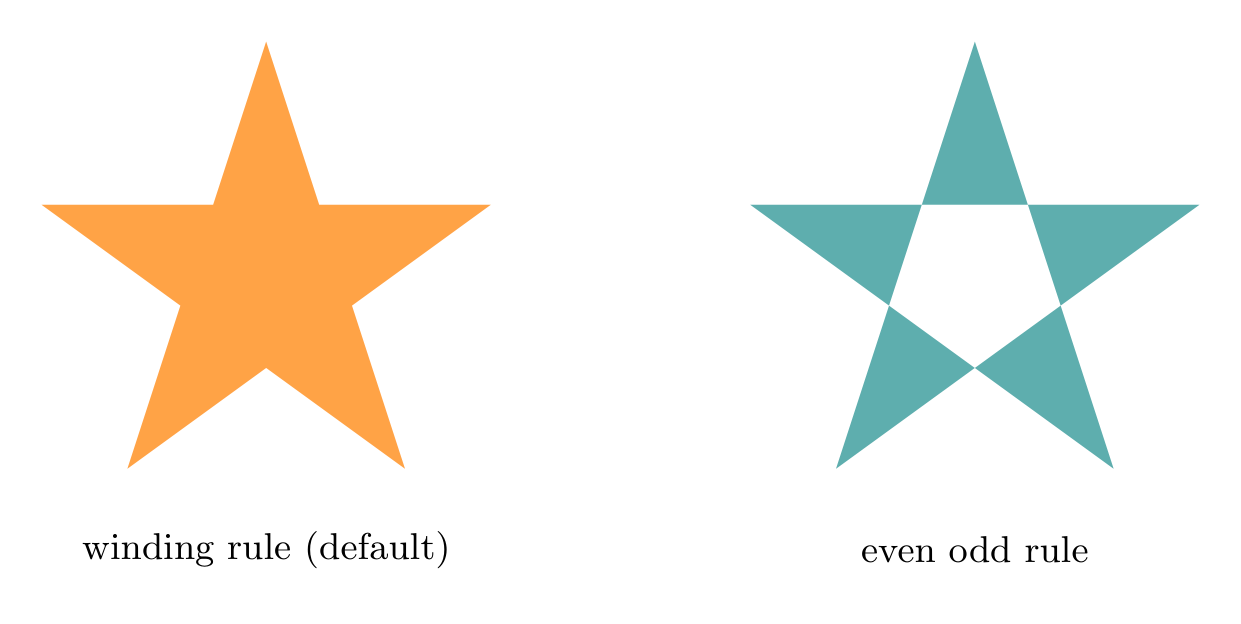
Show the TikZ code
% --------------------------------------------- %% Tikzfigure generated by tikzfigure v0.5.0 %% https://github.com/max-models/tikzfigure %% --------------------------------------------- %\begin{tikzpicture} \fill[fill=orange!80, fill opacity=0.9] (2.0, 4.0) to (0.8244294954150535, 0.3819660112501053) to (3.9021130325903073, 2.6180339887498945) to (0.09788696740969316, 2.618033988749896) to (3.175570504584946, 0.38196601125010465) -- cycle; \node[draw=none, font=\small, anchor=center] (node0) at ({2}, {-0.3}) {winding rule (default)}; \fill[even odd rule, fill=teal!70, fill opacity=0.9] (8.0, 4.0) to (6.824429495415053, 0.3819660112501053) to (9.902113032590307, 2.6180339887498945) to (6.097886967409693, 2.618033988749896) to (9.175570504584945, 0.38196601125010465) -- cycle; \node[draw=none, font=\small, anchor=center] (node1) at ({8}, {-0.3}) {even odd rule};\end{tikzpicture}Show the standalone LaTeX document
\documentclass[border=10pt]{standalone}\PassOptionsToPackage{dvipsnames,svgnames,x11names}{xcolor}\usepackage{tikz}\usepackage{pgfplots}\pgfplotsset{compat=newest}\usepgfplotslibrary{groupplots}\usetikzlibrary{arrows.meta}\begin{document}% --------------------------------------------- %% Tikzfigure generated by tikzfigure v0.5.0     %% https://github.com/max-models/tikzfigure      %% --------------------------------------------- %\begin{tikzpicture}    \fill[fill=orange!80, fill opacity=0.9] (2.0, 4.0)        to        (0.8244294954150535, 0.3819660112501053)        to        (3.9021130325903073, 2.6180339887498945)        to        (0.09788696740969316, 2.618033988749896)        to        (3.175570504584946, 0.38196601125010465) -- cycle;    \node[draw=none, font=\small, anchor=center] (node0) at ({2}, {-0.3}) {winding rule (default)};    \fill[even odd rule, fill=teal!70, fill opacity=0.9] (8.0, 4.0)        to        (6.824429495415053, 0.3819660112501053)        to        (9.902113032590307, 2.6180339887498945)        to        (6.097886967409693, 2.618033988749896)        to        (9.175570504584945, 0.38196601125010465) -- cycle;    \node[draw=none, font=\small, anchor=center] (node1) at ({8}, {-0.3}) {even odd rule};\end{tikzpicture}
\end{document}fig.clip() installs a clipping path — all subsequent drawing is masked to the
given boundary. Wrap the clip together with the clipped content inside a
\begin{scope}...\end{scope} via fig.raw() so the clip doesn’t leak into the
rest of the figure.
fig = TikzFigure()
# Draw a full circle for reference (unclipped)fig.draw(    list(        zip(            np.cos(np.linspace(0, 2 * np.pi, 60)) * 2 + 2,            np.sin(np.linspace(0, 2 * np.pi, 60)) * 2 + 2,        ),    ),    cycle=True,    color="gray!40",    line_width=1,)
# Open a scope, clip to a rectangle, then draw a dense grid insidefig.raw(r"\begin{scope}")clip_rect = [[0.5, 0.5], [3.5, 0.5], [3.5, 3.5], [0.5, 3.5]]fig.clip(clip_rect, cycle=True)
for i in np.linspace(0, 4, 20):    fig.draw(        [(0, i), (4, i)],        color="blue!40",        line_width=0.4,    )    fig.draw(        [(i, 0), (i, 4)],        color="blue!40",        line_width=0.4,    )
fig.raw(r"\end{scope}")
# Anything drawn after the scope is unclipped againfig.node(    (2, -0.5),    content="clipped grid inside circle",    draw="none",    font=r"\small",    anchor="center",)
fig.show()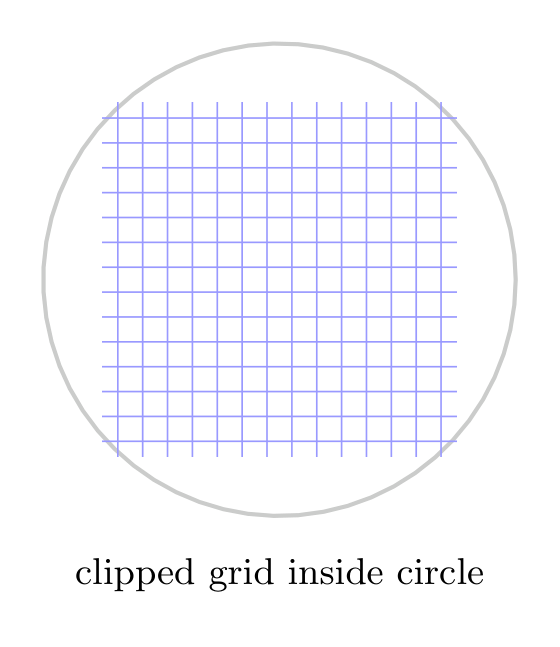
Show the TikZ code
% --------------------------------------------- %% Tikzfigure generated by tikzfigure v0.5.0 %% https://github.com/max-models/tikzfigure %% --------------------------------------------- %\begin{tikzpicture} \draw[color=gray!40, line width=1] (4.0, 2.0) to (3.988669600420274, 2.212586971294731) to (3.9548067796357333, 2.4227652472592487) to (3.8987952169367626, 2.6281534240438975) to (3.8212695457098267, 2.8264243715367563) to (3.723108162787612, 3.01533160067768) to (3.605423275861927, 3.192734717077003) to (3.4695483017261344, 3.356623672539232) to (3.3170227581300775, 3.5051415397122767) to (3.149574820428814, 3.636605551816338) to (2.9691017406653004, 3.7495261690639223) to (2.7776483509466416, 3.8426239557408257) to (2.5773838946792424, 3.9148440767240107) to (2.370577448174229, 3.9653682491850417) to (2.159572211106166, 3.9936240140615) to (1.9467589571244506, 3.9992912222469053) to (1.7345489454325562, 3.9823056620080144) to (1.5253466002577707, 3.9428597865294197) to (1.3215222677639398, 3.8814005333420667) to (1.1253853590822893, 3.7986242603424385) to (0.9391581837605152, 3.695468855779342) to (0.7649507701076164, 3.573103111605285) to (0.6047369577300308, 3.4329134805966306) to (0.4603320331401879, 3.2764883672896405) to (0.3333721618349703, 3.1056001307223875) to (0.22529584988685714, 2.9221850028986522) to (0.13732764509532336, 2.728321150505645) to (0.07046426237096814, 2.5262051284550426) to (0.02546329055731089, 2.3181269920381444) to (0.002834608646476111, 2.1064443496843577) to (0.002834608646476111, 1.893555650315643) to (0.02546329055731089, 1.6818730079618562) to (0.07046426237096792, 1.4737948715449578) to (0.13732764509532291, 1.2716788494943563) to (0.22529584988685647, 1.0778149971013489) to (0.33337216183496965, 0.8943998692776138) to (0.460332033140187, 0.7235116327103606) to (0.6047369577300299, 0.5670865194033705) to (0.7649507701076159, 0.42689688839471507) to (0.9391581837605147, 0.3045311442206582) to (1.1253853590822889, 0.20137573965756173) to (1.3215222677639389, 0.11859946665793353) to (1.5253466002577698, 0.05714021347058029) to (1.7345489454325553, 0.01769433799198583) to (1.9467589571244497, 0.000708777753094969) to (2.1595722111061653, 0.006375985938499529) to (2.3705774481742274, 0.03463175081495784) to (2.577383894679241, 0.08515592327598864) to (2.7776483509466403, 0.15737604425917362) to (2.969101740665299, 0.2504738309360768) to (3.1495748204288123, 0.36339444818366107) to (3.317022758130076, 0.49485846028772196) to (3.4695483017261335, 0.6433763274607667) to (3.6054232758619262, 0.8072652829229958) to (3.723108162787612, 0.98466839932232) to (3.8212695457098262, 1.1735756284632437) to (3.8987952169367626, 1.371846575956102) to (3.9548067796357333, 1.577234752740751) to (3.988669600420274, 1.7874130287052687) to (4.0, 1.9999999999999996) -- cycle; \begin{scope} \clip (0.5, 0.5) to (3.5, 0.5) to (3.5, 3.5) to (0.5, 3.5) -- cycle; \draw[color=blue!40, line width=0.4] (0, 0.0) to (4, 0.0); \draw[color=blue!40, line width=0.4] (0.0, 0) to (0.0, 4); \draw[color=blue!40, line width=0.4] (0, 0.21052631578947367) to (4, 0.21052631578947367); \draw[color=blue!40, line width=0.4] (0.21052631578947367, 0) to (0.21052631578947367, 4); \draw[color=blue!40, line width=0.4] (0, 0.42105263157894735) to (4, 0.42105263157894735); \draw[color=blue!40, line width=0.4] (0.42105263157894735, 0) to (0.42105263157894735, 4); \draw[color=blue!40, line width=0.4] (0, 0.631578947368421) to (4, 0.631578947368421); \draw[color=blue!40, line width=0.4] (0.631578947368421, 0) to (0.631578947368421, 4); \draw[color=blue!40, line width=0.4] (0, 0.8421052631578947) to (4, 0.8421052631578947); \draw[color=blue!40, line width=0.4] (0.8421052631578947, 0) to (0.8421052631578947, 4); \draw[color=blue!40, line width=0.4] (0, 1.0526315789473684) to (4, 1.0526315789473684); \draw[color=blue!40, line width=0.4] (1.0526315789473684, 0) to (1.0526315789473684, 4); \draw[color=blue!40, line width=0.4] (0, 1.263157894736842) to (4, 1.263157894736842); \draw[color=blue!40, line width=0.4] (1.263157894736842, 0) to (1.263157894736842, 4); \draw[color=blue!40, line width=0.4] (0, 1.4736842105263157) to (4, 1.4736842105263157); \draw[color=blue!40, line width=0.4] (1.4736842105263157, 0) to (1.4736842105263157, 4); \draw[color=blue!40, line width=0.4] (0, 1.6842105263157894) to (4, 1.6842105263157894); \draw[color=blue!40, line width=0.4] (1.6842105263157894, 0) to (1.6842105263157894, 4); \draw[color=blue!40, line width=0.4] (0, 1.894736842105263) to (4, 1.894736842105263); \draw[color=blue!40, line width=0.4] (1.894736842105263, 0) to (1.894736842105263, 4); \draw[color=blue!40, line width=0.4] (0, 2.1052631578947367) to (4, 2.1052631578947367); \draw[color=blue!40, line width=0.4] (2.1052631578947367, 0) to (2.1052631578947367, 4); \draw[color=blue!40, line width=0.4] (0, 2.3157894736842106) to (4, 2.3157894736842106); \draw[color=blue!40, line width=0.4] (2.3157894736842106, 0) to (2.3157894736842106, 4); \draw[color=blue!40, line width=0.4] (0, 2.526315789473684) to (4, 2.526315789473684); \draw[color=blue!40, line width=0.4] (2.526315789473684, 0) to (2.526315789473684, 4); \draw[color=blue!40, line width=0.4] (0, 2.7368421052631575) to (4, 2.7368421052631575); \draw[color=blue!40, line width=0.4] (2.7368421052631575, 0) to (2.7368421052631575, 4); \draw[color=blue!40, line width=0.4] (0, 2.9473684210526314) to (4, 2.9473684210526314); \draw[color=blue!40, line width=0.4] (2.9473684210526314, 0) to (2.9473684210526314, 4); \draw[color=blue!40, line width=0.4] (0, 3.1578947368421053) to (4, 3.1578947368421053); \draw[color=blue!40, line width=0.4] (3.1578947368421053, 0) to (3.1578947368421053, 4); \draw[color=blue!40, line width=0.4] (0, 3.3684210526315788) to (4, 3.3684210526315788); \draw[color=blue!40, line width=0.4] (3.3684210526315788, 0) to (3.3684210526315788, 4); \draw[color=blue!40, line width=0.4] (0, 3.578947368421052) to (4, 3.578947368421052); \draw[color=blue!40, line width=0.4] (3.578947368421052, 0) to (3.578947368421052, 4); \draw[color=blue!40, line width=0.4] (0, 3.789473684210526) to (4, 3.789473684210526); \draw[color=blue!40, line width=0.4] (3.789473684210526, 0) to (3.789473684210526, 4); \draw[color=blue!40, line width=0.4] (0, 4.0) to (4, 4.0); \draw[color=blue!40, line width=0.4] (4.0, 0) to (4.0, 4); \end{scope} \node[draw=none, font=\small, anchor=center] (node0) at ({2}, {-0.5}) {clipped grid inside circle};\end{tikzpicture}Show the standalone LaTeX document
\documentclass[border=10pt]{standalone}\PassOptionsToPackage{dvipsnames,svgnames,x11names}{xcolor}\usepackage{tikz}\usepackage{pgfplots}\pgfplotsset{compat=newest}\usepgfplotslibrary{groupplots}\usetikzlibrary{arrows.meta}\begin{document}% --------------------------------------------- %% Tikzfigure generated by tikzfigure v0.5.0     %% https://github.com/max-models/tikzfigure      %% --------------------------------------------- %\begin{tikzpicture}    \draw[color=gray!40, line width=1] (4.0, 2.0)        to        (3.988669600420274, 2.212586971294731)        to        (3.9548067796357333, 2.4227652472592487)        to        (3.8987952169367626, 2.6281534240438975)        to        (3.8212695457098267, 2.8264243715367563)        to        (3.723108162787612, 3.01533160067768)        to        (3.605423275861927, 3.192734717077003)        to        (3.4695483017261344, 3.356623672539232)        to        (3.3170227581300775, 3.5051415397122767)        to        (3.149574820428814, 3.636605551816338)        to        (2.9691017406653004, 3.7495261690639223)        to        (2.7776483509466416, 3.8426239557408257)        to        (2.5773838946792424, 3.9148440767240107)        to        (2.370577448174229, 3.9653682491850417)        to        (2.159572211106166, 3.9936240140615)        to        (1.9467589571244506, 3.9992912222469053)        to        (1.7345489454325562, 3.9823056620080144)        to        (1.5253466002577707, 3.9428597865294197)        to        (1.3215222677639398, 3.8814005333420667)        to        (1.1253853590822893, 3.7986242603424385)        to        (0.9391581837605152, 3.695468855779342)        to        (0.7649507701076164, 3.573103111605285)        to        (0.6047369577300308, 3.4329134805966306)        to        (0.4603320331401879, 3.2764883672896405)        to        (0.3333721618349703, 3.1056001307223875)        to        (0.22529584988685714, 2.9221850028986522)        to        (0.13732764509532336, 2.728321150505645)        to        (0.07046426237096814, 2.5262051284550426)        to        (0.02546329055731089, 2.3181269920381444)        to        (0.002834608646476111, 2.1064443496843577)        to        (0.002834608646476111, 1.893555650315643)        to        (0.02546329055731089, 1.6818730079618562)        to        (0.07046426237096792, 1.4737948715449578)        to        (0.13732764509532291, 1.2716788494943563)        to        (0.22529584988685647, 1.0778149971013489)        to        (0.33337216183496965, 0.8943998692776138)        to        (0.460332033140187, 0.7235116327103606)        to        (0.6047369577300299, 0.5670865194033705)        to        (0.7649507701076159, 0.42689688839471507)        to        (0.9391581837605147, 0.3045311442206582)        to        (1.1253853590822889, 0.20137573965756173)        to        (1.3215222677639389, 0.11859946665793353)        to        (1.5253466002577698, 0.05714021347058029)        to        (1.7345489454325553, 0.01769433799198583)        to        (1.9467589571244497, 0.000708777753094969)        to        (2.1595722111061653, 0.006375985938499529)        to        (2.3705774481742274, 0.03463175081495784)        to        (2.577383894679241, 0.08515592327598864)        to        (2.7776483509466403, 0.15737604425917362)        to        (2.969101740665299, 0.2504738309360768)        to        (3.1495748204288123, 0.36339444818366107)        to        (3.317022758130076, 0.49485846028772196)        to        (3.4695483017261335, 0.6433763274607667)        to        (3.6054232758619262, 0.8072652829229958)        to        (3.723108162787612, 0.98466839932232)        to        (3.8212695457098262, 1.1735756284632437)        to        (3.8987952169367626, 1.371846575956102)        to        (3.9548067796357333, 1.577234752740751)        to        (3.988669600420274, 1.7874130287052687)        to        (4.0, 1.9999999999999996) -- cycle;    \begin{scope}        \clip (0.5, 0.5)            to            (3.5, 0.5)            to            (3.5, 3.5)            to            (0.5, 3.5) -- cycle;        \draw[color=blue!40, line width=0.4] (0, 0.0) to (4, 0.0);        \draw[color=blue!40, line width=0.4] (0.0, 0) to (0.0, 4);        \draw[color=blue!40, line width=0.4] (0, 0.21052631578947367) to (4, 0.21052631578947367);        \draw[color=blue!40, line width=0.4] (0.21052631578947367, 0) to (0.21052631578947367, 4);        \draw[color=blue!40, line width=0.4] (0, 0.42105263157894735) to (4, 0.42105263157894735);        \draw[color=blue!40, line width=0.4] (0.42105263157894735, 0) to (0.42105263157894735, 4);        \draw[color=blue!40, line width=0.4] (0, 0.631578947368421) to (4, 0.631578947368421);        \draw[color=blue!40, line width=0.4] (0.631578947368421, 0) to (0.631578947368421, 4);        \draw[color=blue!40, line width=0.4] (0, 0.8421052631578947) to (4, 0.8421052631578947);        \draw[color=blue!40, line width=0.4] (0.8421052631578947, 0) to (0.8421052631578947, 4);        \draw[color=blue!40, line width=0.4] (0, 1.0526315789473684) to (4, 1.0526315789473684);        \draw[color=blue!40, line width=0.4] (1.0526315789473684, 0) to (1.0526315789473684, 4);        \draw[color=blue!40, line width=0.4] (0, 1.263157894736842) to (4, 1.263157894736842);        \draw[color=blue!40, line width=0.4] (1.263157894736842, 0) to (1.263157894736842, 4);        \draw[color=blue!40, line width=0.4] (0, 1.4736842105263157) to (4, 1.4736842105263157);        \draw[color=blue!40, line width=0.4] (1.4736842105263157, 0) to (1.4736842105263157, 4);        \draw[color=blue!40, line width=0.4] (0, 1.6842105263157894) to (4, 1.6842105263157894);        \draw[color=blue!40, line width=0.4] (1.6842105263157894, 0) to (1.6842105263157894, 4);        \draw[color=blue!40, line width=0.4] (0, 1.894736842105263) to (4, 1.894736842105263);        \draw[color=blue!40, line width=0.4] (1.894736842105263, 0) to (1.894736842105263, 4);        \draw[color=blue!40, line width=0.4] (0, 2.1052631578947367) to (4, 2.1052631578947367);        \draw[color=blue!40, line width=0.4] (2.1052631578947367, 0) to (2.1052631578947367, 4);        \draw[color=blue!40, line width=0.4] (0, 2.3157894736842106) to (4, 2.3157894736842106);        \draw[color=blue!40, line width=0.4] (2.3157894736842106, 0) to (2.3157894736842106, 4);        \draw[color=blue!40, line width=0.4] (0, 2.526315789473684) to (4, 2.526315789473684);        \draw[color=blue!40, line width=0.4] (2.526315789473684, 0) to (2.526315789473684, 4);        \draw[color=blue!40, line width=0.4] (0, 2.7368421052631575) to (4, 2.7368421052631575);        \draw[color=blue!40, line width=0.4] (2.7368421052631575, 0) to (2.7368421052631575, 4);        \draw[color=blue!40, line width=0.4] (0, 2.9473684210526314) to (4, 2.9473684210526314);        \draw[color=blue!40, line width=0.4] (2.9473684210526314, 0) to (2.9473684210526314, 4);        \draw[color=blue!40, line width=0.4] (0, 3.1578947368421053) to (4, 3.1578947368421053);        \draw[color=blue!40, line width=0.4] (3.1578947368421053, 0) to (3.1578947368421053, 4);        \draw[color=blue!40, line width=0.4] (0, 3.3684210526315788) to (4, 3.3684210526315788);        \draw[color=blue!40, line width=0.4] (3.3684210526315788, 0) to (3.3684210526315788, 4);        \draw[color=blue!40, line width=0.4] (0, 3.578947368421052) to (4, 3.578947368421052);        \draw[color=blue!40, line width=0.4] (3.578947368421052, 0) to (3.578947368421052, 4);        \draw[color=blue!40, line width=0.4] (0, 3.789473684210526) to (4, 3.789473684210526);        \draw[color=blue!40, line width=0.4] (3.789473684210526, 0) to (3.789473684210526, 4);        \draw[color=blue!40, line width=0.4] (0, 4.0) to (4, 4.0);        \draw[color=blue!40, line width=0.4] (4.0, 0) to (4.0, 4);    \end{scope}    \node[draw=none, font=\small, anchor=center] (node0) at ({2}, {-0.5}) {clipped grid inside circle};\end{tikzpicture}
\end{document}
Invisible path
Section titled “Invisible path”fig.path() traces a path without drawing or filling anything. It has two
common uses:
Named paths — register a path under a name so the intersections TikZ
library can compute where two paths cross.
Mid-path labels — place a text node at a specific position along an
invisible connector using segment_options with a "node" key.
fig = TikzFigure()
# Three nodesfor label, x, y, color in [    ("A", 0, 0, "teal"),    ("B", 5, 3, "orange"),    ("C", 10, 0, "purple"),]:    fig.node(        (x, y),        label=label,        shape="circle",        fill=f"{color}!20",        draw=f"{color}!70",        minimum_size="1.2cm",        content=f"${label}$",    )
# Visible arrowsfig.draw(    ["A.center", "B.center"],    arrows=arrows.forward,    options=[styles.thick],    color="teal!70",    segment_options=[{"bend_left": 20}],)fig.draw(    ["B.center", "C.center"],    arrows=arrows.forward,    options=[styles.thick],    color="orange!80",    segment_options=[{"bend_right": 20}],)
# Invisible paths with mid-path labelsfig.path(    ["A.center", "B.center"],    segment_options=[        {            "node": {                "content": r"$e_1$",                "above": True,                "sloped": True,                "font": r"\small",            },            "bend_left": 20,        },    ],)fig.path(    ["B.center", "C.center"],    segment_options=[        {            "node": {                "content": r"$e_2$",                "above": True,                "sloped": True,                "font": r"\small",            },            "bend_right": 20,        },    ],)
fig.show()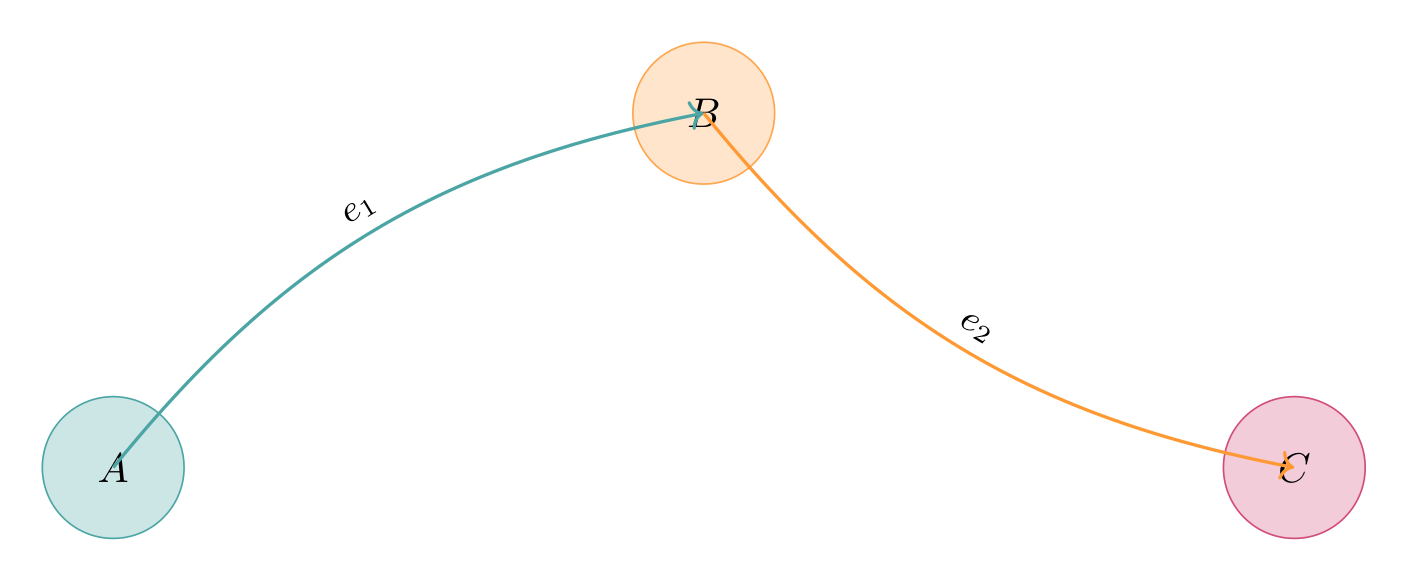
Show the TikZ code
% --------------------------------------------- %% Tikzfigure generated by tikzfigure v0.5.0 %% https://github.com/max-models/tikzfigure %% --------------------------------------------- %\begin{tikzpicture} \node[shape=circle, fill=teal!20, draw=teal!70, minimum size=1.2cm] (A) at ({0}, {0}) {$A$}; \node[shape=circle, fill=orange!20, draw=orange!70, minimum size=1.2cm] (B) at ({5}, {3}) {$B$}; \node[shape=circle, fill=purple!20, draw=purple!70, minimum size=1.2cm] (C) at ({10}, {0}) {$C$}; \draw[thick, ->, color=teal!70] (A.center) to[bend left=20] (B.center); \draw[thick, ->, color=orange!80] (B.center) to[bend right=20] (C.center); \path (A.center) to[bend left=20] node[above, sloped, font=\small] {$e_1$} (B.center); \path (B.center) to[bend right=20] node[above, sloped, font=\small] {$e_2$} (C.center);\end{tikzpicture}Show the standalone LaTeX document
\documentclass[border=10pt]{standalone}\PassOptionsToPackage{dvipsnames,svgnames,x11names}{xcolor}\usepackage{tikz}\usepackage{pgfplots}\pgfplotsset{compat=newest}\usepgfplotslibrary{groupplots}\usetikzlibrary{arrows.meta}\begin{document}% --------------------------------------------- %% Tikzfigure generated by tikzfigure v0.5.0     %% https://github.com/max-models/tikzfigure      %% --------------------------------------------- %\begin{tikzpicture}    \node[shape=circle, fill=teal!20, draw=teal!70, minimum size=1.2cm] (A) at ({0}, {0}) {$A$};    \node[shape=circle, fill=orange!20, draw=orange!70, minimum size=1.2cm] (B) at ({5}, {3}) {$B$};    \node[shape=circle, fill=purple!20, draw=purple!70, minimum size=1.2cm] (C) at ({10}, {0}) {$C$};    \draw[thick, ->, color=teal!70] (A.center) to[bend left=20] (B.center);    \draw[thick, ->, color=orange!80] (B.center) to[bend right=20] (C.center);    \path (A.center) to[bend left=20] node[above, sloped, font=\small] {$e_1$} (B.center);    \path (B.center) to[bend right=20] node[above, sloped, font=\small] {$e_2$} (C.center);\end{tikzpicture}
\end{document}