Tutorials
Fundamentals
Getting started
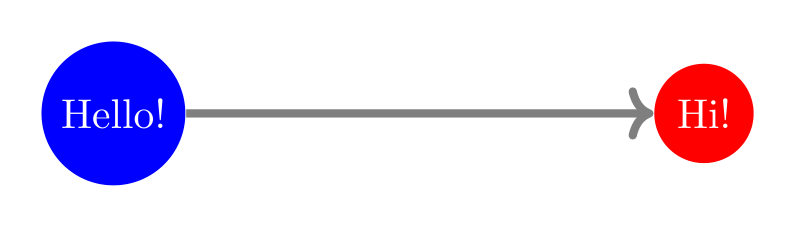
This first tutorial covers the absolute basics:
Styling
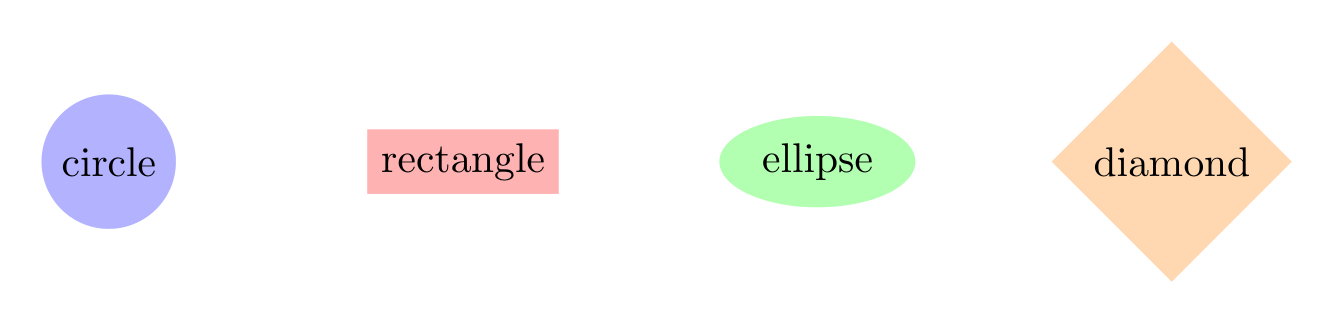
This tutorial explores the visual styling options available in tikzfigure: - node shapes - colors and color mixing - line styles and widths - arrow types - node anchors
Saving and exporting
tikzfigure can export figures in multiple formats and lets you inspect the generated LaTeX code at every level.
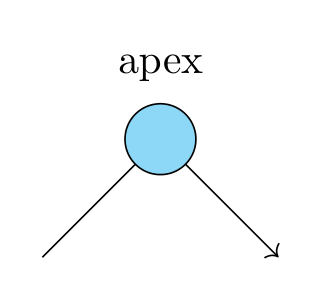
Pyplot-style API
For a quick sketch you can skip the TikzFigure object. The functions of the tikzfigure module draw on an implicit current figure, created the first time one is called, much like matplotlib.pyplot.…
Drawing
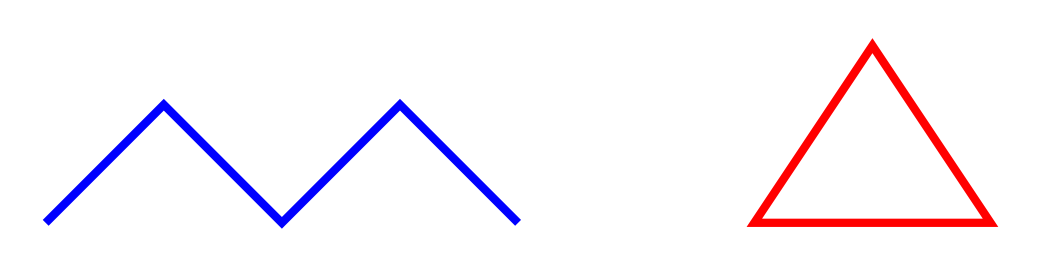
Paths and shapes
Beyond simple node-to-node connections, tikzfigure lets you draw arbitrary paths from lists of (x, y) coordinates.
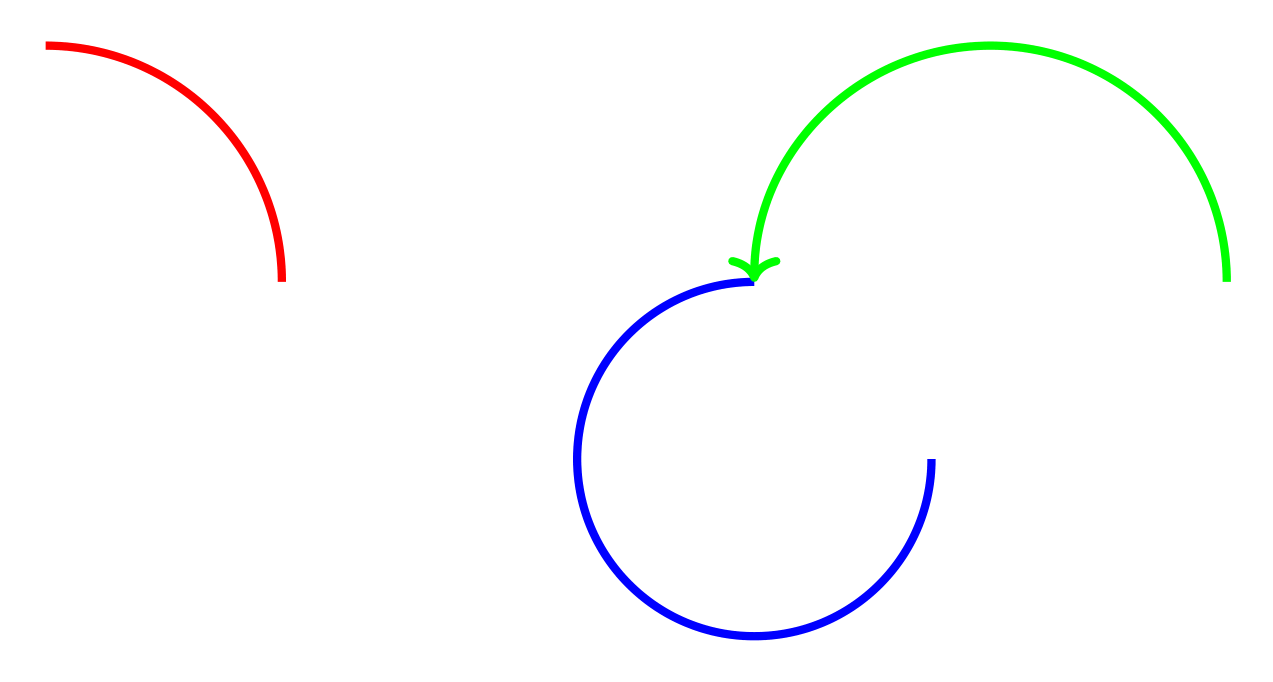
TikZ primitives
tikzfigure wraps common TikZ drawing primitives so you don't need raw LaTeX for standard geometric shapes.
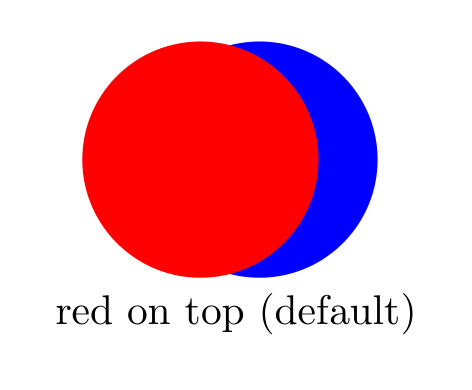
Layers
By default TikZ draws objects in the order they appear in the source, so later objects appear on top of earlier ones. tikzfigure exposes a layer system (backed by pgfonlayer) that lets you control…

Loops
Repetitive structures — grids, chains, matrices of nodes — can be created in two ways: with Python loops that call node / draw many times, or with native TikZ \foreach loops via fig.loop(), which…
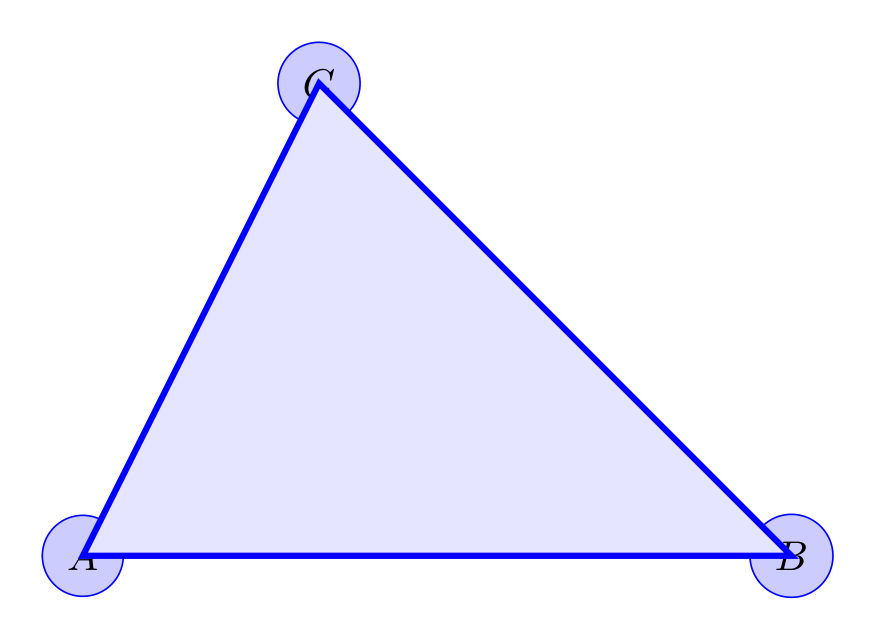
Coordinates and midpoints
tikzfigure can compute new node positions geometrically from existing ones. fig.midpoint(nodea, nodeb) places a new node exactly halfway between two existing nodes. For a lighter alternative with no…
Plots
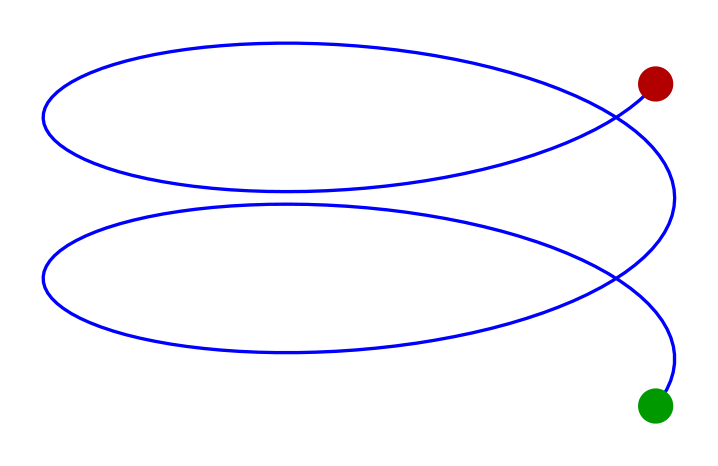
3D Figures
tikzfigure supports 3-D plots via fig.plot3d(xvec, yvec, zvec). Pass ndim=3 when creating the figure to switch to pgfplots' \beginaxis environment with a default perspective of view=2030.
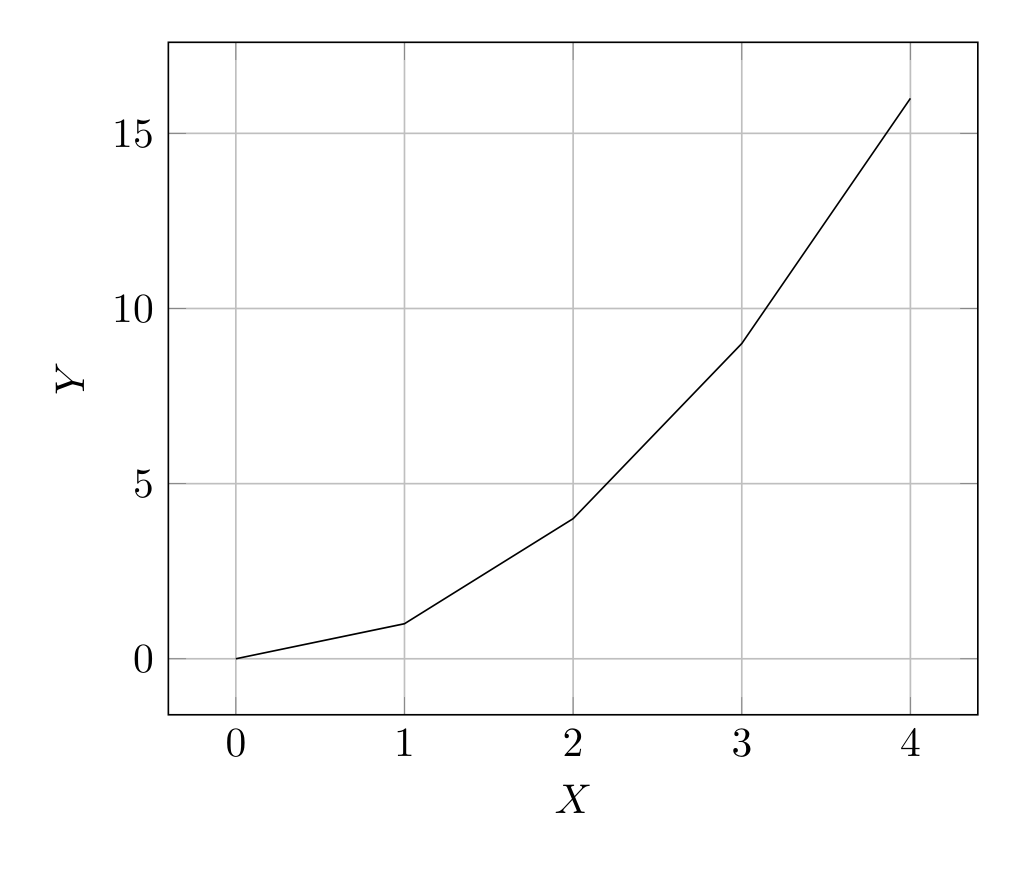
2D plot basics
tikzfigure provides a high-level API for creating publication-quality 2D plots using pgfplots. This tutorial covers the fundamentals:
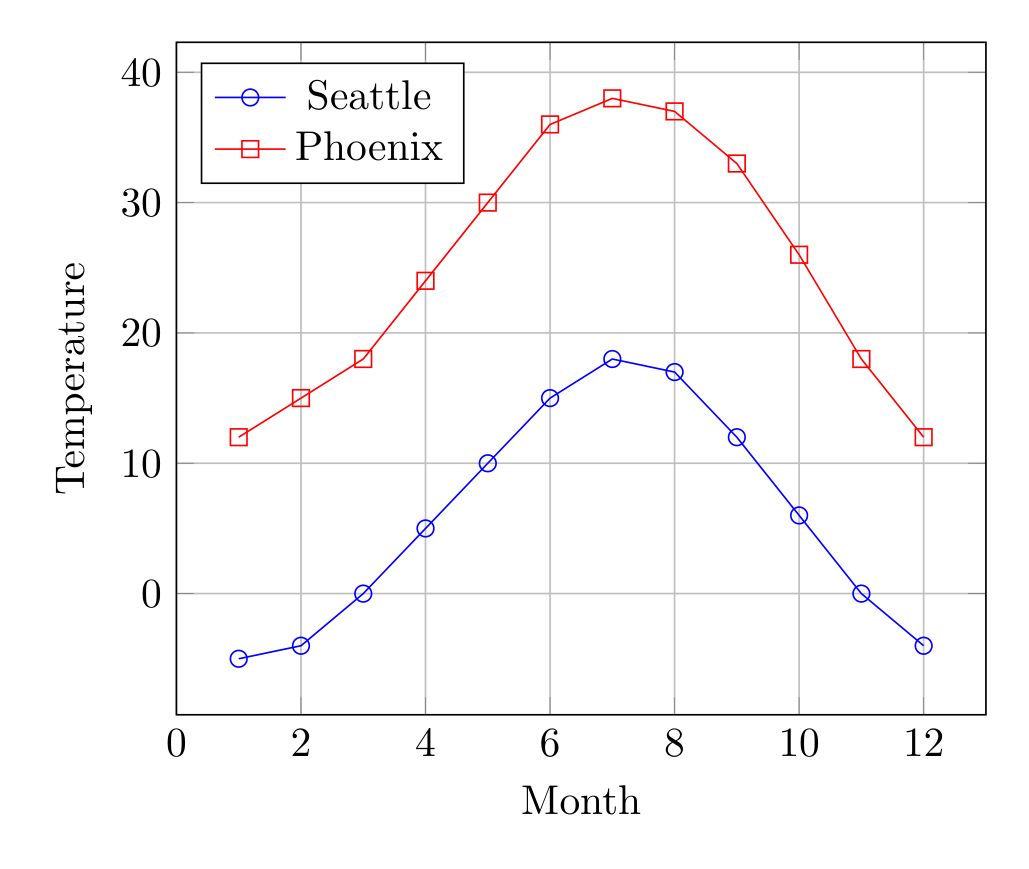
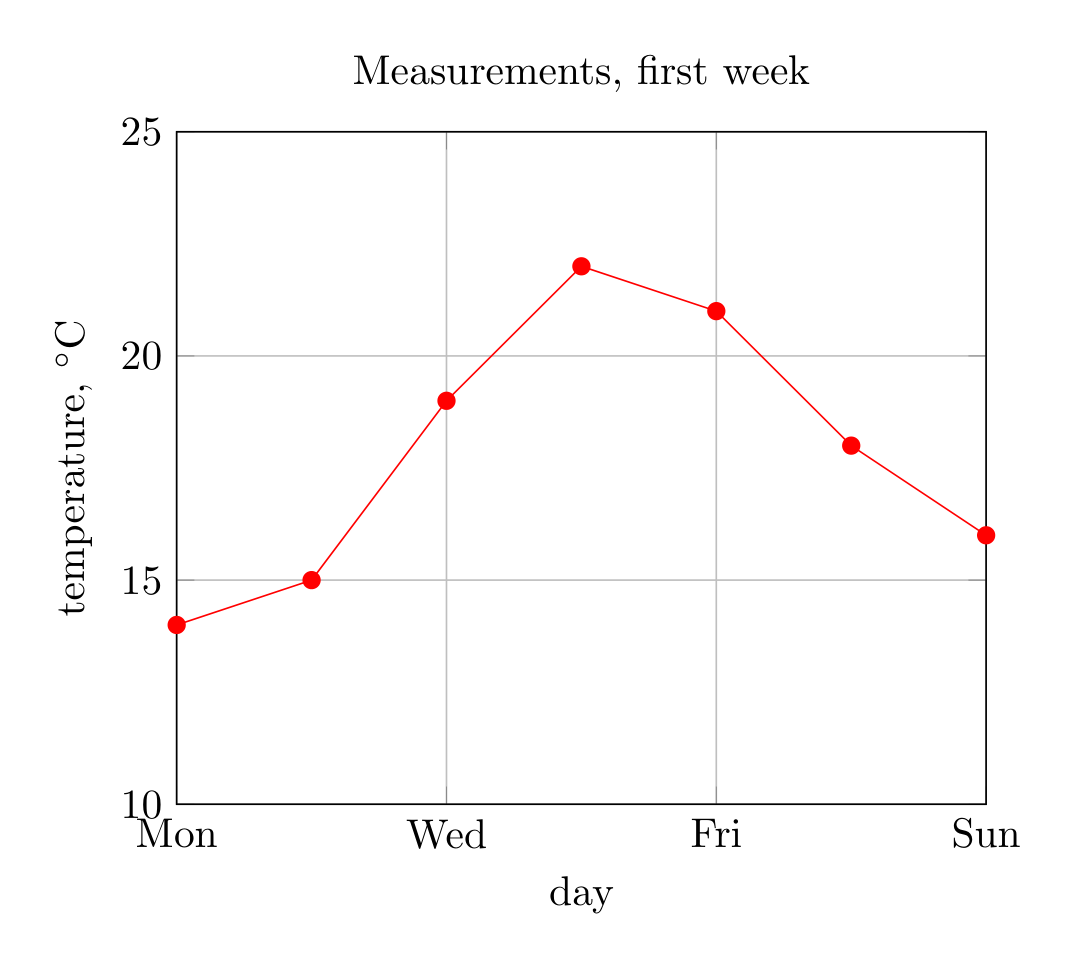
2D plot styling
Customize plot appearance with colors, markers, line styles, and custom ticks.
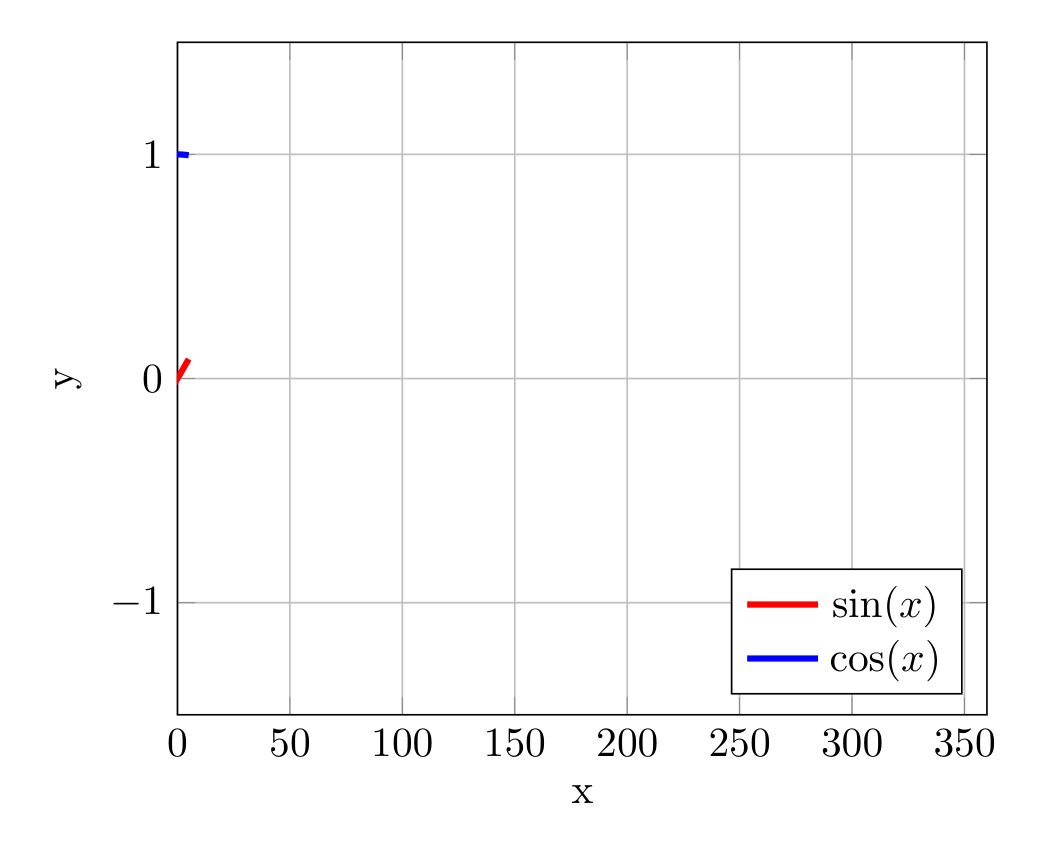
2D plot functions
pgfplots can evaluate mathematical functions directly, and Python's math module gives you full flexibility for data generation.
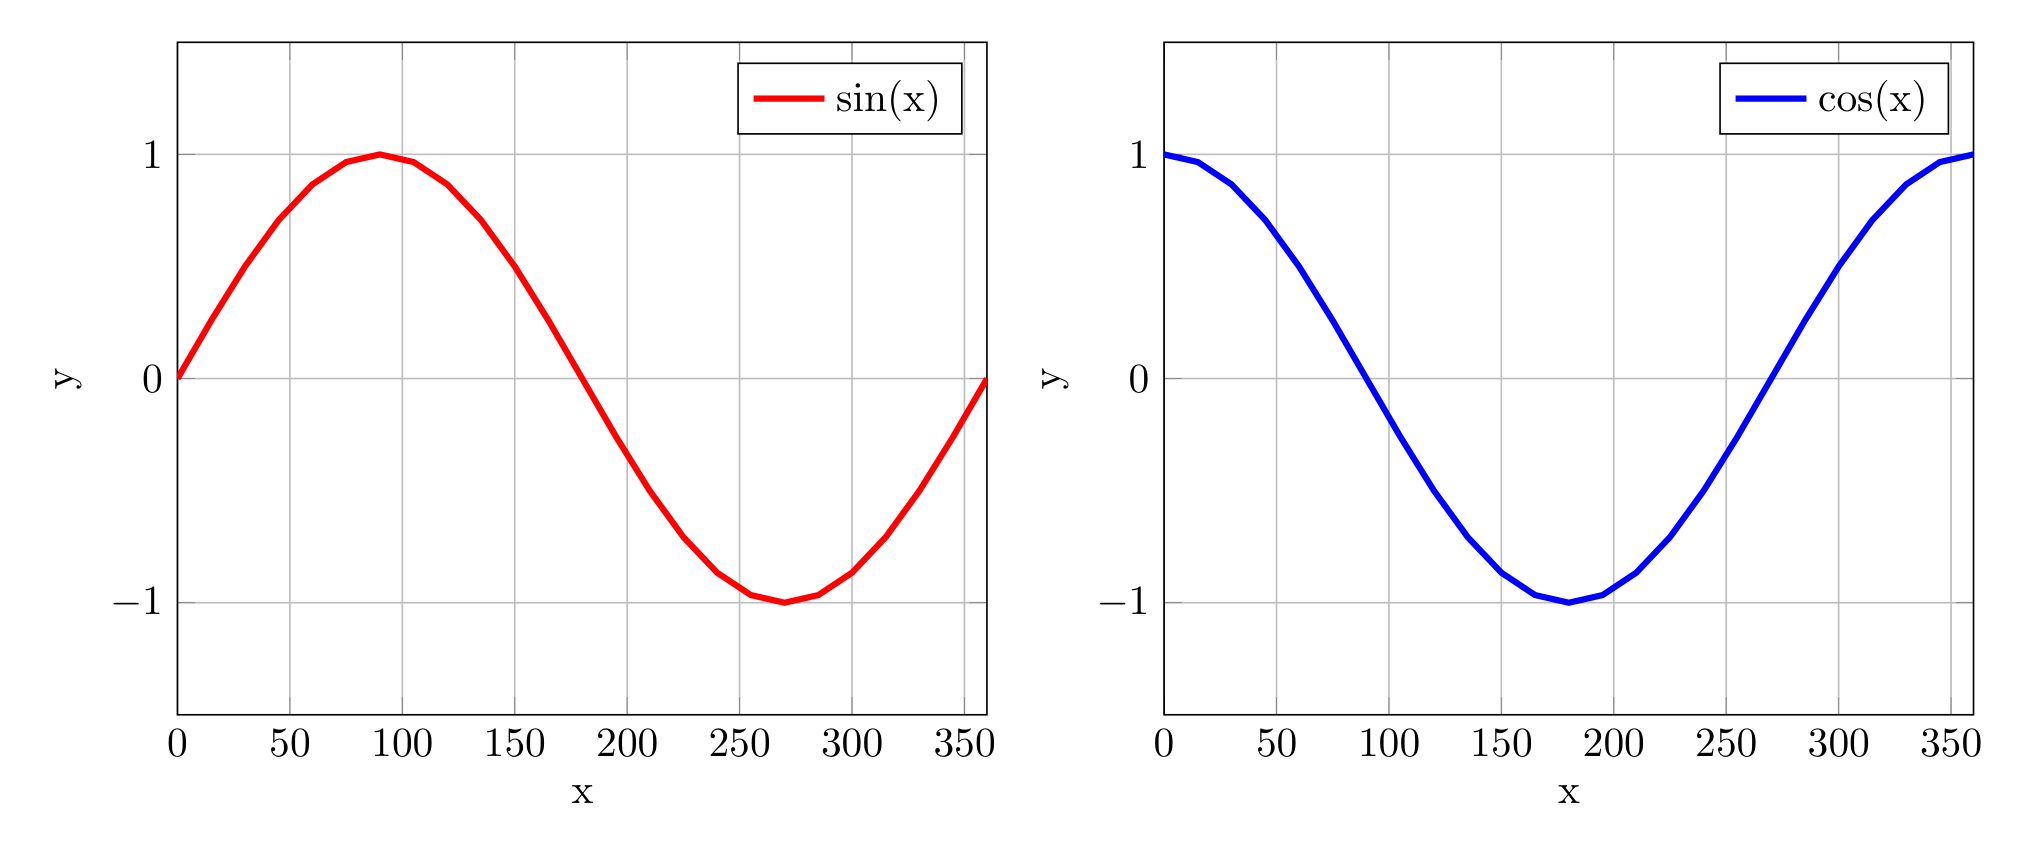
Subfigures and grids
Arrange multiple plots side-by-side or in grid layouts using subfigureaxis() and subfigure().
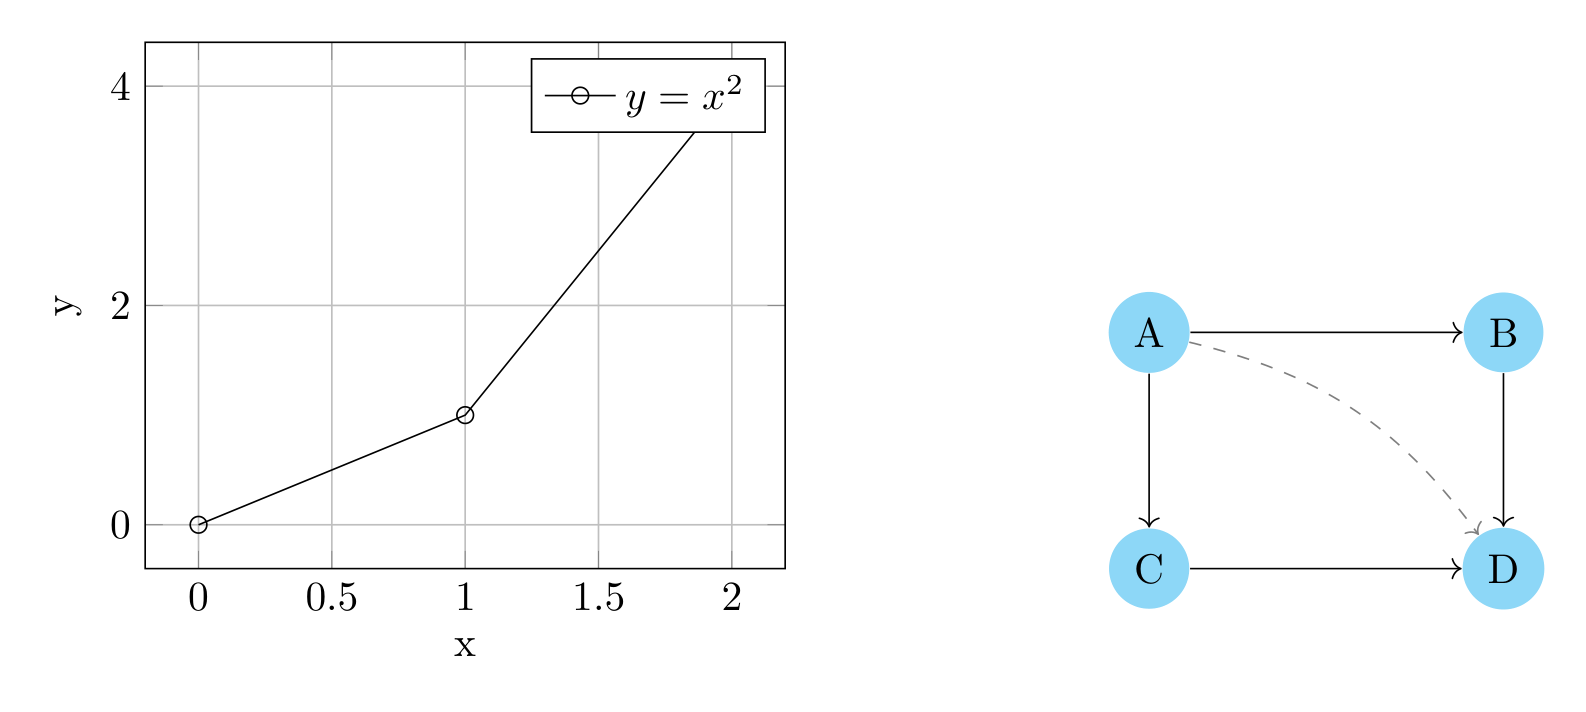
Mixed subfigures
Create sophisticated figures that combine axis-based plots with custom TikZ diagrams (nodes, paths, shapes). Mix them freely in grid layouts.
Images and legends
This tutorial covers what a pgfplots axis holds besides lines:
Advanced
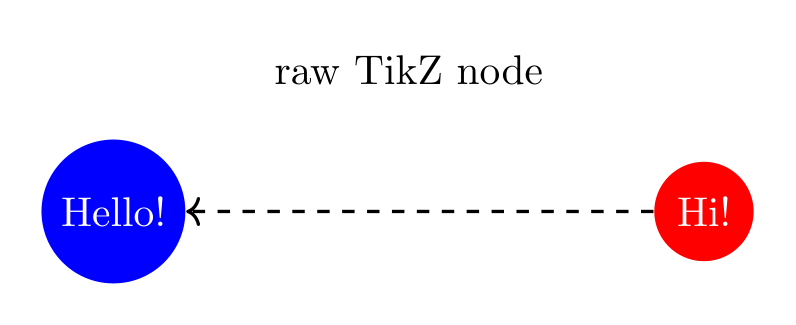
Raw TikZ
tikzfigure covers the most common TikZ operations through its Python API, but TikZ is a vast language. fig.raw(string) injects an arbitrary LaTeX/TikZ snippet directly into the generated code -…
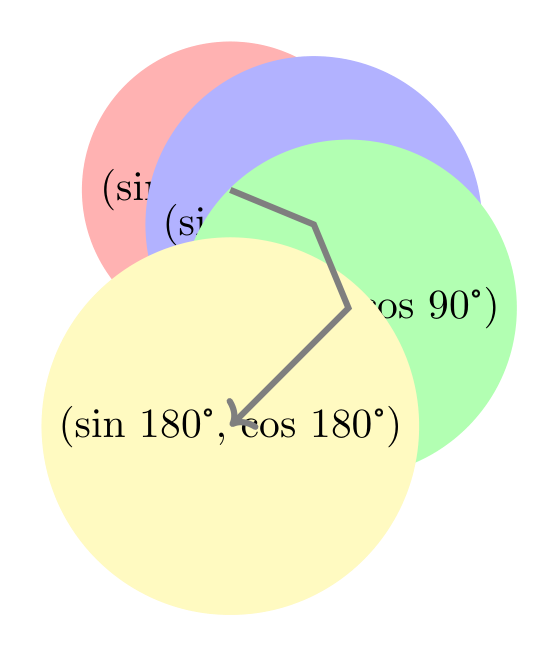
Math expressions
Instead of hardcoding coordinates like (1.5, 2.0), you can write (sin(60), cos(60)) or (Var("radius") 2, Var("angle")) — all as Python code, with full composability and operator support.
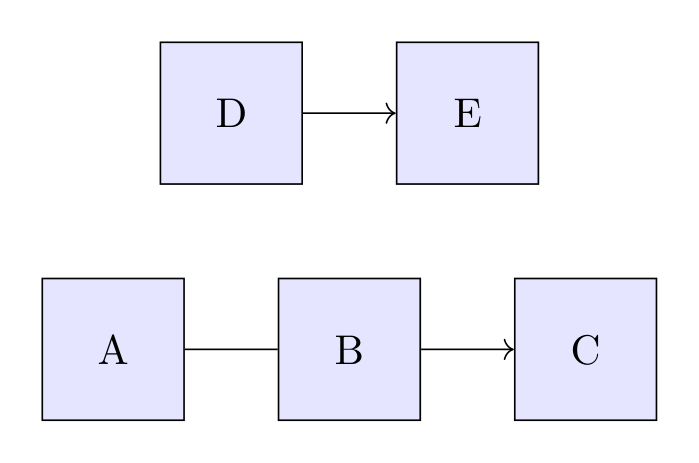
Figure configuration
TikzFigure accepts several constructor parameters that control how the figure is set up in LaTeX. This tutorial covers:
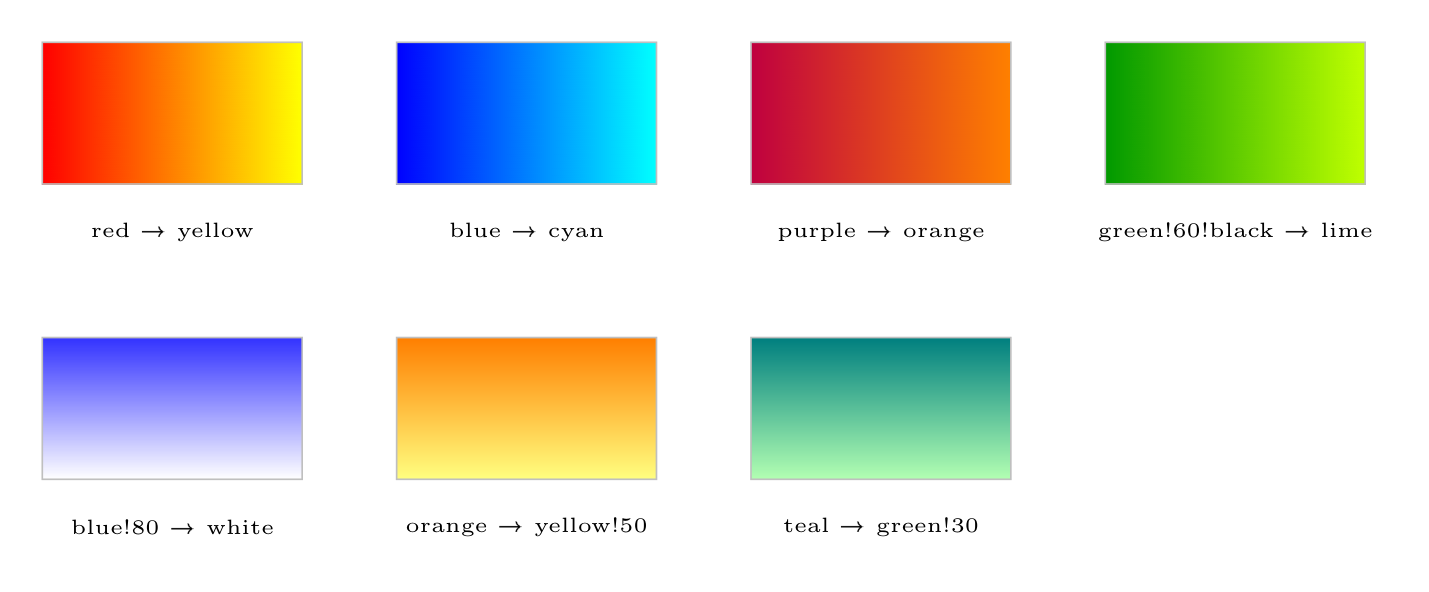
Shading and patterns
TikZ supports rich fill styles beyond solid colors: smooth color gradients (shadings) and repeating geometric fill patterns. This tutorial covers:
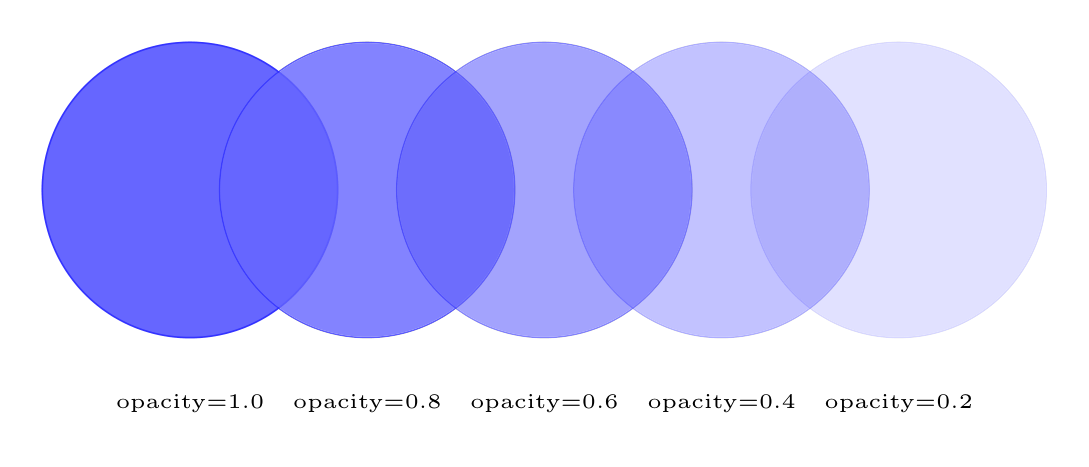
Opacity
tikzfigure provides fine-grained control over transparency at every level: whole nodes, just the fill, just the stroke, paths, and the final PNG background. This tutorial covers:

Decorations
TikZ decorations transform the appearance of paths: a straight line can become a zigzag, a snake wave, a coil spring, or a brace bracket. This tutorial covers the decorations available through…
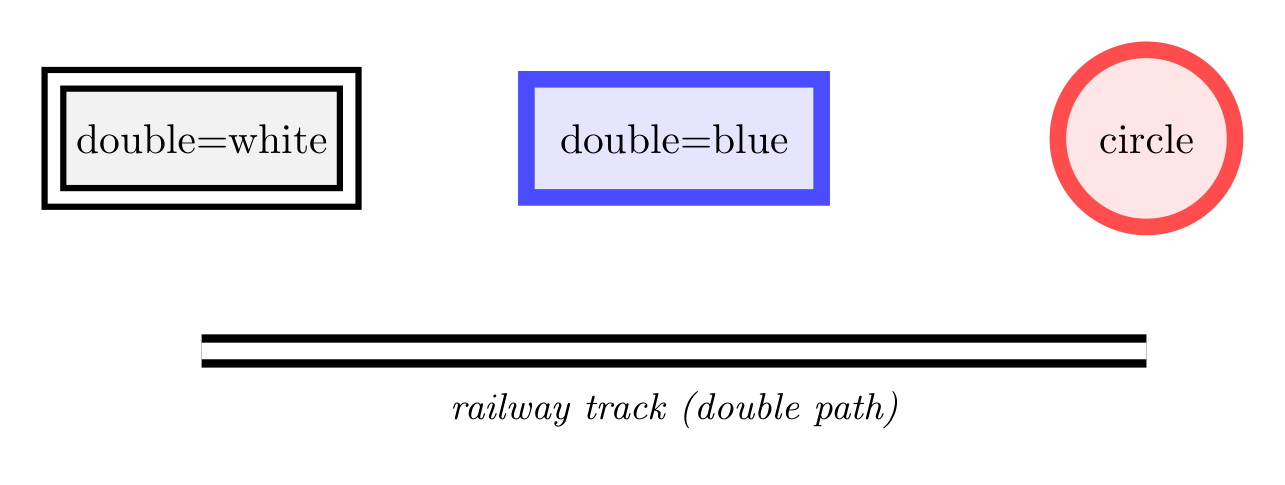
Advanced styling
This tutorial covers advanced visual styling options that go beyond basic colors and line widths:
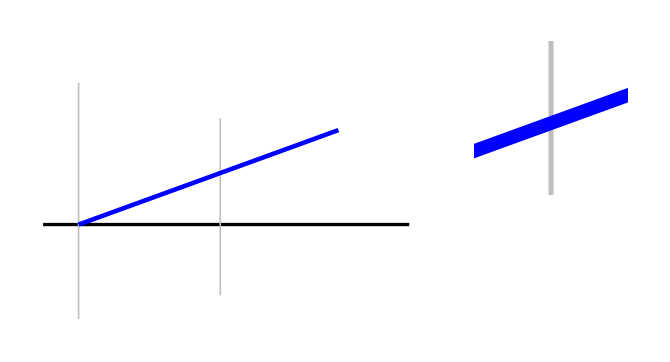
Spy library
This tutorial introduces the dedicated spy API for inset zoom views and magnified regions.
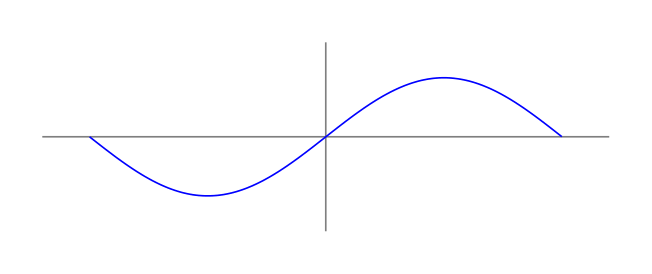
Tokamak X-point
This tutorial builds on Mathematical Expressions and focuses on the plain TikZ plotting API by building up to a stylized tokamak X-point / separatrix drawing in a poloidal cross-section.
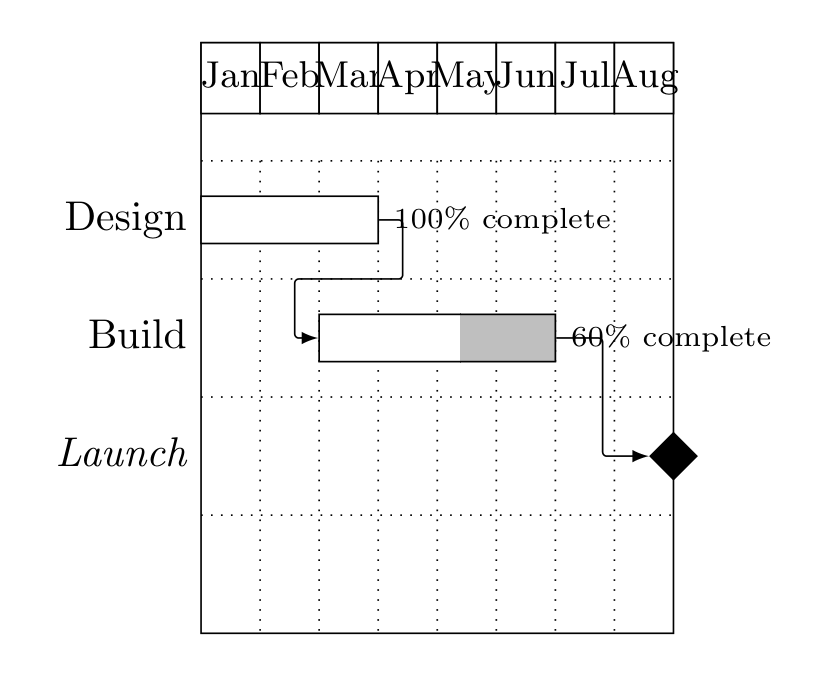
Gantt charts
Gantt charts are useful for showing a project plan, a publication timeline, or any other schedule organized along a numeric time axis. tikzfigure provides a small structured wrapper around LaTeX's…

Parsing TikZ
Most tutorials start from Python and produce TikZ. This one goes the other way: TikzFigure.fromtikzcode reads existing TikZ source and rebuilds it as tikzfigure objects, so you can edit a figure you…
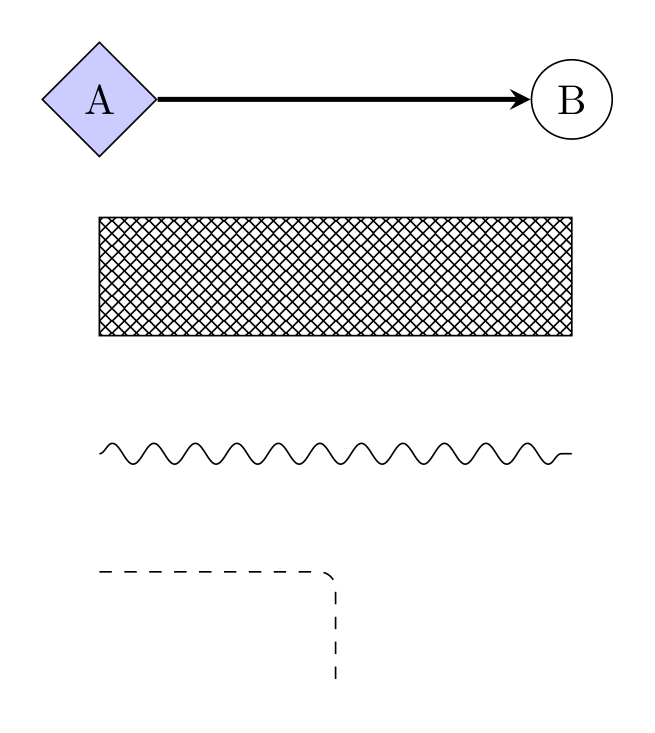
TikZ tokens
Arrow tips, fill patterns, plot marks, node shapes, path decorations and styles are short TikZ strings such as -stealth or crosshatch. tikzfigure gives each kind a small type, all built on TikzToken:…
Integrations
Showcases
Nothing matches.