TikzFigure subplots
This tutorial demonstrates how to create subplots using the tikzfigure backend: side by side, stacked, or in a grid.
Basic 1×2 Layout
Section titled “Basic 1×2 Layout”The simplest use case: two plots side by side.
import numpy as np
from maxplotlib import Canvas
%load_ext autoreload%autoreload 2
# Create a 1×2 canvas with custom widthx = np.linspace(0, 2 * np.pi, 200)canvas, (ax1, ax2) = Canvas.subplots(ncols=2, width="10cm", ratio=0.3)
# Left subplot: sine waveax1.plot(x, np.sin(x), color="royalblue", label="sin(x)", linewidth=1.5)ax1.set_title("sin(x)")ax1.set_xlabel("x")ax1.set_ylabel("amplitude")
# Right subplot: cosine waveax2.plot(x, np.cos(x), color="tomato", label="cos(x)", linewidth=1.5)ax2.set_title("cos(x)")ax2.set_xlabel("x")
# Set overall titlecanvas.suptitle("1 × 2 Layout: Trigonometric Functions")
# Render with tikzfigure backendresult = canvas.show(backend="tikzfigure")2026-10-30 07:52:05.668671936 [W:onnxruntime:Default, device_discovery.cc:95 GetPciBusId] Skipping pci_bus_id for PCI path at "/sys/devices/LNXSYSTM:00/LNXSYBUS:00/ACPI0004:00/MSFT1000:00/5620e0c7-8062-4dce-aeb7-520c7ef76171" because filename "5620e0c7-8062-4dce-aeb7-520c7ef76171" did not match expected pattern of [0-9a-f]+:[0-9a-f]+:[0-9a-f]+[.][0-9a-f]+/home/runner/work/maxplotlib/maxplotlib/.venv/lib/python3.12/site-packages/fitz/__init__.py:17: FutureWarning: The `fitz` API is deprecated and will be removed in future. Use `import pymupdf` instead. warnings.warn(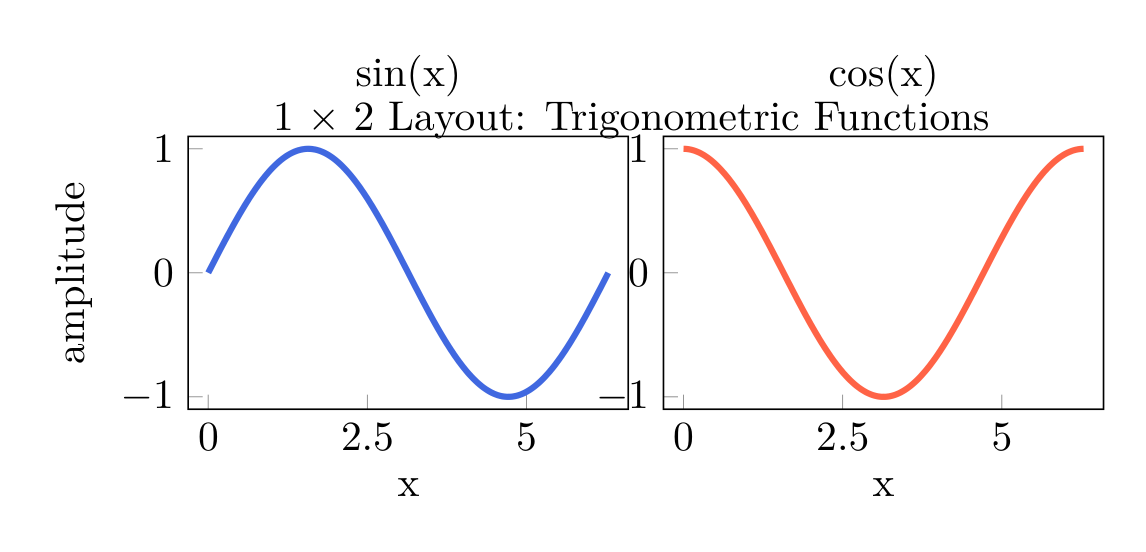
Inspecting the generated subplot dimensions
Section titled “Inspecting the generated subplot dimensions”Every subplot is a pgfplots axis with the position and size Matplotlib gives it: at= is its lower left corner in the figure, width= and height= its box (scale only axis). Printing the \begin{axis}[...] lines makes that explicit.
tikz = canvas.render(backend="tikzfigure")subplot_code = tikz.generate_tikz()
for line in subplot_code.splitlines():    if "\\begin{axis}" in line:        options = line.strip()        print(            [                part                for part in options.split(", ")                if part.startswith(("at=", "width=", "height="))            ]        )
# With width="10cm" and ratio=0.3, the two axes share the figure width.
['at={(0.4921in,0.1299in)}', 'width=1.4669in', 'height=0.9094in]']['at={(2.0764in,0.1299in)}', 'width=1.4669in', 'height=0.9094in]']1×3 Layout: Multiple Functions
Section titled “1×3 Layout: Multiple Functions”You can create layouts with more than 2 subplots.
# Create a 1×3 canvascanvas, axes = Canvas.subplots(ncols=3, width="12cm", ratio=0.35)
# Three different functionsx = np.linspace(0, 2 * np.pi, 100)
axes[0].plot(x, np.sin(x), color="blue")axes[0].set_title("sin(x)")axes[0].set_xlabel("x")
axes[1].plot(x, np.cos(x), color="red")axes[1].set_title("cos(x)")axes[1].set_xlabel("x")
axes[2].plot(x, np.tan(x), color="darkgreen")axes[2].set_title("tan(x)")axes[2].set_xlabel("x")axes[2].set_ylim(-5, 5)  # Limit y-range for tan
canvas.suptitle("1 × 3 Layout: Three Trigonometric Functions")result = canvas.show(backend="tikzfigure")print(result)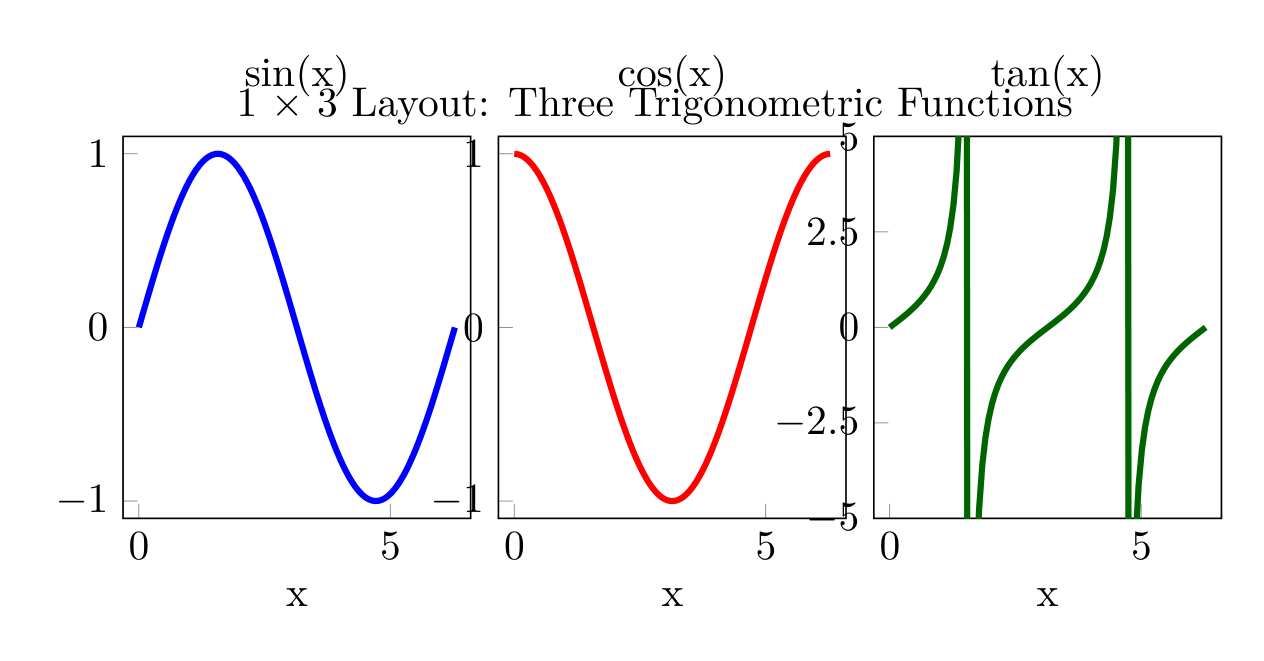
NoneGrids and stacked layouts
Section titled “Grids and stacked layouts”Any nrows × ncols layout converts, with shared axes and hidden tick labels as in Matplotlib.
canvas, axes = Canvas.subplots(nrows=2, ncols=2, width="12cm", ratio=0.6)x = np.linspace(0, 2 * np.pi, 100)for index, ax in enumerate(np.ravel(axes)):    ax.plot(x, np.sin((index + 1) * x), color=f"C{index}")    ax.set_title(f"sin({index + 1}x)")
canvas.show(backend="tikzfigure")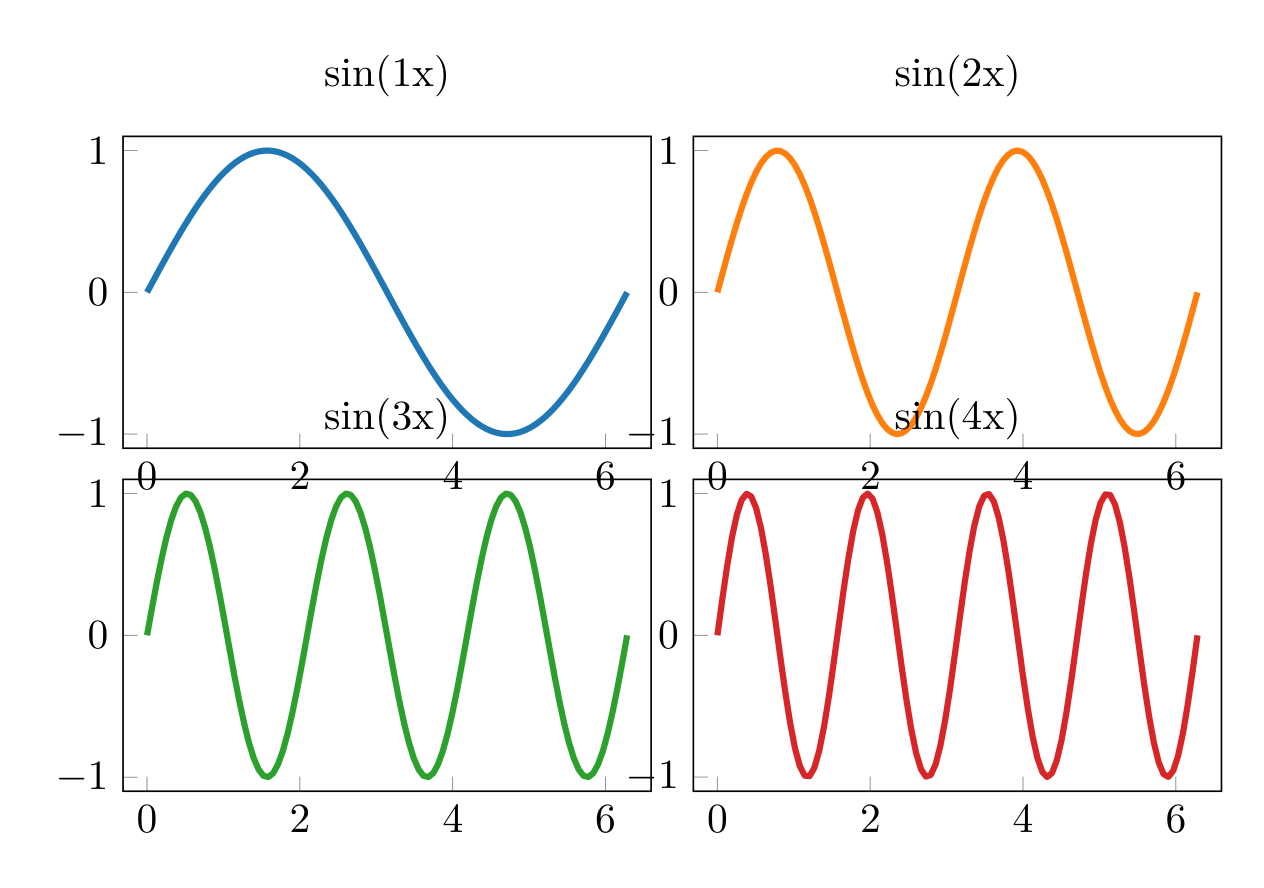
Important Notes
Section titled “Important Notes”- Any layout converts: rows, columns and grids, with shared and twin axes, as Matplotlib lays them out
- Each subplot’s title becomes a pgfplots
title=entry in the generated LaTeX output - Meshes, images and colorbars are included as images; see Tutorial 07 for what becomes what