Multiple subplots
This notebook shows all the ways to build multi-panel figures with maxplotlib:
Canvas.subplots(ncols=...)/Canvas.subplots(nrows=..., ncols=...)squeeze=Falsefor a consistent 2-D axes list- Manual layout with
canvas.add_subplot(row=..., col=...) - Accessing subplots:
canvas.subplot(),canvas[row, col],canvas.iter_subplots() - Figure-level title with
canvas.suptitle() - Canvas-level plot routing to a specific subplot
import numpy as npfrom tikzfigure import TikzFigure
from maxplotlib import Canvas
%matplotlib inline%load_ext autoreload%autoreload 2
x = np.linspace(0, 2 * np.pi, 200)
Backend selection
Section titled “Backend selection”All examples in this tutorial use the same Canvas API; you can switch rendering backends at any time:
BACKEND = "matplotlib"for static Matplotlib outputBACKEND = "plotly"for interactive Plotly output (Jupyter-friendly)
Most cells end with canvas.show(backend=BACKEND) so you can re-run the whole notebook with a different backend.
# Change to "plotly" for interactive outputBACKEND = "matplotlib"fig = TikzFigure()
x = np.linspace(0, 360, 200)y1 = np.sin(np.radians(x))y2 = np.cos(np.radians(x))
# First subfigure: sine waveax1 = fig.subfigure_axis( xlabel="x", ylabel="y", xlim=(0, 360), ylim=(-1.5, 1.5), grid=True, title="Sine Function", width=0.45,)ax1.add_plot(x=x, y=y1, label="sin(x)", color="red", line_width="1.5pt")ax1.set_legend(position="north east")
# Second subfigure: cosine waveax2 = fig.subfigure_axis( xlabel="x", ylabel="y", xlim=(0, 360), ylim=(-1.5, 1.5), grid=True, title="Cosine Function", width=0.45,)ax2.add_plot(x=x, y=y2, label="cos(x)", color="blue", line_width="1.5pt")ax2.set_legend(position="north east")
fig.show()2026-10-30 07:52:23.669151421 [W:onnxruntime:Default, device_discovery.cc:95 GetPciBusId] Skipping pci_bus_id for PCI path at "/sys/devices/LNXSYSTM:00/LNXSYBUS:00/ACPI0004:00/MSFT1000:00/5620e0c7-8062-4dce-aeb7-520c7ef76171" because filename "5620e0c7-8062-4dce-aeb7-520c7ef76171" did not match expected pattern of [0-9a-f]+:[0-9a-f]+:[0-9a-f]+[.][0-9a-f]+/home/runner/work/maxplotlib/maxplotlib/.venv/lib/python3.12/site-packages/fitz/__init__.py:17: FutureWarning: The `fitz` API is deprecated and will be removed in future. Use `import pymupdf` instead. warnings.warn(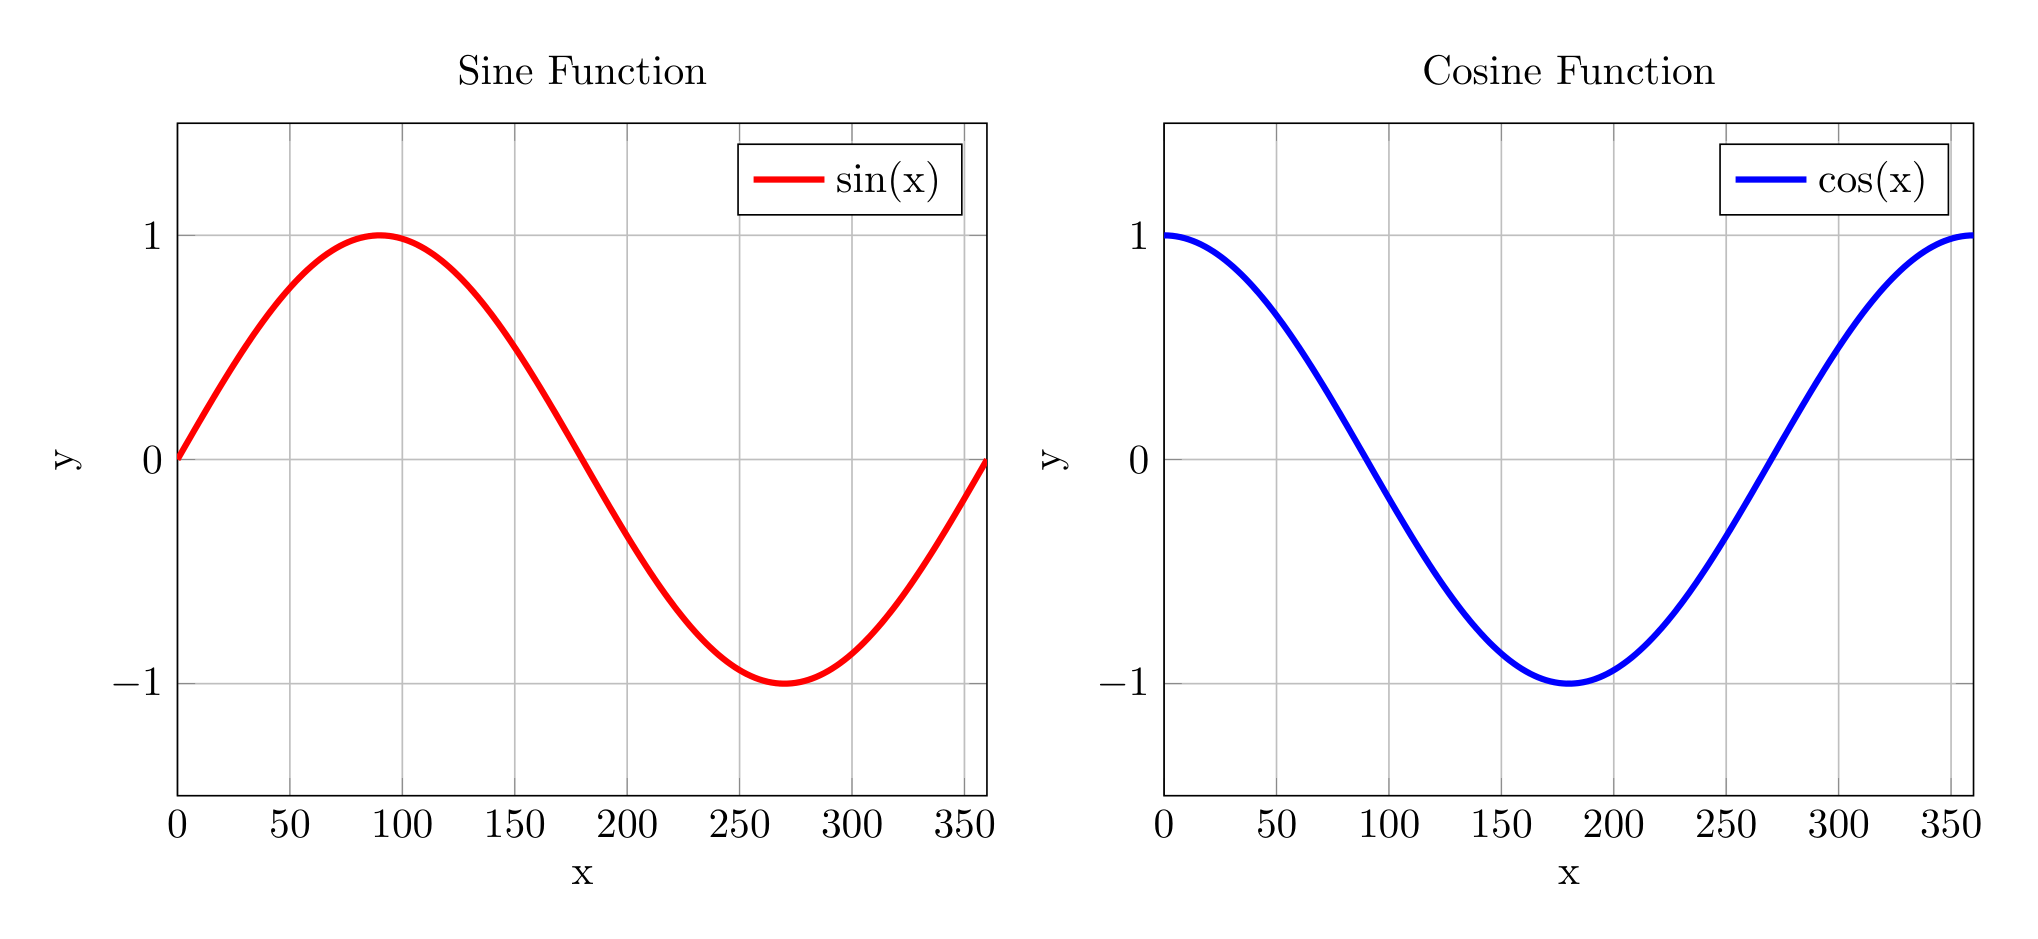
1 1×2 layout — side-by-side subplots
Section titled “1 1×2 layout — side-by-side subplots”canvas, (ax1, ax2) = Canvas.subplots(ncols=2, width=1000, ratio=0.3)
x = np.linspace(0, 2 * np.pi, 200)
ax1.plot(x, np.sin(x), color="royalblue", linewidth=1.5)ax1.set_title("sin(x)")ax1.set_xlabel("x")ax1.set_ylabel("amplitude")
ax2.plot(x, np.cos(x), color="tomato", linewidth=1.5)ax2.set_title("cos(x)")ax2.set_xlabel("x")
canvas.suptitle("1 × 2 Layout")canvas.show(backend="tikzfigure")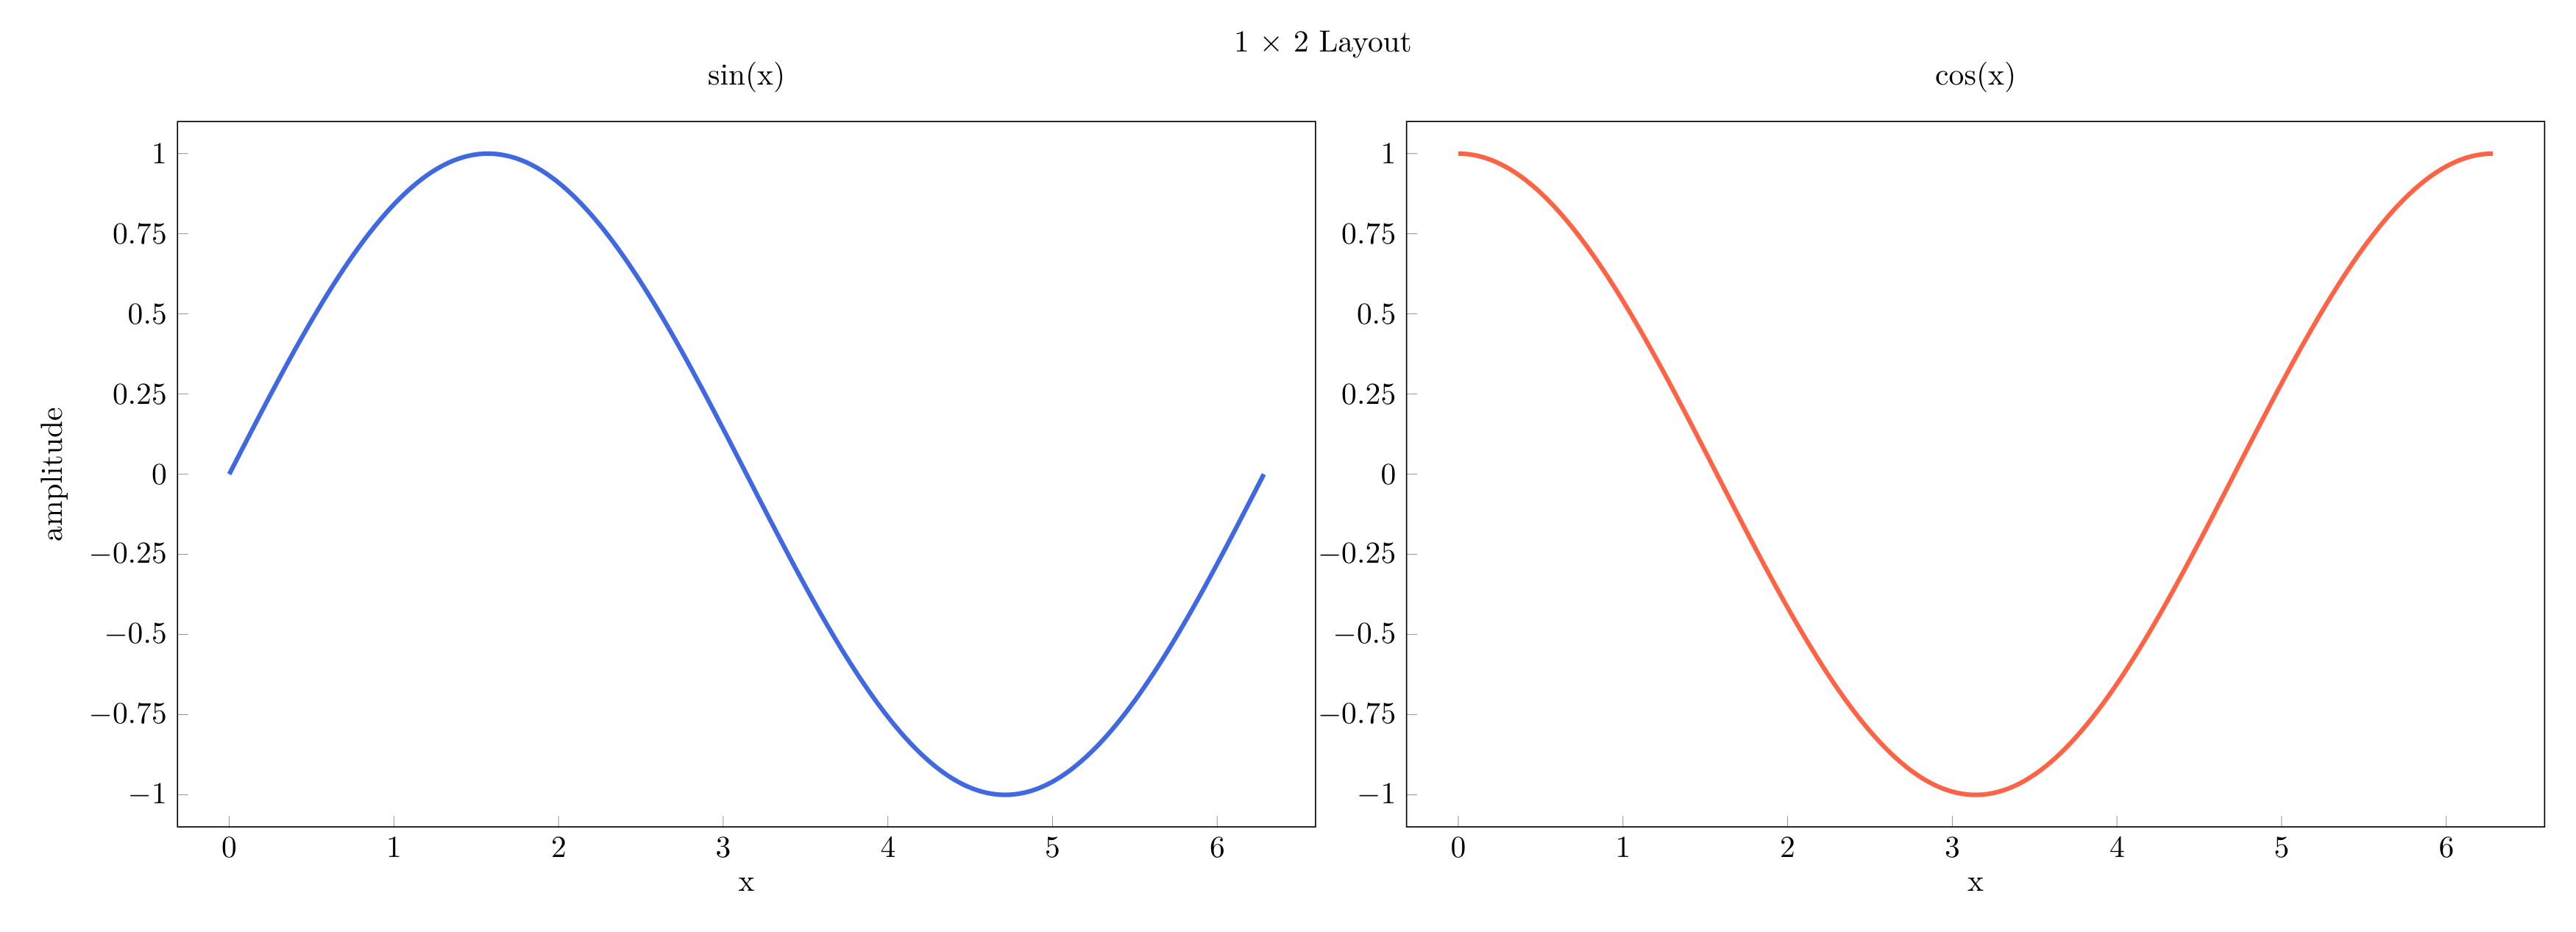
2 2×2 layout — grid of subplots
Section titled “2 2×2 layout — grid of subplots”Canvas.subplots(nrows=2, ncols=2) returns a 2-D list of subplot axes
indexed as axes[row][col].
canvas, axes = Canvas.subplots(nrows=2, ncols=2)
axes[0][0].plot(x, np.sin(x), color="royalblue")axes[0][0].set_title("sin(x)")axes[0][1].plot(x, np.cos(x), color="tomato")axes[0][1].set_title("cos(x)")axes[1][0].plot(x, np.sin(2 * x), color="seagreen")axes[1][0].set_title("sin(2x)")axes[1][1].plot(x, np.cos(2 * x), color="darkorange")axes[1][1].set_title("cos(2x)")
canvas.suptitle("2 × 2 Layout")canvas.show(backend=BACKEND)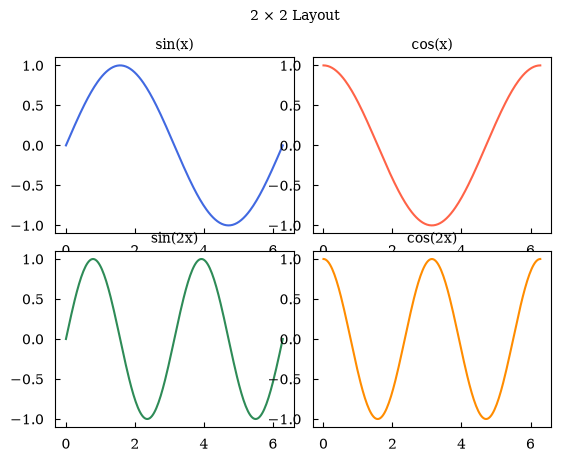
(<Figure size 640x480 with 4 Axes>, array([[<Axes: title={'center': 'sin(x)'}>, <Axes: title={'center': 'cos(x)'}>], [<Axes: title={'center': 'sin(2x)'}>, <Axes: title={'center': 'cos(2x)'}>]], dtype=object))3 squeeze=False — always get a 2-D list
Section titled “3 squeeze=False — always get a 2-D list”By default a 1×N or N×1 grid returns a flat list. Pass squeeze=False to
always get a 2-D nested list — useful when your layout code must be generic.
canvas, axes = Canvas.subplots(nrows=1, ncols=3, squeeze=False)
# axes is always [[ax0, ax1, ax2]] — index as axes[row][col]data = [np.sin(x), np.cos(x), np.tan(np.clip(x, 0, np.pi - 0.1))]titles = ["sin", "cos", "tan (clipped)"]
for col, (d, t) in enumerate(zip(data, titles)):    axes[0][col].plot(x, d, color="steelblue")    axes[0][col].set_title(t)
canvas.show(backend=BACKEND)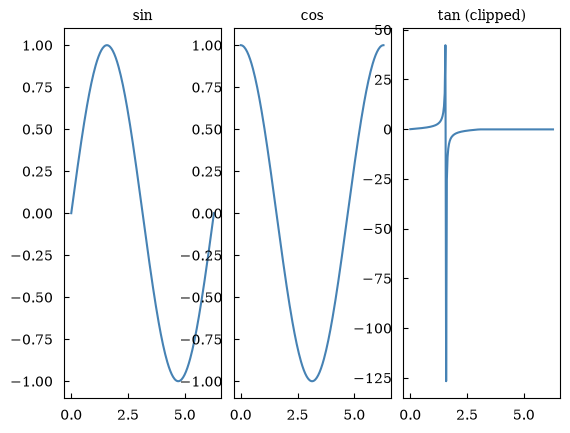
(<Figure size 640x480 with 3 Axes>, array([[<Axes: title={'center': 'sin'}>, <Axes: title={'center': 'cos'}>, <Axes: title={'center': 'tan (clipped)'}>]], dtype=object))4 Manual layout — canvas.add_subplot(row, col)
Section titled “4 Manual layout — canvas.add_subplot(row, col)”You can build the layout yourself by calling add_subplot explicitly. This
lets you configure each panel’s title, labels, grid, and legend in one shot.
canvas = Canvas(nrows=2, ncols=2)
ax00 = canvas.add_subplot(    row=0, col=0, title="Top-left", xlabel="x", ylabel="y", grid=True)ax01 = canvas.add_subplot(row=0, col=1, title="Top-right", xlabel="x", grid=True)ax10 = canvas.add_subplot(row=1, col=0, title="Bottom-left", xlabel="x", ylabel="y")ax11 = canvas.add_subplot(row=1, col=1, title="Bottom-right", xlabel="x", legend=True)
ax00.plot(x, np.sin(x), color="royalblue")ax01.plot(x, np.cos(x), color="tomato")ax10.plot(x, np.sin(2 * x), color="seagreen")ax11.plot(x, np.sin(x), label="sin", color="royalblue")ax11.plot(x, np.cos(x), label="cos", color="tomato")
canvas.suptitle("Manual Layout")canvas.show(backend=BACKEND)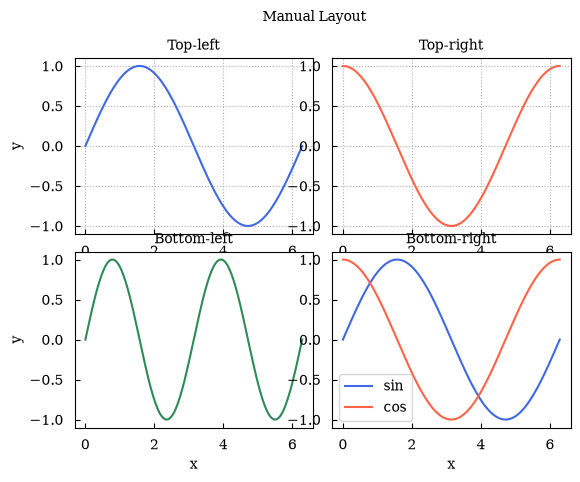
(<Figure size 640x480 with 4 Axes>, array([[<Axes: title={'center': 'Top-left'}, xlabel='x', ylabel='y'>, <Axes: title={'center': 'Top-right'}, xlabel='x'>], [<Axes: title={'center': 'Bottom-left'}, xlabel='x', ylabel='y'>, <Axes: title={'center': 'Bottom-right'}, xlabel='x'>]], dtype=object))5 Accessing subplots after creation
Section titled “5 Accessing subplots after creation”Three equivalent ways to retrieve a subplot object:
canvas, axes = Canvas.subplots(nrows=2, ncols=2)
# Method A: use the object returned by subplots()axes[0][0].set_title("Method A")
# Method B: canvas.subplot(row, col)sp_b = canvas.subplot(row=0, col=1)sp_b.set_title("Method B")
# Method C: canvas[row, col] indexingcanvas[1, 0].set_title("Method C")canvas[1, 1].set_title("Method D (index)")
canvas.show(backend=BACKEND)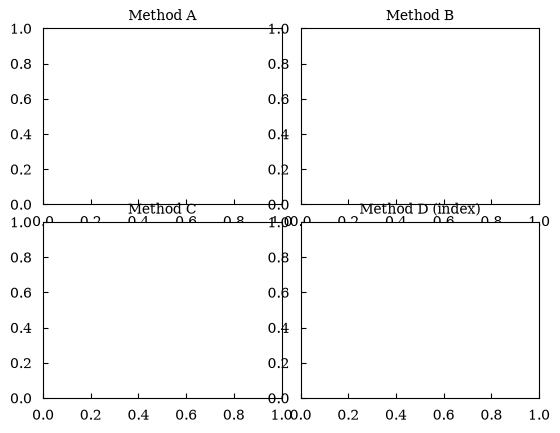
(<Figure size 640x480 with 4 Axes>, array([[<Axes: title={'center': 'Method A'}>, <Axes: title={'center': 'Method B'}>], [<Axes: title={'center': 'Method C'}>, <Axes: title={'center': 'Method D (index)'}>]], dtype=object))6 canvas.iter_subplots() — loop over all panels
Section titled “6 canvas.iter_subplots() — loop over all panels”canvas, axes = Canvas.subplots(nrows=2, ncols=2)
# Plot something in every panel firstfor row in range(2): for col in range(2): axes[row][col].plot(x, np.sin((row + 1) * (col + 1) * x))
# Then enable grid on every panel uniformlyfor row, col, sp in canvas.iter_subplots(): sp.set_grid(True) sp.set_xlabel("x")
canvas.show(backend=BACKEND)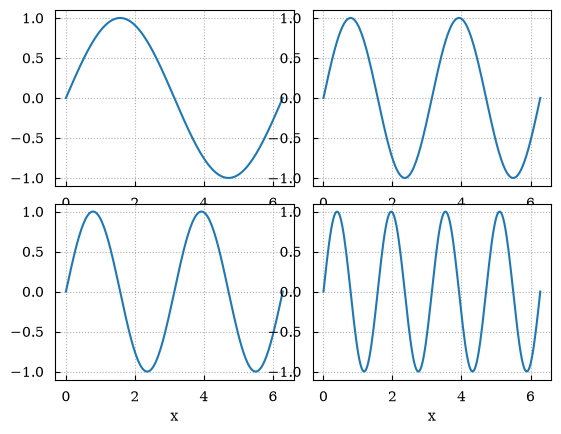
(<Figure size 640x480 with 4 Axes>, array([[<Axes: xlabel='x'>, <Axes: xlabel='x'>], [<Axes: xlabel='x'>, <Axes: xlabel='x'>]], dtype=object))7 Canvas-level plot routing
Section titled “7 Canvas-level plot routing”Pass row= and col= to canvas-level methods to target a specific subplot.
canvas = Canvas(nrows=1, ncols=2)canvas.add_subplot(row=0, col=0, title="Left", xlabel="x", ylabel="sin")canvas.add_subplot(row=0, col=1, title="Right", xlabel="x", ylabel="cos")
canvas.plot(x, np.sin(x), row=0, col=0, color="royalblue", label="sin")canvas.plot(x, np.cos(x), row=0, col=1, color="tomato", label="cos")
canvas.set_legend(True, row=0, col=0)canvas.set_legend(True, row=0, col=1)canvas.suptitle("Canvas-level routing")canvas.show(backend=BACKEND)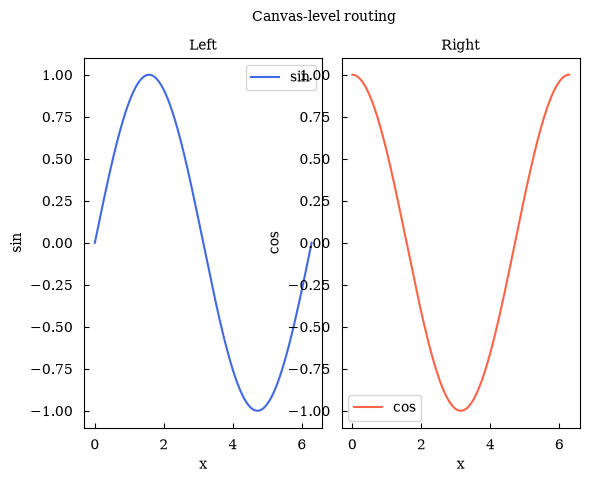
(<Figure size 640x480 with 2 Axes>, array([[<Axes: title={'center': 'Left'}, xlabel='x', ylabel='sin'>, <Axes: title={'center': 'Right'}, xlabel='x', ylabel='cos'>]], dtype=object))Summary
Section titled “Summary”| Task | Code |
|---|---|
| 1×2 grid | canvas, (ax1, ax2) = Canvas.subplots(ncols=2) |
| 2×2 grid | canvas, axes = Canvas.subplots(nrows=2, ncols=2) — index axes[r][c] |
| Always 2-D | Canvas.subplots(..., squeeze=False) |
| Manual panel | canvas.add_subplot(row=r, col=c, ...) |
| Get subplot | canvas.subplot(r, c) or canvas[r, c] |
| Loop panels | for row, col, sp in canvas.iter_subplots() |
| Figure title | canvas.suptitle('...') |
| Route plot | canvas.plot(x, y, row=r, col=c) |
Next: Tutorial 03 covers all the available plot types.