Advanced Matplotlib
Advanced Matplotlib plotting
Section titled “Advanced Matplotlib plotting”This tutorial covers horizontal bars, histograms, filled regions, reference spans, arrows, infinitely extending lines, and secondary y-axes.
import numpy as np
from maxplotlib import Canvas
x = np.linspace(0, 2 * np.pi, 200)
Common plotting primitives
Section titled “Common plotting primitives”canvas = Canvas(width="12cm", ratio=0.65)canvas.barh([0, 1, 2], [2, 4, 3], color="steelblue", alpha=0.8)canvas.set_yticks([0, 1, 2], labels=["A", "B", "C"])canvas.set_xlabel("Amount")canvas.set_title("Horizontal bars")canvas.show()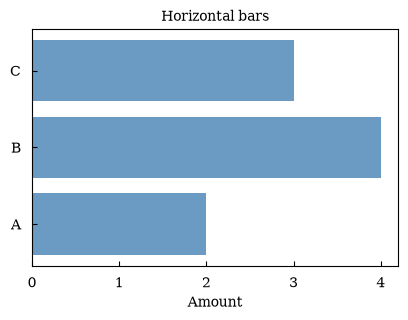
(<Figure size 472.441x307.087 with 1 Axes>, array([[<Axes: title={'center': 'Horizontal bars'}, xlabel='Amount'>]], dtype=object))samples = np.random.default_rng(4).normal(size=1000)canvas = Canvas()canvas.hist(samples, bins=30, color="slateblue", alpha=0.75)canvas.set_xlabel("Value")canvas.set_ylabel("Count")canvas.set_title("Distribution")canvas.show()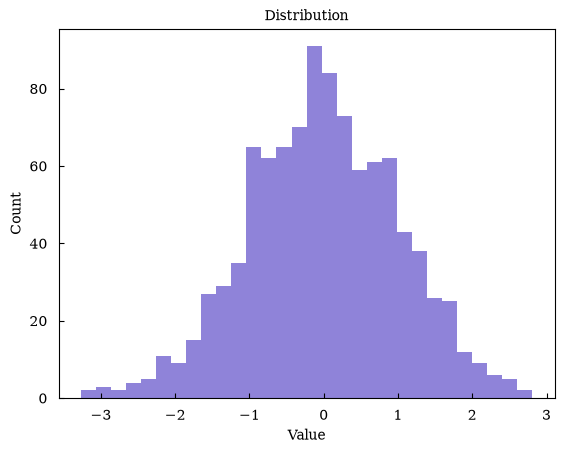
(<Figure size 640x480 with 1 Axes>, array([[<Axes: title={'center': 'Distribution'}, xlabel='Value', ylabel='Count'>]], dtype=object))Steps, stairs, broken bars, and pie charts
Section titled “Steps, stairs, broken bars, and pie charts”canvas = Canvas()canvas.step([0, 1, 2, 3], [1, 3, 2, 4], where="mid", label="step")canvas.stairs([1, 2, 1], edges=[0, 1, 2, 3], color="purple", label="stairs")canvas.set_title("Discrete data")canvas.set_legend(True)canvas.show()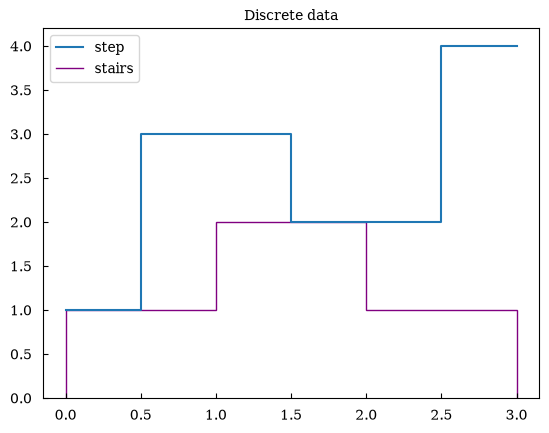
(<Figure size 640x480 with 1 Axes>, array([[<Axes: title={'center': 'Discrete data'}>]], dtype=object))canvas = Canvas()canvas.broken_barh([(0, 1), (1.5, 0.75), (2.75, 1.0)], (0, 0.6), color="orange")canvas.set_xlabel("Intervals")canvas.show()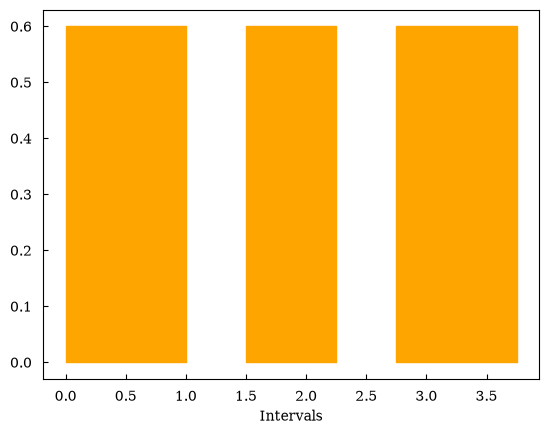
(<Figure size 640x480 with 1 Axes>, array([[<Axes: xlabel='Intervals'>]], dtype=object))canvas = Canvas()canvas.pie([30, 45, 25], labels=["A", "B", "C"], autopct="%1.0f%%")canvas.set_title("Shares")canvas.show()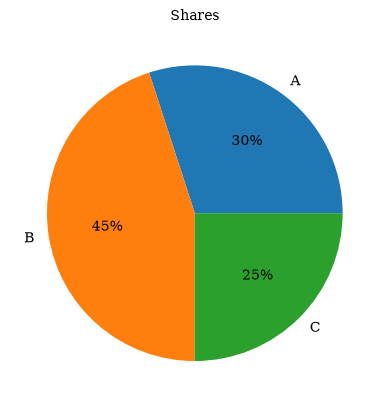
(<Figure size 640x480 with 1 Axes>, array([[<Axes: title={'center': 'Shares'}>]], dtype=object))Regions, arrows, and reference lines
Section titled “Regions, arrows, and reference lines”canvas = Canvas()canvas.plot(x, np.sin(x), color="black")canvas.fill_betweenx([-1, 0, 1], 0.5, [1.0, 1.5, 2.0], alpha=0.2)canvas.axvspan(1.0, 2.0, color="orange", alpha=0.2)canvas.axhspan(-0.25, 0.25, color="steelblue", alpha=0.15)canvas.arrow(2.0, np.sin(2.0), 0.5, 0.3, length_includes_head=True)canvas.axline((0, 0), slope=0.2, linestyle="--", color="crimson")canvas.show()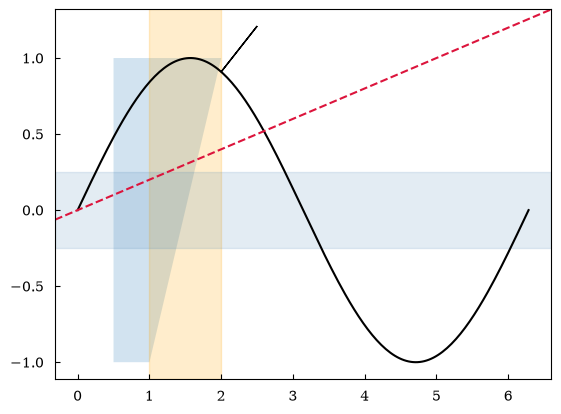
(<Figure size 640x480 with 1 Axes>, array([[<Axes: >]], dtype=object))Secondary y-axis
Section titled “Secondary y-axis”twin_canvas, primary = Canvas.subplots()secondary = twin_canvas.twinx()
primary.plot(x, np.sin(x), color="tab:blue")secondary.plot(x, 100 * np.cos(x), color="tab:red")primary.set_xlabel("Time")primary.set_ylabel("sin(x)", color="tab:blue")secondary.set_ylabel("100 cos(x)", color="tab:red")twin_canvas.set_title("Two scales sharing one x-axis")twin_canvas.show()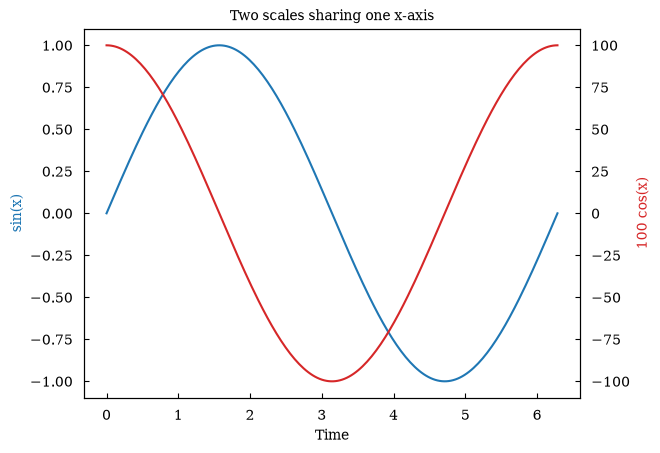
(<Figure size 640x480 with 2 Axes>, array([[<Axes: title={'center': 'Two scales sharing one x-axis'}, xlabel='Time', ylabel='sin(x)'>]], dtype=object))Secondary y-axes are supported by the Matplotlib and Plotly backends.
The plotext and TikZ backends currently reject a canvas containing
twinx() plots instead of silently producing an incorrect figure.
Scientific field plots
Section titled “Scientific field plots”x = np.linspace(-1, 1, 40)y = np.linspace(-1, 1, 40)xx, yy = np.meshgrid(x, y)z = xx**2 + yy**2
canvas = Canvas()canvas.contour(x, y, z, colors="black")canvas.contourf(x, y, z, alpha=0.5)canvas.pcolormesh(x, y, z, alpha=0.25)canvas.set_title("Scalar field")canvas.show()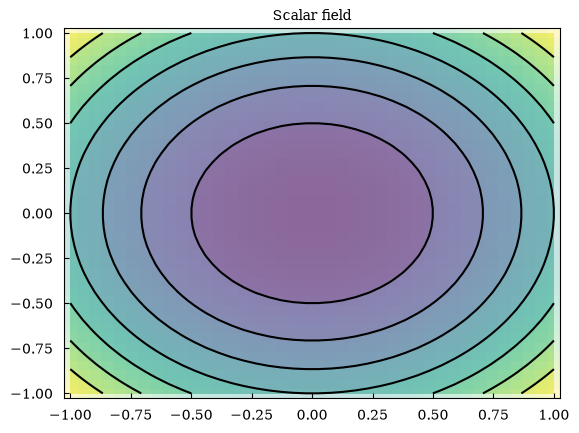
(<Figure size 640x480 with 1 Axes>, array([[<Axes: title={'center': 'Scalar field'}>]], dtype=object))For point-density data and matrix-oriented displays:
canvas = Canvas()canvas.hexbin(xx.ravel(), yy.ravel(), gridsize=12)canvas.matshow(z)canvas.show()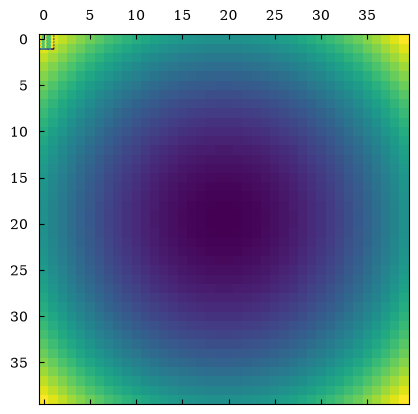
(<Figure size 640x480 with 1 Axes>, array([[<Axes: >]], dtype=object))Unstructured triangular data and vector fields are also supported:
points_x = np.array([0.0, 1.0, 0.0, 1.0])points_y = np.array([0.0, 0.0, 1.0, 1.0])triangles = [[0, 1, 2], [1, 3, 2]]values = points_x + points_y
canvas = Canvas()canvas.quiver(points_x, points_y, np.ones(4), np.ones(4))canvas.triplot(points_x, points_y, triangles=triangles)canvas.tripcolor(points_x, points_y, values, triangles=triangles, alpha=0.3)canvas.tricontour(points_x, points_y, values, triangles=triangles)canvas.show()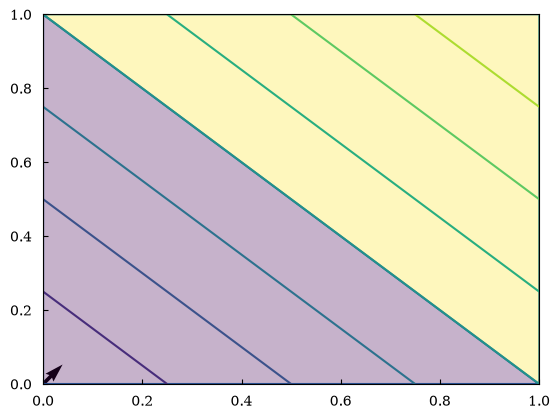
(<Figure size 640x480 with 1 Axes>, array([[<Axes: >]], dtype=object))Statistical and event plots
Section titled “Statistical and event plots”canvas = Canvas()canvas.stem([0, 1, 2], [1, 3, 2])canvas.stackplot([0, 1, 2], [1, 2, 1], [2, 1, 2], alpha=0.4)canvas.set_title("Discrete and stacked data")canvas.show()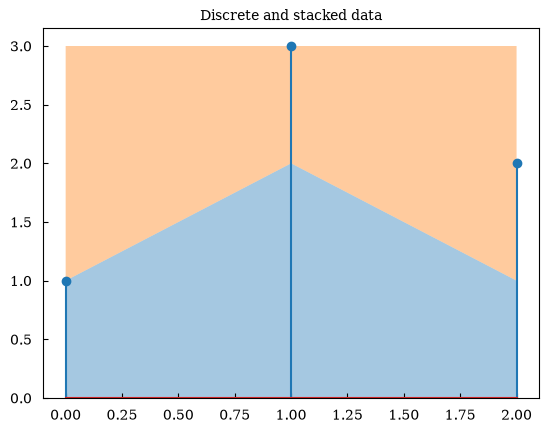
(<Figure size 640x480 with 1 Axes>, array([[<Axes: title={'center': 'Discrete and stacked data'}>]], dtype=object))canvas = Canvas()canvas.boxplot([[1, 2, 3], [2, 4, 5]])canvas.violinplot([[1, 2, 3], [2, 4, 5]])canvas.eventplot([[0.2, 0.5], [1.0, 1.5]])canvas.show()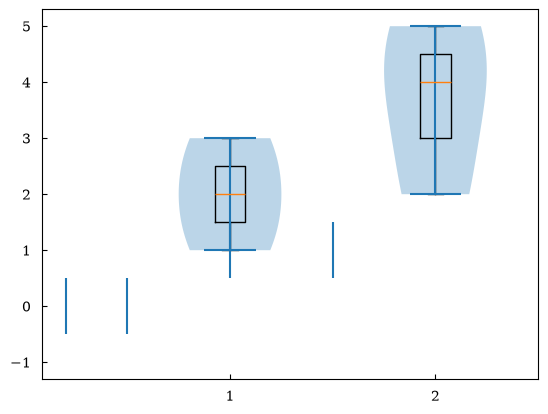
(<Figure size 640x480 with 1 Axes>, array([[<Axes: >]], dtype=object))