TikZ backend
TikZ is the de-facto standard for drawing in LaTeX documents.
maxplotlib can render your figures as native TikZ code via the tikzfigure backend,
which wraps the tikzfigure Python package.
This tutorial covers two complementary workflows:
| Workflow | When to use |
|---|---|
| Canvas → TikZ | Quick way to turn data plots into LaTeX-ready TikZ code |
tikzfigure API directly | Full control — nodes, shapes, annotations, arcs, colours … |
Prerequisites
pip install tikzfigureTo actually render the figure (not just generate code) you also need pdflatex installed on your system.
import numpy as npimport tikzfigure as tz
from maxplotlib import Canvas
Part 1 — Canvas → TikZ
Section titled “Part 1 — Canvas → TikZ”The fastest path: build a plot with the standard Canvas API, then pass backend="tikzfigure" to get a TikzFigure object back.
The canvas is drawn with Matplotlib first, off screen, and the drawn figure is converted: every subplot becomes a pgfplots axis at the place and size it has in the Matplotlib figure, with its limits, scales, labels, ticks, legend and colorbar. Lines, markers, bars, fills and text become pgfplots code; meshes and images become images placed with \addplot graphics. So every layout and every plot type converts, and the TikZ figure shows what Matplotlib shows.
1.1 Basic usage
Section titled “1.1 Basic usage”x = np.linspace(0, 2 * np.pi, 60)
canvas = Canvas(width="10cm", ratio=0.6)canvas.plot(x, np.sin(x), label="sin", color="steelblue", linewidth=1.5)canvas.plot(x, np.cos(x), label="cos", color="tomato", linewidth=1.2)canvas.set_xlabel("$x$")canvas.set_ylabel("$y$")canvas.set_title("Trigonometric functions")canvas.set_legend(True)
# backend="tikzfigure" returns a TikzFigure objecttikz = canvas.render(backend="tikzfigure")print(type(tikz))<class 'tikzfigure.core.figure.TikzFigure'>Plotly preview
Section titled “Plotly preview”Before exporting to TikZ, you can preview the same Canvas interactively in a notebook using the Plotly backend:
canvas.show(backend="plotly")canvas.show(backend="tikzfigure")2026-10-30 07:57:28.999774380 [W:onnxruntime:Default, device_discovery.cc:95 GetPciBusId] Skipping pci_bus_id for PCI path at "/sys/devices/LNXSYSTM:00/LNXSYBUS:00/ACPI0004:00/MSFT1000:00/5620e0c7-8062-4dce-aeb7-520c7ef76171" because filename "5620e0c7-8062-4dce-aeb7-520c7ef76171" did not match expected pattern of [0-9a-f]+:[0-9a-f]+:[0-9a-f]+[.][0-9a-f]+/home/runner/work/maxplotlib/maxplotlib/.venv/lib/python3.12/site-packages/fitz/__init__.py:17: FutureWarning: The `fitz` API is deprecated and will be removed in future. Use `import pymupdf` instead. warnings.warn(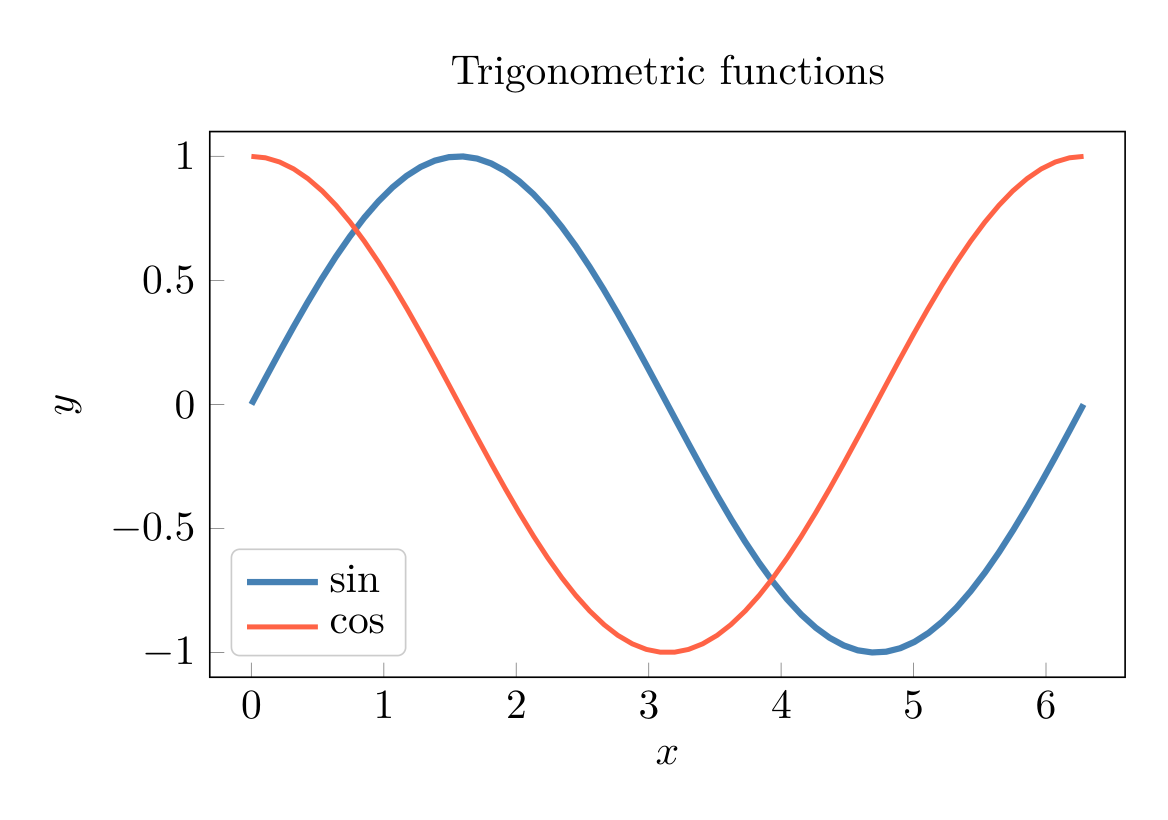
1.2 Inspecting the generated LaTeX
Section titled “1.2 Inspecting the generated LaTeX”str(tikz) returns the raw LaTeX source string (and generate_tikz() remains available explicitly).
The colors are defined once with \definecolor; the subplot is an axis placed with at= and sized with width=/height= (scale only axis), each line an \addplot. The legend repeats Matplotlib’s legend, entry by entry (\addlegendimage, \addlegendentry).
print(tikz)% --------------------------------------------- %% Tikzfigure generated by tikzfigure v0.5.0 %% https://github.com/max-models/tikzfigure %% --------------------------------------------- %\begin{tikzpicture} \definecolor{mpl000000}{HTML}{000000} \definecolor{mplFFFFFF}{HTML}{FFFFFF} \definecolor{mplCCCCCC}{HTML}{CCCCCC} \definecolor{mpl4682B4}{HTML}{4682B4} \definecolor{mplFF6347}{HTML}{FF6347} \begin{axis}[scale only axis, anchor=south west, at={(0.4921in,0.2598in)}, clip mode=individual, unbounded coords=jump, every axis plot/.append style={line join=round}, xtick={0,1,2,3,4,5,6}, xtick pos=left, xticklabel pos=left, x tick label style={font={\fontsize{10}{12}\selectfont}}, tick align=inside, major tick length=3.5pt, ytick={-1,-0.5,0,0.5,1}, ytick pos=left, yticklabel pos=left, y tick label style={font={\fontsize{10}{12}\selectfont}}, xlabel style={font={\fontsize{10}{12}\selectfont}}, ylabel style={font={\fontsize{10}{12}\selectfont}}, title style={font={\fontsize{10}{12}\selectfont}}, title=Trigonometric functions, xlabel=$x$, ylabel=$y$, xmin=-0.3141592653589793, xmax=6.5973445725385655, ymin=-1.0996278916796252, ymax=1.0999822805561725, width=3.0512in, height=1.8189in, legend style={at={(0.0227599,0.0381794)}, anchor=south west, fill=mplFFFFFF, fill opacity=0.8, text opacity=1, draw=mplCCCCCC, rounded corners=2pt, font={\fontsize{10}{12}\selectfont}, cells={anchor=west}}, legend columns=1] \addplot[draw=mpl4682B4, line width=1.5pt, solid, mark=none, forget plot] coordinates {(0,0) (0.106495,0.106293) (0.212989,0.211383) (0.319484,0.314077) (0.425979,0.413212) (0.532473,0.507666) (0.638968,0.596367) (0.745463,0.678312) (0.851957,0.752571) (0.958452,0.818303) (1.06495,0.874763) (1.17144,0.921312) (1.27794,0.957422) (1.38443,0.982684) (1.49093,0.996812) (1.59742,0.999646) (1.70391,0.991153) (1.81041,0.97143) (1.9169,0.9407) (2.0234,0.899312) (2.12989,0.847734) (2.23639,0.786552) (2.34288,0.716457) (2.44938,0.638244) (2.55587,0.5528) (2.66237,0.461093) (2.76886,0.364161) (2.87536,0.263103) (2.98185,0.159063) (3.08835,0.0532222) (3.19484,-0.0532222) (3.30133,-0.159063) (3.40783,-0.263103) (3.51432,-0.364161) (3.62082,-0.461093) (3.72731,-0.5528) (3.83381,-0.638244) (3.9403,-0.716457) (4.0468,-0.786552) (4.15329,-0.847734) (4.25979,-0.899312) (4.36628,-0.9407) (4.47278,-0.97143) (4.57927,-0.991153) (4.68577,-0.999646) (4.79226,-0.996812) (4.89875,-0.982684) (5.00525,-0.957422) (5.11174,-0.921312) (5.21824,-0.874763) (5.32473,-0.818303) (5.43123,-0.752571) (5.53772,-0.678312) (5.64422,-0.596367) (5.75071,-0.507666) (5.85721,-0.413212) (5.9637,-0.314077) (6.0702,-0.211383) (6.17669,-0.106293) (6.28319,0)}; \addplot[draw=mplFF6347, line width=1.2pt, solid, mark=none, forget plot] coordinates {(0,1) (0.106495,0.994335) (0.212989,0.977403) (0.319484,0.949398) (0.425979,0.910635) (0.532473,0.861554) (0.638968,0.802712) (0.745463,0.734774) (0.851957,0.658511) (0.958452,0.574787) (1.06495,0.484551) (1.17144,0.388824) (1.27794,0.288692) (1.38443,0.185289) (1.49093,0.0797861) (1.59742,-0.0266205) (1.70391,-0.132726) (1.81041,-0.237327) (1.9169,-0.339239) (2.0234,-0.437307) (2.12989,-0.530421) (2.23639,-0.617525) (2.34288,-0.697632) (2.44938,-0.769834) (2.55587,-0.833314) (2.66237,-0.887352) (2.76886,-0.931336) (2.87536,-0.964768) (2.98185,-0.987268) (3.08835,-0.998583) (3.19484,-0.998583) (3.30133,-0.987268) (3.40783,-0.964768) (3.51432,-0.931336) (3.62082,-0.887352) (3.72731,-0.833314) (3.83381,-0.769834) (3.9403,-0.697632) (4.0468,-0.617525) (4.15329,-0.530421) (4.25979,-0.437307) (4.36628,-0.339239) (4.47278,-0.237327) (4.57927,-0.132726) (4.68577,-0.0266205) (4.79226,0.0797861) (4.89875,0.185289) (5.00525,0.288692) (5.11174,0.388824) (5.21824,0.484551) (5.32473,0.574787) (5.43123,0.658511) (5.53772,0.734774) (5.64422,0.802712) (5.75071,0.861554) (5.85721,0.910635) (5.9637,0.949398) (6.0702,0.977403) (6.17669,0.994335) (6.28319,1)}; \addlegendimage{draw=mpl4682B4, line width=1.5pt, solid, mark=none} \addlegendentry{sin} \addlegendimage{draw=mplFF6347, line width=1.2pt, solid, mark=none} \addlegendentry{cos} \end{axis}\end{tikzpicture}1.3 Size and layout
Section titled “1.3 Size and layout”The TikZ figure has the canvas’s size (width= and ratio=, or figsize=), and every axis the box Matplotlib gives it, so a grid of subplots, shared axes and twin axes keep their layout. Text is typeset by LaTeX at Matplotlib’s font sizes.
canvas_grid, axes = Canvas.subplots(    nrows=2, ncols=2, width="12cm", ratio=0.7, hspace=0.5)for index, ax in enumerate(np.ravel(axes)):    ax.plot(x, np.sin((index + 1) * x), linewidth=1.2)    ax.set_title(f"$n = {index + 1}$")
tikz_grid = canvas_grid.render(backend="tikzfigure")for line in tikz_grid.generate_tikz().splitlines():    if "\\begin{axis}" in line:        print(line.strip()[:120], "...")
\begin{axis}[scale only axis, anchor=south west, at={(0.5906in,1.8917in)}, clip mode=individual, unbounded coords=jump, ...\begin{axis}[scale only axis, anchor=south west, at={(2.4917in,1.8917in)}, clip mode=individual, unbounded coords=jump, ...\begin{axis}[scale only axis, anchor=south west, at={(0.5906in,0.3638in)}, clip mode=individual, unbounded coords=jump, ...\begin{axis}[scale only axis, anchor=south west, at={(2.4917in,0.3638in)}, clip mode=individual, unbounded coords=jump, ...1.4 Meshes, images and colorbars
Section titled “1.4 Meshes, images and colorbars”Large colormap data would be slow and memory hungry as pgfplots coordinates, so meshes and images are drawn by Matplotlib and placed in the axis as images (\addplot graphics). A colorbar is an axis of its own: an image of its colors, with pgfplots ticks and label. files() lists the images the figure refers to.
xx, yy = np.meshgrid(np.linspace(-2, 2, 120), np.linspace(-1, 1, 60))field = np.exp(-(xx**2) - 4 * yy**2) * np.cos(4 * xx)
canvas_mesh, ax_mesh = Canvas.subplots(width="10cm", ratio=0.5)ax_mesh.pcolormesh(xx, yy, field, cmap="RdBu_r", vmin=-1, vmax=1)ax_mesh.add_colorbar(label=r"$\phi$ [V]")  # of the mesh drawn lastax_mesh.contour(xx, yy, field, levels=[-0.5, 0.5], colors="k")ax_mesh.set_xlabel("$x$")ax_mesh.set_ylabel("$y$")
tikz_mesh = canvas_mesh.render(backend="tikzfigure")print(list(tikz_mesh.files()))tikz_mesh.show(transparent=False)
['tikzfigure-9451586199e2.png', 'tikzfigure-3c0d9c015b6c.png']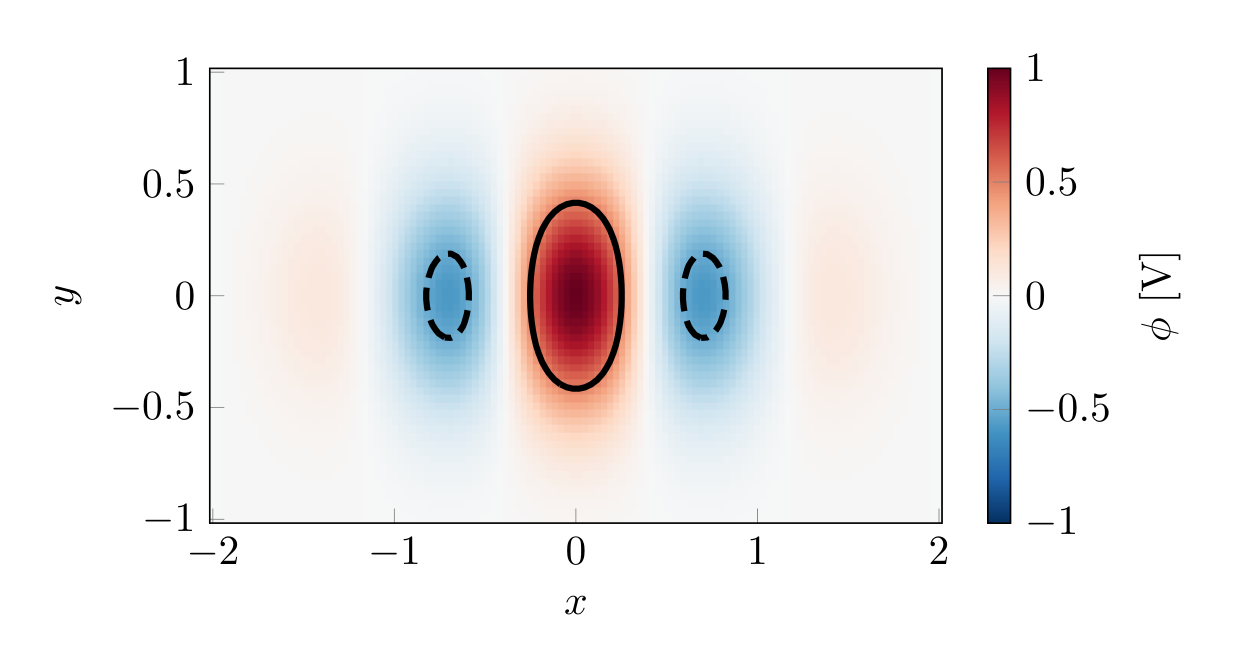
1.5 Layer-aware TikZ output
Section titled “1.5 Layer-aware TikZ output”Assign data to layers with layer=N.
The TikZ backend respects the layer filter — useful for generating incremental reveal figures (e.g. in Beamer).
canvas3, ax3 = Canvas.subplots(width="10cm", ratio=0.55)ax3.plot(x, np.sin(x), color="steelblue", linewidth=1.5, layer=0, label="sin")ax3.plot(x, np.cos(x), color="tomato", linewidth=1.5, layer=1, label="cos")ax3.plot(    x, np.sin(x) * np.cos(x), color="seagreen", linewidth=1.0, layer=2, label="sin·cos")
# All layers available on the canvasprint("Available layers:", canvas3.layers)
# Render only layer 0 — one \addplottikz_l0 = canvas3.render(backend="tikzfigure", layers=[0])print("\n--- Layer 0 only ---")print(f"\\addplot count: {tikz_l0.generate_tikz().count(chr(92) + 'addplot')}")
# Layers 0 and 1tikz_l01 = canvas3.render(backend="tikzfigure", layers=[0, 1])print(f"\\addplot count: {tikz_l01.generate_tikz().count(chr(92) + 'addplot')}")
Available layers: [0, 1, 2]
--- Layer 0 only ---\addplot count: 1\addplot count: 21.6 Saving TikZ code to a file
Section titled “1.6 Saving TikZ code to a file”savefig("figure.tikz") writes the tikzpicture, savefig("figure.tex") a standalone document; both write the images the figure refers to next to the file. savefig("figure.pdf") compiles it (requires pdflatex). In your document, load pgfplots and \input the .tikz file:
\usepackage{pgfplots}\pgfplotsset{compat=newest}...\begin{figure} \centering \input{figure.tikz} \caption{My caption}\end{figure}tikz_mesh.savefig("figure.tikz")print("Saved figure.tikz and", ", ".join(tikz_mesh.files()))Saved figure.tikz and tikzfigure-9451586199e2.png, tikzfigure-3c0d9c015b6c.png1.7 Rendering the figure (requires pdflatex)
Section titled “1.7 Rendering the figure (requires pdflatex)”If pdflatex is installed, tikz.show() compiles the code and displays it:
# Requires pdflatex:tikz_grid.show(transparent=False)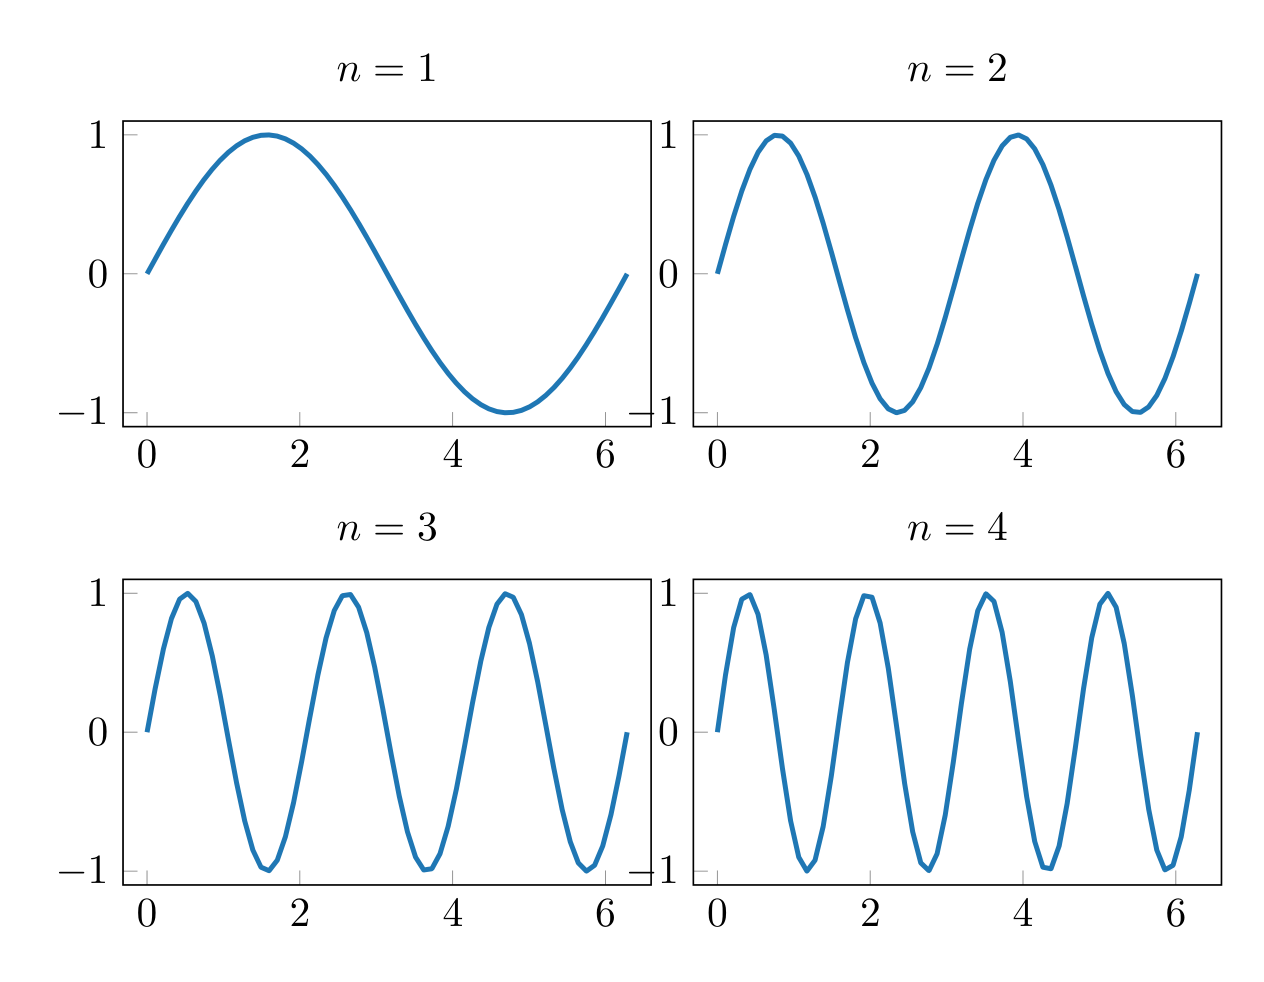
1.8 Any Matplotlib figure
Section titled “1.8 Any Matplotlib figure”The conversion works for every Matplotlib figure, not only canvases: figure_to_tikz(fig) converts a figure you drew with Matplotlib directly (it is what render(backend="tikzfigure") uses), and Canvas.from_matplotlib(fig) imports one into a canvas to edit first.
import matplotlib.pyplot as plt
from maxplotlib.backends.tikzfigure import figure_to_tikz
fig, (left, right) = plt.subplots(1, 2, figsize=(8, 3), layout="constrained")t = np.linspace(0, 10, 400)left.semilogy(t, np.exp(0.4 * t), label="energy")left.semilogy(t, 0.5 * np.exp(0.4 * t), "k--", label=r"fit, $\gamma = 0.2$")left.axvspan(2, 6, color="gray", alpha=0.2)left.set_xlabel("$t$")left.legend()right.scatter(    *np.random.default_rng(1).normal(size=(2, 200)), s=8, c=t[:200], cmap="viridis")right.set_aspect("equal")
tikz_mpl = figure_to_tikz(fig)plt.close(fig)tikz_mpl.show(transparent=False)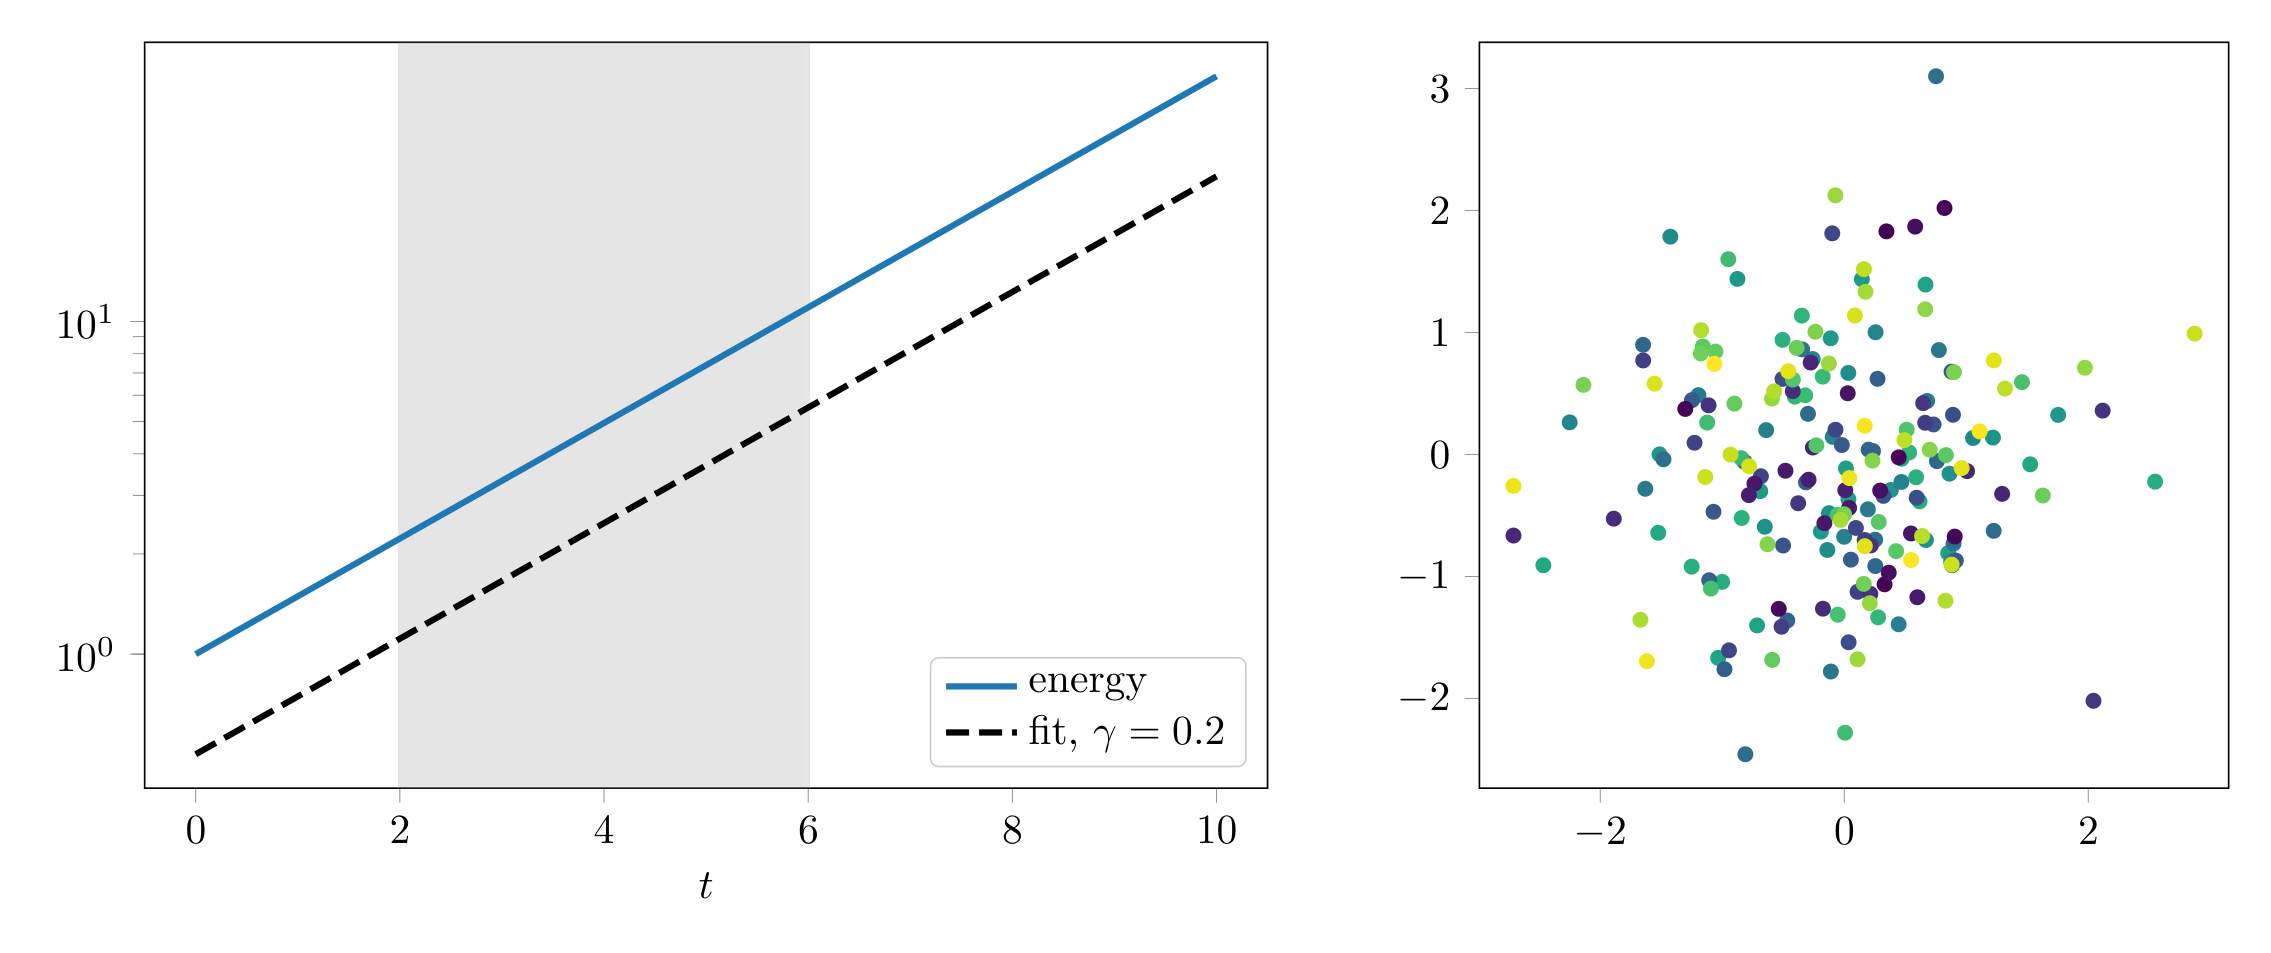
1.9 What becomes what
Section titled “1.9 What becomes what”| Matplotlib | TikZ |
|---|---|
| Lines, markers, error bars, steps, stems | \addplot with the same color, width, dashes and marks |
| Scatter plots | \addplot[only marks], one per color and size |
| Bars, fills, spans, polygons, patches | closed \addplot ... -- cycle |
| Contour lines | \addplot per level |
| Text, annotations, titles, labels | LaTeX text (mathtext $...$ as math, the rest escaped) |
| Log axes, reversed axes, hidden spines, ticks | pgfplots axis options |
| Legends | \addlegendimage + \addlegendentry, in Matplotlib’s order |
| Meshes, images, filled contours, quivers | images (\addplot graphics) |
| Colorbars | an axis with the colors as an image |
| Polar or 3-D axes, symlog scales, figure legends | an image, with a TikzConversionWarning |
Scatter plots with more than max_markers points, collections of more than max_items styles and lines of more than max_points points (TeX memory is limited) are images too; canvas.plot_tikzfigure(raster_dpi=600, max_markers=5000) changes the limits and the image resolution.
Part 2 — The tikzfigure API
Section titled “Part 2 — The tikzfigure API”The tikzfigure package gives you a full Python interface to TikZ primitives.
You build figures by adding nodes, paths, shapes, and annotations, then
call generate_tikz() (or show()) to obtain the output.
import tikzfigure as tztf = tz.TikzFigure()2.1 Drawing paths with draw()
Section titled “2.1 Drawing paths with draw()”tf.draw(nodes, ...) produces a \draw path through a list of (x, y) coordinates.
tf = tz.TikzFigure()
x = np.linspace(0, 2 * np.pi, 60)sin_nodes = [(float(xi), float(np.sin(xi))) for xi in x]cos_nodes = [(float(xi), float(np.cos(xi))) for xi in x]
tf.draw(sin_nodes, color="steelblue", line_width=1.5)tf.draw(cos_nodes, color="tomato", line_width=1.2)
print(tf.generate_tikz())
% --------------------------------------------- %% Tikzfigure generated by tikzfigure v0.5.0 %% https://github.com/max-models/tikzfigure %% --------------------------------------------- %\begin{tikzpicture} \draw[color=steelblue, line width=1.5] (0.0, 0.0) to (0.10649466622338281, 0.1062934856473654) to (0.21298933244676563, 0.21138262362962432) to (0.31948399867014843, 0.31407671202194876) to (0.42597866489353126, 0.41321218576837815) to (0.5324733311169141, 0.5076658003388399) to (0.6389679973402969, 0.5963673585385013) to (0.7454626635636797, 0.6783118362696161) to (0.8519573297870625, 0.7525707698561385) to (0.9584519960104453, 0.818302775908169) to (1.0649466622338282, 0.8747630845319613) to (1.171441328457211, 0.921311977870413) to (1.2779359946805937, 0.9574220383620055) to (1.3844306609039765, 0.9826841245925209) to (1.4909253271273595, 0.9968120070307501) to (1.5974199933507423, 0.9996456111234526) to (1.703914659574125, 0.9911528310040072) to (1.8104093257975078, 0.97142989326471) to (1.9169039920208906, 0.9407002666710333) to (2.0233986582442736, 0.8993121301712192) to (2.1298933244676563, 0.847734427889671) to (2.236387990691039, 0.7865515558026426) to (2.342882656914422, 0.7164567402983153) to (2.4493773231378047, 0.6382441836448203) to (2.5558719893611874, 0.5528000653611936) to (2.66236665558457, 0.4610925014493262) to (2.768861321807953, 0.3641605752528225) to (2.875355988031336, 0.26310256422752126) to (2.981850654254719, 0.1590634960190721) to (3.0883453204781017, 0.053222174842178754) to (3.1948399867014845, -0.053222174842178505) to (3.3013346529248673, -0.15906349601907185) to (3.40782931914825, -0.26310256422752104) to (3.514323985371633, -0.3641605752528219) to (3.6208186515950156, -0.46109250144932556) to (3.7273133178183984, -0.5528000653611931) to (3.833807984041781, -0.6382441836448197) to (3.940302650265164, -0.7164567402983147) to (4.046797316488547, -0.7865515558026425) to (4.15329198271193, -0.8477344278896709) to (4.259786648935313, -0.8993121301712191) to (4.366281315158695, -0.9407002666710332) to (4.472775981382078, -0.9714298932647099) to (4.579270647605461, -0.9911528310040071) to (4.685765313828844, -0.9996456111234525) to (4.7922599800522265, -0.9968120070307502) to (4.898754646275609, -0.9826841245925211) to (5.005249312498992, -0.9574220383620057)... (44 lines skipped) ... (1.0649466622338282, 0.4845508703326502) to (1.171441328457211, 0.38882417547332077) to (1.2779359946805937, 0.28869194733962117) to (1.3844306609039765, 0.18528872408711453) to (1.4909253271273595, 0.0797861055530831) to (1.5974199933507423, -0.026620521437774693) to (1.703914659574125, -0.13272552728372186) to (1.8104093257975078, -0.23732669987111465) to (1.9169039920208906, -0.33923886611803006) to (2.0233986582442736, -0.43730732045885534) to (2.1298933244676563, -0.5304209081197424) to (2.236387990691039, -0.6175246149461918) to (2.342882656914422, -0.6976315211349846) to (2.4493773231378047, -0.769833983429906) to (2.5558719893611874, -0.8333139190825148) to (2.66236665558457, -0.8873520750565714) to (2.768861321807953, -0.9313361774523383) to (2.875355988031336, -0.9647678688145159) to (2.981850654254719, -0.9872683547213446) to (3.0883453204781017, -0.9985826956767619) to (3.1948399867014845, -0.9985826956767619) to (3.3013346529248673, -0.9872683547213446) to (3.40782931914825, -0.964767868814516) to (3.514323985371633, -0.9313361774523385) to (3.6208186515950156, -0.8873520750565718) to (3.7273133178183984, -0.8333139190825152) to (3.833807984041781, -0.7698339834299065) to (3.940302650265164, -0.697631521134985) to (4.046797316488547, -0.617524614946192) to (4.15329198271193, -0.5304209081197426) to (4.259786648935313, -0.43730732045885556) to (4.366281315158695, -0.3392388661180305) to (4.472775981382078, -0.2373266998711151) to (4.579270647605461, -0.1327255272837223) to (4.685765313828844, -0.02662052143777516) to (4.7922599800522265, 0.07978610555308265) to (4.898754646275609, 0.18528872408711383) to (5.005249312498992, 0.2886919473396205) to (5.111743978722375, 0.3888241754733201) to (5.218238644945758, 0.4845508703326496) to (5.32473331116914, 0.5747874102144063) to (5.431227977392523, 0.6585113790650381) to (5.537722643615906, 0.7347741508630667) to (5.644217309839289, 0.8027116379309631) to (5.750711976062672, 0.8615540813938061) to (5.857206642286055, 0.9106347728549131) to (5.963701308509438, 0.9493976084683813) to (6.070195974732821, 0.9774033898178666) to (6.1766906409562035, 0.9943348002101371) to (6.283185307179586, 1.0);\end{tikzpicture}2.2 Straight line segments with line()
Section titled “2.2 Straight line segments with line()”tf.line(start, end, ...) is a convenience wrapper for a two-point path.
The arrows parameter adds arrowheads.
tf2 = tz.TikzFigure()
# Baselinetf2.line((0, 0), (2 * np.pi, 0), color="gray", dash_pattern="on 3pt off 3pt")
# Arrow showing directiontf2.line((0, -1.2), (0, 1.2), color="black", arrows="->", line_width=0.8)tf2.line((-0.2, 0), (2 * np.pi + 0.2, 0), color="black", arrows="->", line_width=0.8)
# The curvetf2.draw(sin_nodes, color="steelblue", line_width=1.5)
print(tf2.generate_tikz())
% --------------------------------------------- %% Tikzfigure generated by tikzfigure v0.5.0 %% https://github.com/max-models/tikzfigure %% --------------------------------------------- %\begin{tikzpicture} \draw[color=gray, dash pattern=on 3pt off 3pt] ({0}, {0}) -- ({6.283185307179586}, {0}); \draw[->, color=black, line width=0.8] ({0}, {-1.2}) -- ({0}, {1.2}); \draw[->, color=black, line width=0.8] ({-0.2}, {0}) -- ({6.483185307179586}, {0}); \draw[color=steelblue, line width=1.5] (0.0, 0.0) to (0.10649466622338281, 0.1062934856473654) to (0.21298933244676563, 0.21138262362962432) to (0.31948399867014843, 0.31407671202194876) to (0.42597866489353126, 0.41321218576837815) to (0.5324733311169141, 0.5076658003388399) to (0.6389679973402969, 0.5963673585385013) to (0.7454626635636797, 0.6783118362696161) to (0.8519573297870625, 0.7525707698561385) to (0.9584519960104453, 0.818302775908169) to (1.0649466622338282, 0.8747630845319613) to (1.171441328457211, 0.921311977870413) to (1.2779359946805937, 0.9574220383620055) to (1.3844306609039765, 0.9826841245925209) to (1.4909253271273595, 0.9968120070307501) to (1.5974199933507423, 0.9996456111234526) to (1.703914659574125, 0.9911528310040072) to (1.8104093257975078, 0.97142989326471) to (1.9169039920208906, 0.9407002666710333) to (2.0233986582442736, 0.8993121301712192) to (2.1298933244676563, 0.847734427889671) to (2.236387990691039, 0.7865515558026426) to (2.342882656914422, 0.7164567402983153) to (2.4493773231378047, 0.6382441836448203) to (2.5558719893611874, 0.5528000653611936) to (2.66236665558457, 0.4610925014493262) to (2.768861321807953, 0.3641605752528225) to (2.875355988031336, 0.26310256422752126) to (2.981850654254719, 0.1590634960190721) to (3.0883453204781017, 0.053222174842178754) to (3.1948399867014845, -0.053222174842178505) to (3.3013346529248673, -0.15906349601907185) to (3.40782931914825, -0.26310256422752104) to (3.514323985371633, -0.3641605752528219) to (3.6208186515950156, -0.46109250144932556) to (3.7273133178183984, -0.5528000653611931) to (3.833807984041781, -0.6382441836448197) to (3.940302650265164, -0.7164567402983147) to (4.046797316488547, -0.7865515558026425) to (4.15329198271193, -0.8477344278896709) to (4.259786648935313, -0.8993121301712191) to (4.366281315158695, -0.9407002666710332) to (4.472775981382078, -0.9714298932647099) to (4.579270647605461, -0.9911528310040071) to (4.685765313828844, -0.9996456111234525) to (4.7922599800522265, -0.9968120070307502) to (4.898754646275609, -0.9826841245925211) to (5.005249312498992, -0.9574220383620057) to (5.111743978722375, -0.9213119778704132) to (5.218238644945758, -0.8747630845319616) to (5.32473331116914, -0.8183027759081695) to (5.431227977392523, -0.752570769856139) to (5.537722643615906, -0.6783118362696167) to (5.644217309839289, -0.5963673585385021) to (5.750711976062672, -0.50766580033884) to (5.857206642286055, -0.4132121857683782) to (5.963701308509438, -0.3140767120219489) to (6.070195974732821, -0.21138262362962446) to (6.1766906409562035, -0.1062934856473656) to (6.283185307179586, -2.4492935982947064e-16);\end{tikzpicture}2.3 Rectangles, circles, and arcs
Section titled “2.3 Rectangles, circles, and arcs”tf3 = tz.TikzFigure()
# Bounding rectangle (coordinate space for context)tf3.rectangle((0, -1.2), (2 * np.pi, 1.2), draw="gray!40", fill="gray!5")
# Circle at the origintf3.circle((0, 0), radius=0.15, fill="red!60", draw="red")
# Circle at peak of sinetf3.circle((np.pi / 2, 1.0), radius=0.12, fill="steelblue", draw="none")
# Arc (quarter circle)tf3.arc( (0.4, 0), start_angle=0, end_angle=90, radius=0.4, draw="green!60!black", line_width=1.0,)
# The curve on toptf3.draw(sin_nodes, color="steelblue", line_width=1.5)
print(tf3.generate_tikz())% --------------------------------------------- %% Tikzfigure generated by tikzfigure v0.5.0 %% https://github.com/max-models/tikzfigure %% --------------------------------------------- %\begin{tikzpicture} \draw[fill=gray!5, draw=gray!40] ({0}, {-1.2}) rectangle ({6.283185307179586}, {1.2}); \draw[fill=red!60, draw=red] ({0}, {0}) circle (0.15); \draw[fill=steelblue, draw=none] ({1.5707963267948966}, {1.0}) circle (0.12); \draw[draw=green!60!black, line width=1.0, start angle=0, end angle=90, radius=0.4] ({0.4}, {0}) arc; \draw[color=steelblue, line width=1.5] (0.0, 0.0) to (0.10649466622338281, 0.1062934856473654) to (0.21298933244676563, 0.21138262362962432) to (0.31948399867014843, 0.31407671202194876) to (0.42597866489353126, 0.41321218576837815) to (0.5324733311169141, 0.5076658003388399) to (0.6389679973402969, 0.5963673585385013) to (0.7454626635636797, 0.6783118362696161) to (0.8519573297870625, 0.7525707698561385) to (0.9584519960104453, 0.818302775908169) to (1.0649466622338282, 0.8747630845319613) to (1.171441328457211, 0.921311977870413) to (1.2779359946805937, 0.9574220383620055) to (1.3844306609039765, 0.9826841245925209) to (1.4909253271273595, 0.9968120070307501) to (1.5974199933507423, 0.9996456111234526) to (1.703914659574125, 0.9911528310040072) to (1.8104093257975078, 0.97142989326471) to (1.9169039920208906, 0.9407002666710333) to (2.0233986582442736, 0.8993121301712192) to (2.1298933244676563, 0.847734427889671) to (2.236387990691039, 0.7865515558026426) to (2.342882656914422, 0.7164567402983153) to (2.4493773231378047, 0.6382441836448203) to (2.5558719893611874, 0.5528000653611936) to (2.66236665558457, 0.4610925014493262) to (2.768861321807953, 0.3641605752528225) to (2.875355988031336, 0.26310256422752126) to (2.981850654254719, 0.1590634960190721) to (3.0883453204781017, 0.053222174842178754) to (3.1948399867014845, -0.053222174842178505) to (3.3013346529248673, -0.15906349601907185) to (3.40782931914825, -0.26310256422752104) to (3.514323985371633, -0.3641605752528219) to (3.6208186515950156, -0.46109250144932556) to (3.7273133178183984, -0.5528000653611931) to (3.833807984041781, -0.6382441836448197) to (3.940302650265164, -0.7164567402983147) to (4.046797316488547, -0.7865515558026425) to (4.15329198271193, -0.8477344278896709) to (4.259786648935313, -0.8993121301712191) to (4.366281315158695, -0.9407002666710332) to (4.472775981382078, -0.9714298932647099) to (4.579270647605461, -0.9911528310040071) to (4.685765313828844, -0.9996456111234525) to (4.7922599800522265, -0.9968120070307502) to (4.898754646275609, -0.9826841245925211) to (5.005249312498992, -0.9574220383620057) to (5.111743978722375, -0.9213119778704132) to (5.218238644945758, -0.8747630845319616) to (5.32473331116914, -0.8183027759081695) to (5.431227977392523, -0.752570769856139) to (5.537722643615906, -0.6783118362696167) to (5.644217309839289, -0.5963673585385021) to (5.750711976062672, -0.50766580033884) to (5.857206642286055, -0.4132121857683782) to (5.963701308509438, -0.3140767120219489) to (6.070195974732821, -0.21138262362962446) to (6.1766906409562035, -0.1062934856473656) to (6.283185307179586, -2.4492935982947064e-16);\end{tikzpicture}2.4 Nodes — text labels and markers
Section titled “2.4 Nodes — text labels and markers”add_node() places a text label (optionally inside a shape) at an (x, y) position.
tf4 = tz.TikzFigure()tf4.draw(sin_nodes, color="steelblue", line_width=1.5)
# Plain text labeltf4.add_node(np.pi / 2, 1.15, content=r"$\max$", color="steelblue")
# Boxed labeltf4.add_node(    3 * np.pi / 2,    -1.15,    content=r"$\min$",    shape="rectangle",    fill="tomato!20",    draw="tomato",    inner_sep="2pt",)
# Circle marker at zero-crossingtf4.add_node(    np.pi, 0, shape="circle", fill="white", draw="steelblue", minimum_size="0.18cm")
print(tf4.generate_tikz())
% --------------------------------------------- %% Tikzfigure generated by tikzfigure v0.5.0 %% https://github.com/max-models/tikzfigure %% --------------------------------------------- %\begin{tikzpicture} \draw[color=steelblue, line width=1.5] (0.0, 0.0) to (0.10649466622338281, 0.1062934856473654) to (0.21298933244676563, 0.21138262362962432) to (0.31948399867014843, 0.31407671202194876) to (0.42597866489353126, 0.41321218576837815) to (0.5324733311169141, 0.5076658003388399) to (0.6389679973402969, 0.5963673585385013) to (0.7454626635636797, 0.6783118362696161) to (0.8519573297870625, 0.7525707698561385) to (0.9584519960104453, 0.818302775908169) to (1.0649466622338282, 0.8747630845319613) to (1.171441328457211, 0.921311977870413) to (1.2779359946805937, 0.9574220383620055) to (1.3844306609039765, 0.9826841245925209) to (1.4909253271273595, 0.9968120070307501) to (1.5974199933507423, 0.9996456111234526) to (1.703914659574125, 0.9911528310040072) to (1.8104093257975078, 0.97142989326471) to (1.9169039920208906, 0.9407002666710333) to (2.0233986582442736, 0.8993121301712192) to (2.1298933244676563, 0.847734427889671) to (2.236387990691039, 0.7865515558026426) to (2.342882656914422, 0.7164567402983153) to (2.4493773231378047, 0.6382441836448203) to (2.5558719893611874, 0.5528000653611936) to (2.66236665558457, 0.4610925014493262) to (2.768861321807953, 0.3641605752528225) to (2.875355988031336, 0.26310256422752126) to (2.981850654254719, 0.1590634960190721) to (3.0883453204781017, 0.053222174842178754) to (3.1948399867014845, -0.053222174842178505) to (3.3013346529248673, -0.15906349601907185) to (3.40782931914825, -0.26310256422752104) to (3.514323985371633, -0.3641605752528219) to (3.6208186515950156, -0.46109250144932556) to (3.7273133178183984, -0.5528000653611931) to (3.833807984041781, -0.6382441836448197) to (3.940302650265164, -0.7164567402983147) to (4.046797316488547, -0.7865515558026425) to (4.15329198271193, -0.8477344278896709) to (4.259786648935313, -0.8993121301712191) to (4.366281315158695, -0.9407002666710332) to (4.472775981382078, -0.9714298932647099) to (4.579270647605461, -0.9911528310040071) to (4.685765313828844, -0.9996456111234525) to (4.7922599800522265, -0.9968120070307502) to (4.898754646275609, -0.9826841245925211) to (5.005249312498992, -0.9574220383620057) to (5.111743978722375, -0.9213119778704132) to (5.218238644945758, -0.8747630845319616) to (5.32473331116914, -0.8183027759081695) to (5.431227977392523, -0.752570769856139) to (5.537722643615906, -0.6783118362696167) to (5.644217309839289, -0.5963673585385021) to (5.750711976062672, -0.50766580033884) to (5.857206642286055, -0.4132121857683782) to (5.963701308509438, -0.3140767120219489) to (6.070195974732821, -0.21138262362962446) to (6.1766906409562035, -0.1062934856473656) to (6.283185307179586, -2.4492935982947064e-16); \node[color=steelblue] (node0) at ({1.5707963267948966}, {1.15}) {$\max$}; \node[shape=rectangle, fill=tomato!20, draw=tomato, inner sep=2pt] (node1) at ({4.71238898038469}, {-1.15}) {$\min$}; \node[shape=circle, fill=white, draw=steelblue, minimum size=0.18cm] (node2) at ({3.141592653589793}, {0}) {};\end{tikzpicture}2.5 Custom colours with colorlet()
Section titled “2.5 Custom colours with colorlet()”TikZ colour mixing syntax (blue!70!white) lets you define reusable named colours.
tf5 = tz.TikzFigure()
# Define named colourstf5.colorlet("myblue", "blue!70!white")tf5.colorlet("myred", "red!80!black")tf5.colorlet("myfill", "blue!10!white")
# Use them in draw callstf5.draw(sin_nodes, color="myblue", line_width=1.5)tf5.draw(cos_nodes, color="myred", line_width=1.5)
# Filled polygon using the fill colourclosed_nodes = sin_nodes + [(float(x[-1]), 0.0), (float(x[0]), 0.0)]tf5.draw(closed_nodes, fill="myfill", draw="none", cycle=True)
print(tf5.generate_tikz())
% --------------------------------------------- %% Tikzfigure generated by tikzfigure v0.5.0 %% https://github.com/max-models/tikzfigure %% --------------------------------------------- %\begin{tikzpicture} \colorlet{myblue}{blue!70!white} \colorlet{myred}{red!80!black} \colorlet{myfill}{blue!10!white} \draw[color=myblue, line width=1.5] (0.0, 0.0) to (0.10649466622338281, 0.1062934856473654) to (0.21298933244676563, 0.21138262362962432) to (0.31948399867014843, 0.31407671202194876) to (0.42597866489353126, 0.41321218576837815) to (0.5324733311169141, 0.5076658003388399) to (0.6389679973402969, 0.5963673585385013) to (0.7454626635636797, 0.6783118362696161) to (0.8519573297870625, 0.7525707698561385) to (0.9584519960104453, 0.818302775908169) to (1.0649466622338282, 0.8747630845319613) to (1.171441328457211, 0.921311977870413) to (1.2779359946805937, 0.9574220383620055) to (1.3844306609039765, 0.9826841245925209) to (1.4909253271273595, 0.9968120070307501) to (1.5974199933507423, 0.9996456111234526) to (1.703914659574125, 0.9911528310040072) to (1.8104093257975078, 0.97142989326471) to (1.9169039920208906, 0.9407002666710333) to (2.0233986582442736, 0.8993121301712192) to (2.1298933244676563, 0.847734427889671) to (2.236387990691039, 0.7865515558026426) to (2.342882656914422, 0.7164567402983153) to (2.4493773231378047, 0.6382441836448203) to (2.5558719893611874, 0.5528000653611936) to (2.66236665558457, 0.4610925014493262) to (2.768861321807953, 0.3641605752528225) to (2.875355988031336, 0.26310256422752126) to (2.981850654254719, 0.1590634960190721) to (3.0883453204781017, 0.053222174842178754) to (3.1948399867014845, -0.053222174842178505) to (3.3013346529248673, -0.15906349601907185) to (3.40782931914825, -0.26310256422752104) to (3.514323985371633, -0.3641605752528219) to (3.6208186515950156, -0.46109250144932556) to (3.7273133178183984, -0.5528000653611931) to (3.833807984041781, -0.6382441836448197) to (3.940302650265164, -0.7164567402983147) to (4.046797316488547, -0.7865515558026425) to (4.15329198271193, -0.8477344278896709) to (4.259786648935313, -0.8993121301712191) to (4.366281315158695, -0.9407002666710332) to (4.472775981382078, -0.9714298932647099) to (4.579270647605461, -0.9911528310040071) to (4.685765313828844, -0.9996456111234525) to (4.7922599800522265, -0.9968120070307502) to... (170 lines skipped) ... (1.2779359946805937, 0.9574220383620055) to (1.3844306609039765, 0.9826841245925209) to (1.4909253271273595, 0.9968120070307501) to (1.5974199933507423, 0.9996456111234526) to (1.703914659574125, 0.9911528310040072) to (1.8104093257975078, 0.97142989326471) to (1.9169039920208906, 0.9407002666710333) to (2.0233986582442736, 0.8993121301712192) to (2.1298933244676563, 0.847734427889671) to (2.236387990691039, 0.7865515558026426) to (2.342882656914422, 0.7164567402983153) to (2.4493773231378047, 0.6382441836448203) to (2.5558719893611874, 0.5528000653611936) to (2.66236665558457, 0.4610925014493262) to (2.768861321807953, 0.3641605752528225) to (2.875355988031336, 0.26310256422752126) to (2.981850654254719, 0.1590634960190721) to (3.0883453204781017, 0.053222174842178754) to (3.1948399867014845, -0.053222174842178505) to (3.3013346529248673, -0.15906349601907185) to (3.40782931914825, -0.26310256422752104) to (3.514323985371633, -0.3641605752528219) to (3.6208186515950156, -0.46109250144932556) to (3.7273133178183984, -0.5528000653611931) to (3.833807984041781, -0.6382441836448197) to (3.940302650265164, -0.7164567402983147) to (4.046797316488547, -0.7865515558026425) to (4.15329198271193, -0.8477344278896709) to (4.259786648935313, -0.8993121301712191) to (4.366281315158695, -0.9407002666710332) to (4.472775981382078, -0.9714298932647099) to (4.579270647605461, -0.9911528310040071) to (4.685765313828844, -0.9996456111234525) to (4.7922599800522265, -0.9968120070307502) to (4.898754646275609, -0.9826841245925211) to (5.005249312498992, -0.9574220383620057) to (5.111743978722375, -0.9213119778704132) to (5.218238644945758, -0.8747630845319616) to (5.32473331116914, -0.8183027759081695) to (5.431227977392523, -0.752570769856139) to (5.537722643615906, -0.6783118362696167) to (5.644217309839289, -0.5963673585385021) to (5.750711976062672, -0.50766580033884) to (5.857206642286055, -0.4132121857683782) to (5.963701308509438, -0.3140767120219489) to (6.070195974732821, -0.21138262362962446) to (6.1766906409562035, -0.1062934856473656) to (6.283185307179586, -2.4492935982947064e-16) to (6.283185307179586, 0.0) to (0.0, 0.0) -- cycle;\end{tikzpicture}2.6 Filled paths and patterns
Section titled “2.6 Filled paths and patterns”Pass fill= and/or pattern= to draw() to create shaded regions.
tf6 = tz.TikzFigure()
# Shaded area under sin curve (closed path)area_nodes = sin_nodes + [(float(x[-1]), 0.0), (float(x[0]), 0.0)]tf6.draw(area_nodes, fill="steelblue!20", draw="none", cycle=True)
# Hatched region using a patterncos_area = cos_nodes + [(float(x[-1]), 0.0), (float(x[0]), 0.0)]tf6.draw(    cos_area,    pattern="north east lines",    pattern_color="tomato",    draw="none",    cycle=True,)
# Curves on toptf6.draw(sin_nodes, color="steelblue", line_width=1.5)tf6.draw(cos_nodes, color="tomato", line_width=1.2)
print(tf6.generate_tikz())
% --------------------------------------------- %% Tikzfigure generated by tikzfigure v0.5.0 %% https://github.com/max-models/tikzfigure %% --------------------------------------------- %\begin{tikzpicture} \draw[fill=steelblue!20, draw=none] (0.0, 0.0) to (0.10649466622338281, 0.1062934856473654) to (0.21298933244676563, 0.21138262362962432) to (0.31948399867014843, 0.31407671202194876) to (0.42597866489353126, 0.41321218576837815) to (0.5324733311169141, 0.5076658003388399) to (0.6389679973402969, 0.5963673585385013) to (0.7454626635636797, 0.6783118362696161) to (0.8519573297870625, 0.7525707698561385) to (0.9584519960104453, 0.818302775908169) to (1.0649466622338282, 0.8747630845319613) to (1.171441328457211, 0.921311977870413) to (1.2779359946805937, 0.9574220383620055) to (1.3844306609039765, 0.9826841245925209) to (1.4909253271273595, 0.9968120070307501) to (1.5974199933507423, 0.9996456111234526) to (1.703914659574125, 0.9911528310040072) to (1.8104093257975078, 0.97142989326471) to (1.9169039920208906, 0.9407002666710333) to (2.0233986582442736, 0.8993121301712192) to (2.1298933244676563, 0.847734427889671) to (2.236387990691039, 0.7865515558026426) to (2.342882656914422, 0.7164567402983153) to (2.4493773231378047, 0.6382441836448203) to (2.5558719893611874, 0.5528000653611936) to (2.66236665558457, 0.4610925014493262) to (2.768861321807953, 0.3641605752528225) to (2.875355988031336, 0.26310256422752126) to (2.981850654254719, 0.1590634960190721) to (3.0883453204781017, 0.053222174842178754) to (3.1948399867014845, -0.053222174842178505) to (3.3013346529248673, -0.15906349601907185) to (3.40782931914825, -0.26310256422752104) to (3.514323985371633, -0.3641605752528219) to (3.6208186515950156, -0.46109250144932556) to (3.7273133178183984, -0.5528000653611931) to (3.833807984041781, -0.6382441836448197) to (3.940302650265164, -0.7164567402983147) to (4.046797316488547, -0.7865515558026425) to (4.15329198271193, -0.8477344278896709) to (4.259786648935313, -0.8993121301712191) to (4.366281315158695, -0.9407002666710332) to (4.472775981382078, -0.9714298932647099) to (4.579270647605461, -0.9911528310040071) to (4.685765313828844, -0.9996456111234525) to (4.7922599800522265, -0.9968120070307502) to (4.898754646275609, -0.9826841245925211) to (5.005249312498992, -0.9574220383620057)... (290 lines skipped) ... (1.0649466622338282, 0.4845508703326502) to (1.171441328457211, 0.38882417547332077) to (1.2779359946805937, 0.28869194733962117) to (1.3844306609039765, 0.18528872408711453) to (1.4909253271273595, 0.0797861055530831) to (1.5974199933507423, -0.026620521437774693) to (1.703914659574125, -0.13272552728372186) to (1.8104093257975078, -0.23732669987111465) to (1.9169039920208906, -0.33923886611803006) to (2.0233986582442736, -0.43730732045885534) to (2.1298933244676563, -0.5304209081197424) to (2.236387990691039, -0.6175246149461918) to (2.342882656914422, -0.6976315211349846) to (2.4493773231378047, -0.769833983429906) to (2.5558719893611874, -0.8333139190825148) to (2.66236665558457, -0.8873520750565714) to (2.768861321807953, -0.9313361774523383) to (2.875355988031336, -0.9647678688145159) to (2.981850654254719, -0.9872683547213446) to (3.0883453204781017, -0.9985826956767619) to (3.1948399867014845, -0.9985826956767619) to (3.3013346529248673, -0.9872683547213446) to (3.40782931914825, -0.964767868814516) to (3.514323985371633, -0.9313361774523385) to (3.6208186515950156, -0.8873520750565718) to (3.7273133178183984, -0.8333139190825152) to (3.833807984041781, -0.7698339834299065) to (3.940302650265164, -0.697631521134985) to (4.046797316488547, -0.617524614946192) to (4.15329198271193, -0.5304209081197426) to (4.259786648935313, -0.43730732045885556) to (4.366281315158695, -0.3392388661180305) to (4.472775981382078, -0.2373266998711151) to (4.579270647605461, -0.1327255272837223) to (4.685765313828844, -0.02662052143777516) to (4.7922599800522265, 0.07978610555308265) to (4.898754646275609, 0.18528872408711383) to (5.005249312498992, 0.2886919473396205) to (5.111743978722375, 0.3888241754733201) to (5.218238644945758, 0.4845508703326496) to (5.32473331116914, 0.5747874102144063) to (5.431227977392523, 0.6585113790650381) to (5.537722643615906, 0.7347741508630667) to (5.644217309839289, 0.8027116379309631) to (5.750711976062672, 0.8615540813938061) to (5.857206642286055, 0.9106347728549131) to (5.963701308509438, 0.9493976084683813) to (6.070195974732821, 0.9774033898178666) to (6.1766906409562035, 0.9943348002101371) to (6.283185307179586, 1.0);\end{tikzpicture}2.7 Layers in TikzFigure
Section titled “2.7 Layers in TikzFigure”The layer= parameter on every drawing call controls render order.
Lower-numbered layers are drawn first (behind), higher layers on top.
tf7 = tz.TikzFigure()
# layer 0: background fill (drawn first)tf7.rectangle((0, -1.2), (2 * np.pi, 1.2), fill="gray!8", draw="gray!30", layer=0)
# layer 1: shaded areaarea = sin_nodes + [(float(x[-1]), 0), (float(x[0]), 0)]tf7.draw(area, fill="steelblue!25", draw="none", cycle=True, layer=1)
# layer 2: the curve (drawn last, on top)tf7.draw(sin_nodes, color="steelblue", line_width=2.0, layer=2)tf7.add_node(np.pi / 2, 1.15, content=r"$\sin(x)$", color="steelblue", layer=2)
print(tf7.generate_tikz())
% --------------------------------------------- %% Tikzfigure generated by tikzfigure v0.5.0 %% https://github.com/max-models/tikzfigure %% --------------------------------------------- %\begin{tikzpicture} % Define the layers library \pgfdeclarelayer{0} \pgfdeclarelayer{1} \pgfdeclarelayer{2} \pgfsetlayers{0,1,2}
% Layer 0 \begin{pgfonlayer}{0} \draw[fill=gray!8, draw=gray!30] ({0}, {-1.2}) rectangle ({6.283185307179586}, {1.2}); \end{pgfonlayer}{0}
% Layer 1 \begin{pgfonlayer}{1} \draw[fill=steelblue!25, draw=none] (0.0, 0.0) to (0.10649466622338281, 0.1062934856473654) to (0.21298933244676563, 0.21138262362962432) to (0.31948399867014843, 0.31407671202194876) to (0.42597866489353126, 0.41321218576837815) to (0.5324733311169141, 0.5076658003388399) to (0.6389679973402969, 0.5963673585385013) to (0.7454626635636797, 0.6783118362696161) to (0.8519573297870625, 0.7525707698561385) to (0.9584519960104453, 0.818302775908169) to (1.0649466622338282, 0.8747630845319613) to (1.171441328457211, 0.921311977870413) to (1.2779359946805937, 0.9574220383620055) to (1.3844306609039765, 0.9826841245925209) to (1.4909253271273595, 0.9968120070307501) to (1.5974199933507423, 0.9996456111234526) to (1.703914659574125, 0.9911528310040072) to (1.8104093257975078, 0.97142989326471) to (1.9169039920208906, 0.9407002666710333) to (2.0233986582442736, 0.8993121301712192) to (2.1298933244676563, 0.847734427889671) to (2.236387990691039, 0.7865515558026426) to (2.342882656914422, 0.7164567402983153) to (2.4493773231378047, 0.6382441836448203) to (2.5558719893611874, 0.5528000653611936) to (2.66236665558457, 0.4610925014493262) to (2.768861321807953, 0.3641605752528225) to (2.875355988031336, 0.26310256422752126) to (2.981850654254719, 0.1590634960190721) to (3.0883453204781017, 0.053222174842178754) to (3.1948399867014845, -0.053222174842178505) to (3.3013346529248673, -0.15906349601907185) to (3.40782931914825, -0.26310256422752104) to (3.514323985371633, -0.3641605752528219) to (3.6208186515950156, -0.46109250144932556) to (3.7273133178183984, -0.5528000653611931) to (3.833807984041781, -0.6382441836448197) to (3.940302650265164, -0.7164567402983147) to (4.046797316488547, -0.7865515558026425) to (4.15329198271193, -0.8477344278896709) to (4.259786648935313, -0.8993121301712191) to... (67 lines skipped) ... (1.171441328457211, 0.921311977870413) to (1.2779359946805937, 0.9574220383620055) to (1.3844306609039765, 0.9826841245925209) to (1.4909253271273595, 0.9968120070307501) to (1.5974199933507423, 0.9996456111234526) to (1.703914659574125, 0.9911528310040072) to (1.8104093257975078, 0.97142989326471) to (1.9169039920208906, 0.9407002666710333) to (2.0233986582442736, 0.8993121301712192) to (2.1298933244676563, 0.847734427889671) to (2.236387990691039, 0.7865515558026426) to (2.342882656914422, 0.7164567402983153) to (2.4493773231378047, 0.6382441836448203) to (2.5558719893611874, 0.5528000653611936) to (2.66236665558457, 0.4610925014493262) to (2.768861321807953, 0.3641605752528225) to (2.875355988031336, 0.26310256422752126) to (2.981850654254719, 0.1590634960190721) to (3.0883453204781017, 0.053222174842178754) to (3.1948399867014845, -0.053222174842178505) to (3.3013346529248673, -0.15906349601907185) to (3.40782931914825, -0.26310256422752104) to (3.514323985371633, -0.3641605752528219) to (3.6208186515950156, -0.46109250144932556) to (3.7273133178183984, -0.5528000653611931) to (3.833807984041781, -0.6382441836448197) to (3.940302650265164, -0.7164567402983147) to (4.046797316488547, -0.7865515558026425) to (4.15329198271193, -0.8477344278896709) to (4.259786648935313, -0.8993121301712191) to (4.366281315158695, -0.9407002666710332) to (4.472775981382078, -0.9714298932647099) to (4.579270647605461, -0.9911528310040071) to (4.685765313828844, -0.9996456111234525) to (4.7922599800522265, -0.9968120070307502) to (4.898754646275609, -0.9826841245925211) to (5.005249312498992, -0.9574220383620057) to (5.111743978722375, -0.9213119778704132) to (5.218238644945758, -0.8747630845319616) to (5.32473331116914, -0.8183027759081695) to (5.431227977392523, -0.752570769856139) to (5.537722643615906, -0.6783118362696167) to (5.644217309839289, -0.5963673585385021) to (5.750711976062672, -0.50766580033884) to (5.857206642286055, -0.4132121857683782) to (5.963701308509438, -0.3140767120219489) to (6.070195974732821, -0.21138262362962446) to (6.1766906409562035, -0.1062934856473656) to (6.283185307179586, -2.4492935982947064e-16); \node[color=steelblue] (node0) at ({1.5707963267948966}, {1.15}) {$\sin(x)$}; \end{pgfonlayer}{2}\end{tikzpicture}2.8 Escaping to raw TikZ code
Section titled “2.8 Escaping to raw TikZ code”For anything not yet covered by the API, use add_raw() to inject verbatim TikZ.
tf8 = tz.TikzFigure()tf8.draw(sin_nodes, color="steelblue", line_width=1.5)
# Inject custom TikZ — a dashed grid linetf8.add_raw(r"\draw[gray!40, dashed] (0, 0) -- (6.28, 0);")
# Annotation with arrow using raw TikZtf8.add_raw(    r"\draw[->, gray] (1.0, 0.6) -- (1.57, 1.0) node[right, font=\small] {peak};")
print(tf8.generate_tikz())
% --------------------------------------------- %% Tikzfigure generated by tikzfigure v0.5.0 %% https://github.com/max-models/tikzfigure %% --------------------------------------------- %\begin{tikzpicture} \draw[color=steelblue, line width=1.5] (0.0, 0.0) to (0.10649466622338281, 0.1062934856473654) to (0.21298933244676563, 0.21138262362962432) to (0.31948399867014843, 0.31407671202194876) to (0.42597866489353126, 0.41321218576837815) to (0.5324733311169141, 0.5076658003388399) to (0.6389679973402969, 0.5963673585385013) to (0.7454626635636797, 0.6783118362696161) to (0.8519573297870625, 0.7525707698561385) to (0.9584519960104453, 0.818302775908169) to (1.0649466622338282, 0.8747630845319613) to (1.171441328457211, 0.921311977870413) to (1.2779359946805937, 0.9574220383620055) to (1.3844306609039765, 0.9826841245925209) to (1.4909253271273595, 0.9968120070307501) to (1.5974199933507423, 0.9996456111234526) to (1.703914659574125, 0.9911528310040072) to (1.8104093257975078, 0.97142989326471) to (1.9169039920208906, 0.9407002666710333) to (2.0233986582442736, 0.8993121301712192) to (2.1298933244676563, 0.847734427889671) to (2.236387990691039, 0.7865515558026426) to (2.342882656914422, 0.7164567402983153) to (2.4493773231378047, 0.6382441836448203) to (2.5558719893611874, 0.5528000653611936) to (2.66236665558457, 0.4610925014493262) to (2.768861321807953, 0.3641605752528225) to (2.875355988031336, 0.26310256422752126) to (2.981850654254719, 0.1590634960190721) to (3.0883453204781017, 0.053222174842178754) to (3.1948399867014845, -0.053222174842178505) to (3.3013346529248673, -0.15906349601907185) to (3.40782931914825, -0.26310256422752104) to (3.514323985371633, -0.3641605752528219) to (3.6208186515950156, -0.46109250144932556) to (3.7273133178183984, -0.5528000653611931) to (3.833807984041781, -0.6382441836448197) to (3.940302650265164, -0.7164567402983147) to (4.046797316488547, -0.7865515558026425) to (4.15329198271193, -0.8477344278896709) to (4.259786648935313, -0.8993121301712191) to (4.366281315158695, -0.9407002666710332) to (4.472775981382078, -0.9714298932647099) to (4.579270647605461, -0.9911528310040071) to (4.685765313828844, -0.9996456111234525) to (4.7922599800522265, -0.9968120070307502) to (4.898754646275609, -0.9826841245925211) to (5.005249312498992, -0.9574220383620057) to (5.111743978722375, -0.9213119778704132) to (5.218238644945758, -0.8747630845319616) to (5.32473331116914, -0.8183027759081695) to (5.431227977392523, -0.752570769856139) to (5.537722643615906, -0.6783118362696167) to (5.644217309839289, -0.5963673585385021) to (5.750711976062672, -0.50766580033884) to (5.857206642286055, -0.4132121857683782) to (5.963701308509438, -0.3140767120219489) to (6.070195974732821, -0.21138262362962446) to (6.1766906409562035, -0.1062934856473656) to (6.283185307179586, -2.4492935982947064e-16); \draw[gray!40, dashed] (0, 0) -- (6.28, 0); \draw[->, gray] (1.0, 0.6) -- (1.57, 1.0) node[right, font=\small] {peak};\end{tikzpicture}2.9 Putting it all together — a complete figure
Section titled “2.9 Putting it all together — a complete figure”Combine paths, shapes, nodes, and colours into a single publication-ready figure.
tf_final = tz.TikzFigure(figsize=(12, 7))
# --- colours ---tf_final.colorlet("cblue", "blue!65!white")tf_final.colorlet("cred", "red!75!black")
# --- background ---tf_final.rectangle((0, -1.3), (2 * np.pi, 1.3), fill="gray!5", draw="gray!30")
# --- zero axis ---tf_final.line((0, 0), (2 * np.pi, 0), color="gray!60", dash_pattern="on 2pt off 2pt")
# --- shaded area between curves ---# approximate: shade where sin > cos (first half)x_half = x[x <= np.pi]upper = np.sin(x_half)lower = np.cos(x_half)region = [(float(xi), float(u)) for xi, u in zip(x_half, upper)] + [    (float(xi), float(lo)) for xi, lo in zip(reversed(x_half), reversed(lower))]tf_final.draw(region, fill="cblue!20", draw="none", cycle=True)
# --- curves ---tf_final.draw(sin_nodes, color="cblue", line_width=1.8)tf_final.draw(cos_nodes, color="cred", line_width=1.5)
# --- markers at key points ---tf_final.circle((np.pi / 2, 1.0), radius=0.08, fill="cblue", draw="none")tf_final.circle((np.pi, 0.0), radius=0.08, fill="cblue", draw="none")tf_final.circle((0, 1.0), radius=0.08, fill="cred", draw="none")
# --- labels ---tf_final.add_node(    np.pi / 2 + 0.3, 1.05, content=r"$\sin(x)$", color="cblue", anchor="west")tf_final.add_node(0.2, 1.1, content=r"$\cos(x)$", color="cred", anchor="west")
# --- save and show ---with open("complete_figure.tex", "w") as f:    f.write(tf_final.generate_tikz())print("Saved complete_figure.tex")print()print(tf_final.generate_tikz())
Saved complete_figure.tex
% --------------------------------------------- %% Tikzfigure generated by tikzfigure v0.5.0 %% https://github.com/max-models/tikzfigure %% --------------------------------------------- %\begin{tikzpicture} \colorlet{cblue}{blue!65!white} \colorlet{cred}{red!75!black} \draw[fill=gray!5, draw=gray!30] ({0}, {-1.3}) rectangle ({6.283185307179586}, {1.3}); \draw[color=gray!60, dash pattern=on 2pt off 2pt] ({0}, {0}) -- ({6.283185307179586}, {0}); \draw[fill=cblue!20, draw=none] (0.0, 0.0) to (0.10649466622338281, 0.1062934856473654) to (0.21298933244676563, 0.21138262362962432) to (0.31948399867014843, 0.31407671202194876) to (0.42597866489353126, 0.41321218576837815) to (0.5324733311169141, 0.5076658003388399) to (0.6389679973402969, 0.5963673585385013) to (0.7454626635636797, 0.6783118362696161) to (0.8519573297870625, 0.7525707698561385) to (0.9584519960104453, 0.818302775908169) to (1.0649466622338282, 0.8747630845319613) to (1.171441328457211, 0.921311977870413) to (1.2779359946805937, 0.9574220383620055) to (1.3844306609039765, 0.9826841245925209) to (1.4909253271273595, 0.9968120070307501) to (1.5974199933507423, 0.9996456111234526) to (1.703914659574125, 0.9911528310040072) to (1.8104093257975078, 0.97142989326471) to (1.9169039920208906, 0.9407002666710333) to (2.0233986582442736, 0.8993121301712192) to (2.1298933244676563, 0.847734427889671) to (2.236387990691039, 0.7865515558026426) to (2.342882656914422, 0.7164567402983153) to (2.4493773231378047, 0.6382441836448203) to (2.5558719893611874, 0.5528000653611936) to (2.66236665558457, 0.4610925014493262) to (2.768861321807953, 0.3641605752528225) to (2.875355988031336, 0.26310256422752126) to (2.981850654254719, 0.1590634960190721) to (3.0883453204781017, 0.053222174842178754) to (3.0883453204781017, -0.9985826956767619) to (2.981850654254719, -0.9872683547213446) to (2.875355988031336, -0.9647678688145159) to (2.768861321807953, -0.9313361774523383) to (2.66236665558457, -0.8873520750565714) to (2.5558719893611874, -0.8333139190825148) to (2.4493773231378047, -0.769833983429906) to (2.342882656914422, -0.6976315211349846) to (2.236387990691039, -0.6175246149461918) to (2.1298933244676563, -0.5304209081197424) to (2.0233986582442736, -0.43730732045885534) to (1.9169039920208906, -0.33923886611803006) to (1.8104093257975078, -0.23732669987111465) to (1.703914659574125, -0.13272552728372186) to (1.5974199933507423, -0.026620521437774693)... (174 lines skipped) ... to (1.3844306609039765, 0.18528872408711453) to (1.4909253271273595, 0.0797861055530831) to (1.5974199933507423, -0.026620521437774693) to (1.703914659574125, -0.13272552728372186) to (1.8104093257975078, -0.23732669987111465) to (1.9169039920208906, -0.33923886611803006) to (2.0233986582442736, -0.43730732045885534) to (2.1298933244676563, -0.5304209081197424) to (2.236387990691039, -0.6175246149461918) to (2.342882656914422, -0.6976315211349846) to (2.4493773231378047, -0.769833983429906) to (2.5558719893611874, -0.8333139190825148) to (2.66236665558457, -0.8873520750565714) to (2.768861321807953, -0.9313361774523383) to (2.875355988031336, -0.9647678688145159) to (2.981850654254719, -0.9872683547213446) to (3.0883453204781017, -0.9985826956767619) to (3.1948399867014845, -0.9985826956767619) to (3.3013346529248673, -0.9872683547213446) to (3.40782931914825, -0.964767868814516) to (3.514323985371633, -0.9313361774523385) to (3.6208186515950156, -0.8873520750565718) to (3.7273133178183984, -0.8333139190825152) to (3.833807984041781, -0.7698339834299065) to (3.940302650265164, -0.697631521134985) to (4.046797316488547, -0.617524614946192) to (4.15329198271193, -0.5304209081197426) to (4.259786648935313, -0.43730732045885556) to (4.366281315158695, -0.3392388661180305) to (4.472775981382078, -0.2373266998711151) to (4.579270647605461, -0.1327255272837223) to (4.685765313828844, -0.02662052143777516) to (4.7922599800522265, 0.07978610555308265) to (4.898754646275609, 0.18528872408711383) to (5.005249312498992, 0.2886919473396205) to (5.111743978722375, 0.3888241754733201) to (5.218238644945758, 0.4845508703326496) to (5.32473331116914, 0.5747874102144063) to (5.431227977392523, 0.6585113790650381) to (5.537722643615906, 0.7347741508630667) to (5.644217309839289, 0.8027116379309631) to (5.750711976062672, 0.8615540813938061) to (5.857206642286055, 0.9106347728549131) to (5.963701308509438, 0.9493976084683813) to (6.070195974732821, 0.9774033898178666) to (6.1766906409562035, 0.9943348002101371) to (6.283185307179586, 1.0); \draw[fill=cblue, draw=none] ({1.5707963267948966}, {1.0}) circle (0.08); \draw[fill=cblue, draw=none] ({3.141592653589793}, {0.0}) circle (0.08); \draw[fill=cred, draw=none] ({0}, {1.0}) circle (0.08); \node[color=cblue, anchor=west] (node0) at ({1.8707963267948966}, {1.05}) {$\sin(x)$}; \node[color=cred, anchor=west] (node1) at ({0.2}, {1.1}) {$\cos(x)$};\end{tikzpicture}# Renders to PDF (requires pdflatex):tf_final.show()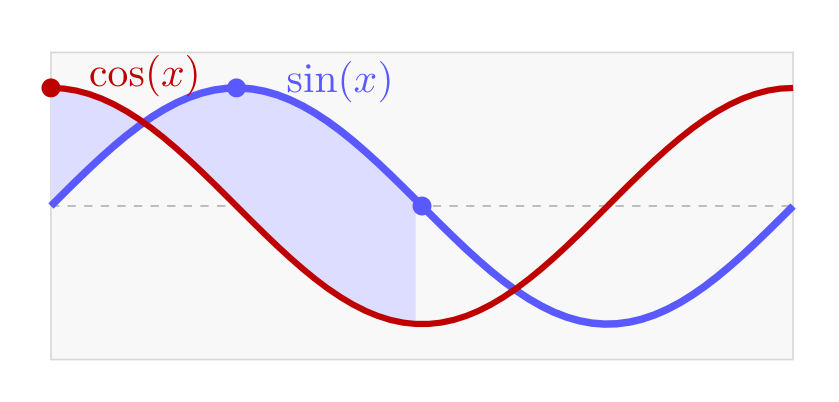
2.10 Embedding in a LaTeX document
Section titled “2.10 Embedding in a LaTeX document”The generated code is a standalone tikzpicture environment.
Drop it into any LaTeX document:
\usepackage{tikz}
\begin{figure}[h]  \centering  \input{complete_figure.tex}  \caption{Trigonometric functions with shaded region.}  \label{fig:trig}\end{figure}
Or compile a standalone PDF with tikzfigure’s generate_standalone() method:
standalone_src = tf_final.generate_standalone()with open('standalone.tex', 'w') as f: f.write(standalone_src)# Then: pdflatex standalone.texSummary
Section titled “Summary”Canvas → TikZ workflow
Section titled “Canvas → TikZ workflow”canvas = Canvas(width='10cm', ratio=0.6)canvas.plot(x, y, color='steelblue', line_width=1.5)tikz = canvas.render(backend='tikzfigure')print(tikz.generate_tikz()) # inspect LaTeXtikz.show() # render (needs pdflatex)Direct tikzfigure API — key methods
Section titled “Direct tikzfigure API — key methods”| Method | Purpose |
|---|---|
tf.draw(nodes, color=, line_width=, fill=, ...) | Path through coordinate list |
tf.line(start, end, arrows='->', ...) | Straight line segment |
tf.rectangle(corner1, corner2, fill=, draw=, ...) | Rectangle |
tf.circle(center, radius, fill=, ...) | Circle |
tf.arc(start, start_angle, end_angle, radius, ...) | Arc |
tf.add_node(x, y, content=, shape=, fill=, ...) | Labelled node |
tf.colorlet(name, color_expr) | Define named colour |
tf.add_raw(tikz_code) | Inject verbatim TikZ |
tf.generate_tikz() | Return LaTeX string |
tf.show() | Compile + display (needs pdflatex) |
TikZ colour syntax cheatsheet
Section titled “TikZ colour syntax cheatsheet”| Expression | Meaning |
|---|---|
'red', 'blue', 'green' | Standard colours |
'blue!70!white' | 70% blue + 30% white |
'red!80!black' | 80% red + 20% black |
'blue!50!red' | 50% blend |
'gray!20' | 20% gray (80% white) |
Part 1.8 — Canvas primitives supported by TikZ
Section titled “Part 1.8 — Canvas primitives supported by TikZ”The Canvas TikZ backend supports line, scatter, bar, horizontal-bar, filled-region, and error-bar plots. The following example renders the canvas as TikZ source.
import numpy as np
from maxplotlib import Canvas
x = np.arange(5)y = np.array([1.0, 2.2, 1.4, 3.0, 2.5])
primitive_canvas = Canvas()primitive_canvas.plot(x, y, color="black", linewidth=1.5)primitive_canvas.scatter(x, y + 0.35, color="crimson")primitive_canvas.bar(x, y * 0.35, color="steelblue", alpha=0.7)primitive_canvas.fill_between(x, y, 0, color="gold", alpha=0.2)primitive_canvas.errorbar(x, y, yerr=0.15, color="darkgreen")primitive_canvas.configure(    title="TikZ-supported Canvas primitives",    xlabel="Sample",    ylabel="Value",    grid=True,)
Canvas(nrows=1, ncols=1, caption=None, label=None)tikz_primitive_figure = primitive_canvas.render(backend="tikzfigure")print(str(tikz_primitive_figure)[:2000])% --------------------------------------------- %% Tikzfigure generated by tikzfigure v0.5.0 %% https://github.com/max-models/tikzfigure %% --------------------------------------------- %\begin{tikzpicture} \node[anchor=north, inner sep=0pt, font={\fontsize{10}{12}\selectfont}] at (3.2000in,4.7040in) {TikZ-supported Canvas primitives}; \node[anchor=south, inner sep=0pt, font={\fontsize{12}{14.4}\selectfont}] at (3.2000in,0.0480in) {Sample}; \node[anchor=west, inner sep=0pt, rotate=90, font={\fontsize{12}{14.4}\selectfont}] at (0.1280in,2.4000in) {Value}; \definecolor{mpl000000}{HTML}{000000} \definecolor{mplFFFFFF}{HTML}{FFFFFF} \definecolor{mplDC143C}{HTML}{DC143C} \definecolor{mpl4682B4}{HTML}{4682B4} \definecolor{mplFFD700}{HTML}{FFD700} \definecolor{mpl006400}{HTML}{006400} \definecolor{mplB0B0B0}{HTML}{B0B0B0} \begin{axis}[scale only axis, anchor=south west, at={(0.8000in,0.5280in)}, clip mode=individual, unbounded coords=jump, every axis plot/.append style={line join=round}, xtick={0,1,2,3,4}, xtick pos=left, xticklabel pos=left, x tick label style={font={\fontsize{10}{12}\selectfont}}, tick align=inside, major tick length=3.5pt, ytick={0,0.5,1,1.5,2,2.5,3,3.5}, ytick pos=left, yticklabel pos=left, y tick label style={font={\fontsize{10}{12}\selectfont}}, xlabel style={font={\fontsize{10}{12}\selectfont}}, ylabel style={font={\fontsize{10}{12}\selectfont}}, title style={font={\fontsize{10}{12}\selectfont}}, xmajorgrids, ymajorgrids, major grid style={draw=mplB0B0B0, line width=0.8pt, dash pattern=on 0.8pt off 1.32pt}, xmin=-0.6400000000000001, xmax=4.640000000000001, ymin=0.0, ymax=3.5175, width=4.9600in, height=3.6960in] \addplot[only marks, mark=*, mark size=3pt, mark options={solid, fill=mplDC143C, draw=mplDC143C, line width=1pt}, forget plot] coordinates {(0,1.35) (1,2.55) (2,1.75) (3,3.35) (4,2.85)}; \addplot[fill=mpl4682B4, fill opacity=0.7, draw=none, mark=none, area legend, forgetThe next cell shows the TikZ generated from the canvas. Unsupported primitives now raise
NotImplementedError instead of being silently omitted.
Part 1.9 — More TikZ-supported primitives
Section titled “Part 1.9 — More TikZ-supported primitives”Step and stairs plots, stems, reference lines, spans, and polygon fills are also translated to TikZ. The generated TikZ is printed below.
more_canvas = Canvas()more_canvas.step(x, y, color="black", where="post")more_canvas.stem(x, y, linefmt="m-", markerfmt="mo")more_canvas.hlines([1.5, 2.5], 0, 4, color="gray", linestyle="--")more_canvas.vlines([1, 3], 0, 3.5, color="gray")more_canvas.axvspan(1, 2, color="orange", alpha=0.2)more_canvas.axhspan(1, 2, color="green", alpha=0.2)more_canvas.fill(x, [0.2, 0.8, 0.4, 1.0, 0.2], color="cyan", alpha=0.2)more_canvas.configure( title="Additional TikZ primitives", xlabel="Sample", ylabel="Value", grid=True)Canvas(nrows=1, ncols=1, caption=None, label=None)more_tikz = more_canvas.render(backend="tikzfigure")print(str(more_tikz)[:2000])% --------------------------------------------- %% Tikzfigure generated by tikzfigure v0.5.0 %% https://github.com/max-models/tikzfigure %% --------------------------------------------- %\begin{tikzpicture} \node[anchor=north, inner sep=0pt, font={\fontsize{10}{12}\selectfont}] at (3.2000in,4.7040in) {Additional TikZ primitives}; \node[anchor=south, inner sep=0pt, font={\fontsize{12}{14.4}\selectfont}] at (3.2000in,0.0480in) {Sample}; \node[anchor=west, inner sep=0pt, rotate=90, font={\fontsize{12}{14.4}\selectfont}] at (0.1280in,2.4000in) {Value}; \definecolor{mpl000000}{HTML}{000000} \definecolor{mplFFFFFF}{HTML}{FFFFFF} \definecolor{mplFFA500}{HTML}{FFA500} \definecolor{mpl008000}{HTML}{008000} \definecolor{mpl00FFFF}{HTML}{00FFFF} \definecolor{mplBF00BF}{HTML}{BF00BF} \definecolor{mplD62728}{HTML}{D62728} \definecolor{mpl808080}{HTML}{808080} \definecolor{mplB0B0B0}{HTML}{B0B0B0} \begin{axis}[scale only axis, anchor=south west, at={(0.8000in,0.5280in)}, clip mode=individual, unbounded coords=jump, every axis plot/.append style={line join=round}, xtick={0,0.5,1,1.5,2,2.5,3,3.5,4}, xtick pos=left, xticklabel pos=left, x tick label style={font={\fontsize{10}{12}\selectfont}}, tick align=inside, major tick length=3.5pt, ytick={0,0.5,1,1.5,2,2.5,3,3.5}, ytick pos=left, yticklabel pos=left, y tick label style={font={\fontsize{10}{12}\selectfont}}, xlabel style={font={\fontsize{10}{12}\selectfont}}, ylabel style={font={\fontsize{10}{12}\selectfont}}, title style={font={\fontsize{10}{12}\selectfont}}, xmajorgrids, ymajorgrids, major grid style={draw=mplB0B0B0, line width=0.8pt, dash pattern=on 0.8pt off 1.32pt}, xmin=-0.2, xmax=4.2, ymin=-0.17500000000000002, ymax=3.675, width=4.9600in, height=3.6960in] \addplot[fill=mplFFA500, fill opacity=0.2, draw=mplFFA500, line width=1pt, draw opacity=0.2, solid, mark=none, area legend, forget plot] coordinates {(1,-0.175) (2,-0.175) (2,3.675) (1,3.675) (1,-0.