Tutorials
Quick start
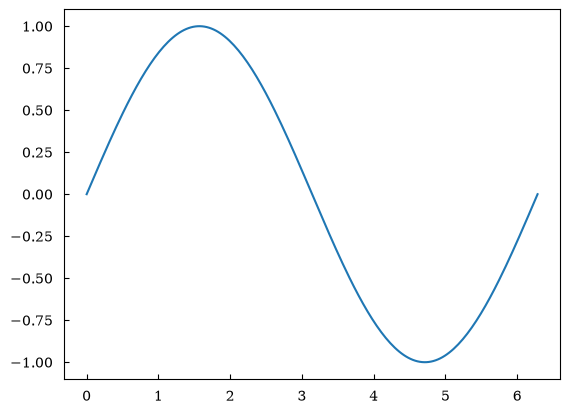
This notebook walks you through the very basics: - creating a canvas and a subplot - adding lines - using the canvas-level shortcut API - saving figures
Multiple subplots
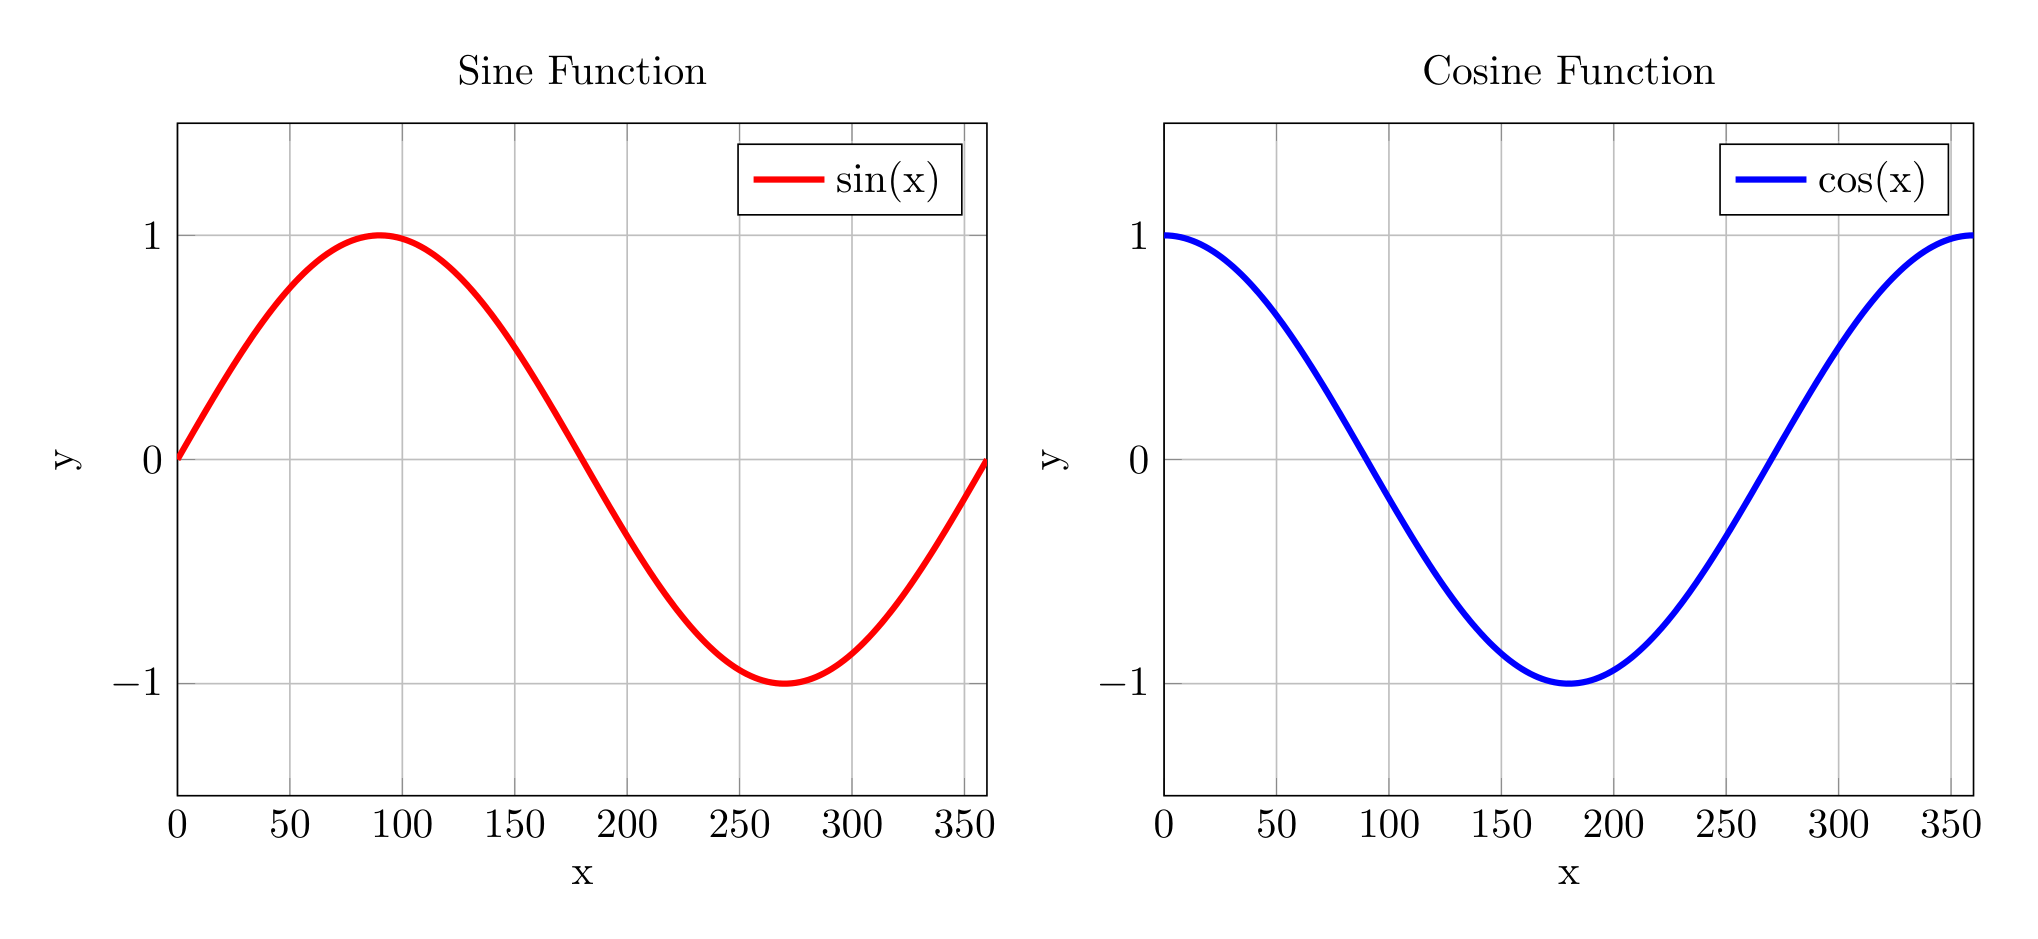
This notebook shows all the ways to build multi-panel figures with maxplotlib:
Plot types
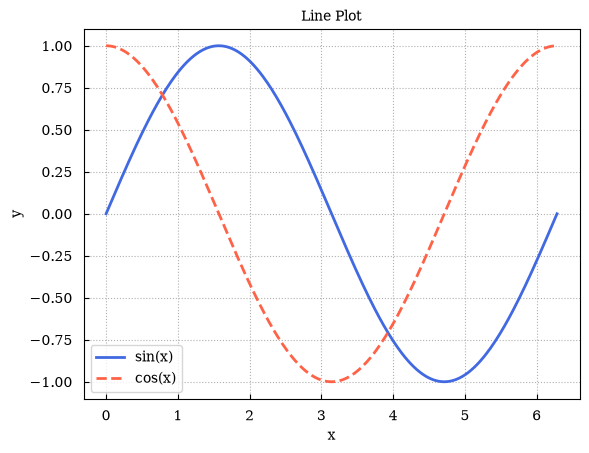
maxplotlib exposes all common Matplotlib plot types through a unified API. This notebook demonstrates each type individually, then shows how to combine multiple types in a single subplot.
Styling
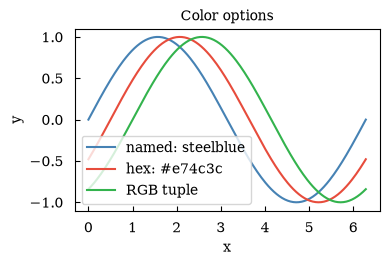
maxplotlib passes matplotlib kwargs directly to the underlying renderer, so every colour, linestyle, marker, and alpha option you know from matplotlib works here too.
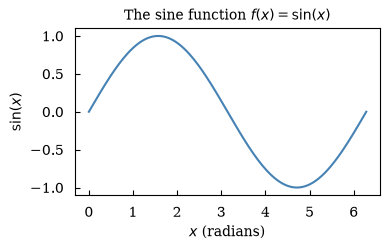
Axes and annotations
This tutorial covers every way to control the coordinate frame of a subplot: labels, limits, tick marks, log scales, grids, legends, and annotations.
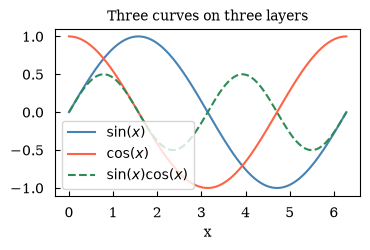
Layers
All examples in this tutorial use the same Canvas API; you can switch rendering backends at any time:
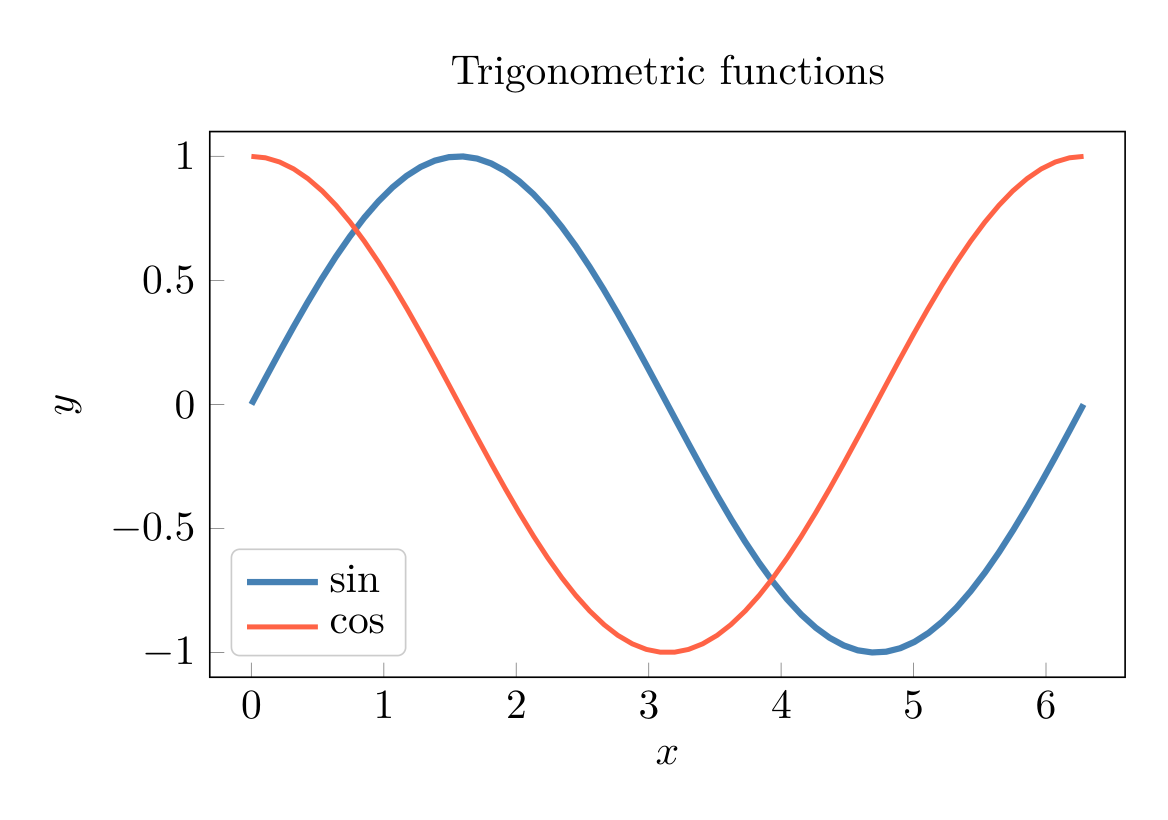
TikZ backend
This tutorial covers two complementary workflows:
Plotly backend
The Plotly backend renders your maxplotlib canvas as an interactive plotly.graphobjects.Figure. Unlike the default matplotlib output, Plotly figures:
plotext backend
The plotext backend renders a maxplotlib canvas directly in the terminal. That makes it a good fit for SSH sessions, CLI workflows, quick diagnostics, and situations where you want the same Canvas…
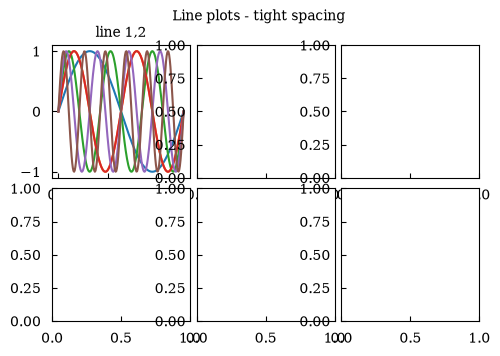
Subplot spacing
This tutorial shows how to build NxM subplot grids with the matplotlib backend and control the distance between plots using wspace=... and hspace=....
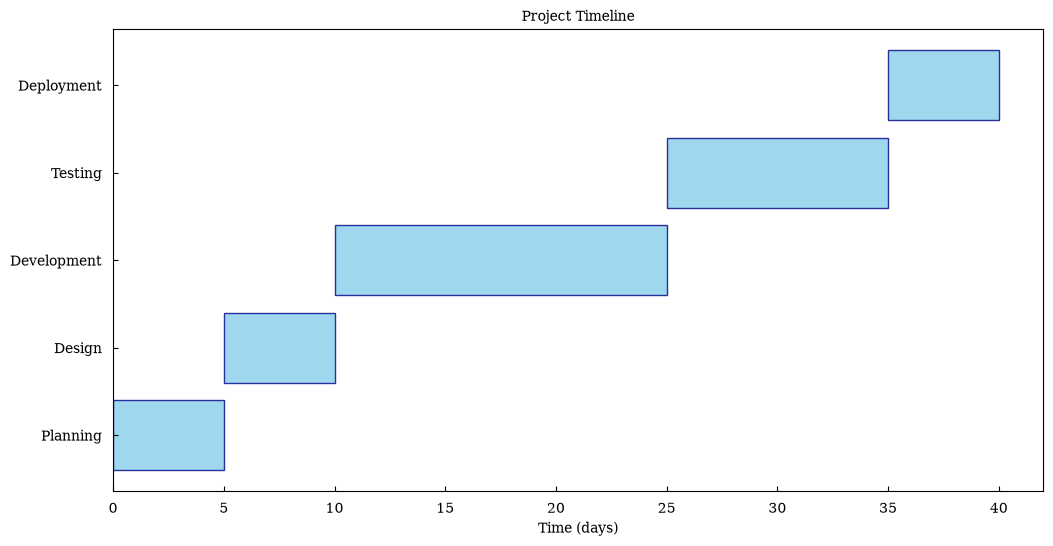
Gantt charts
This tutorial demonstrates how to create Gantt charts using maxplotlib across different backends.
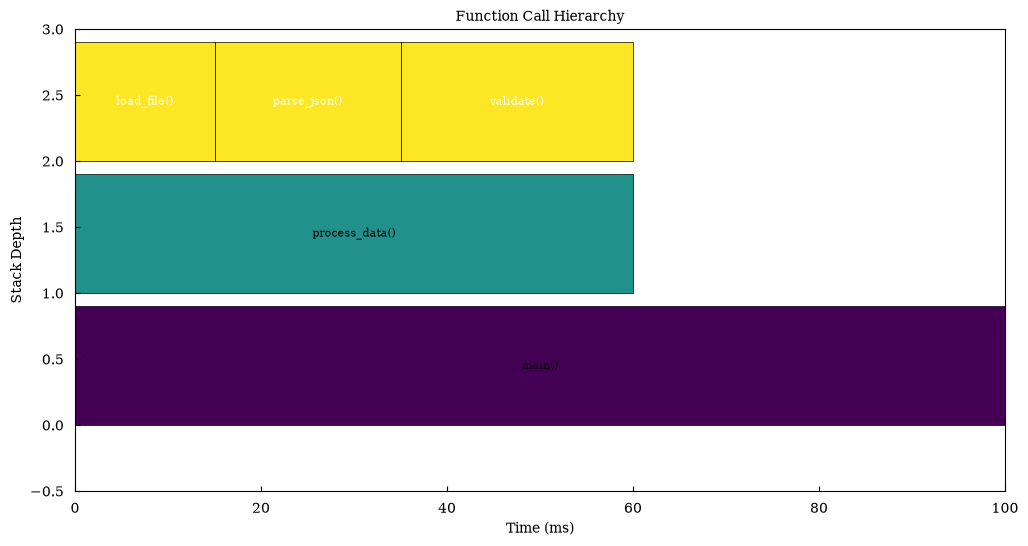
Flame charts
This tutorial demonstrates how to create flame charts using maxplotlib across different backends.
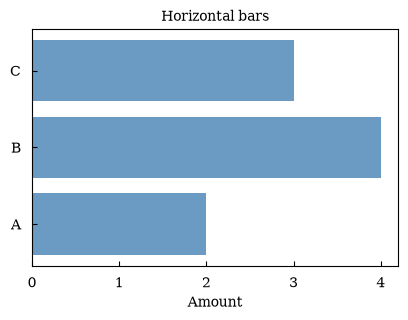
Advanced Matplotlib
This tutorial covers horizontal bars, histograms, filled regions, reference spans, arrows, infinitely extending lines, and secondary y-axes.
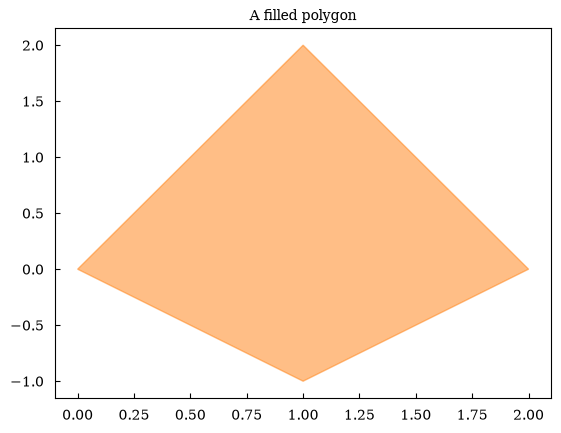
Axis and layout
This tutorial demonstrates the latest Matplotlib-style wrappers: filled polygons, logarithmic shortcuts, axis limits and autoscaling, secondary axes, box aspect, and explicit tick labels.
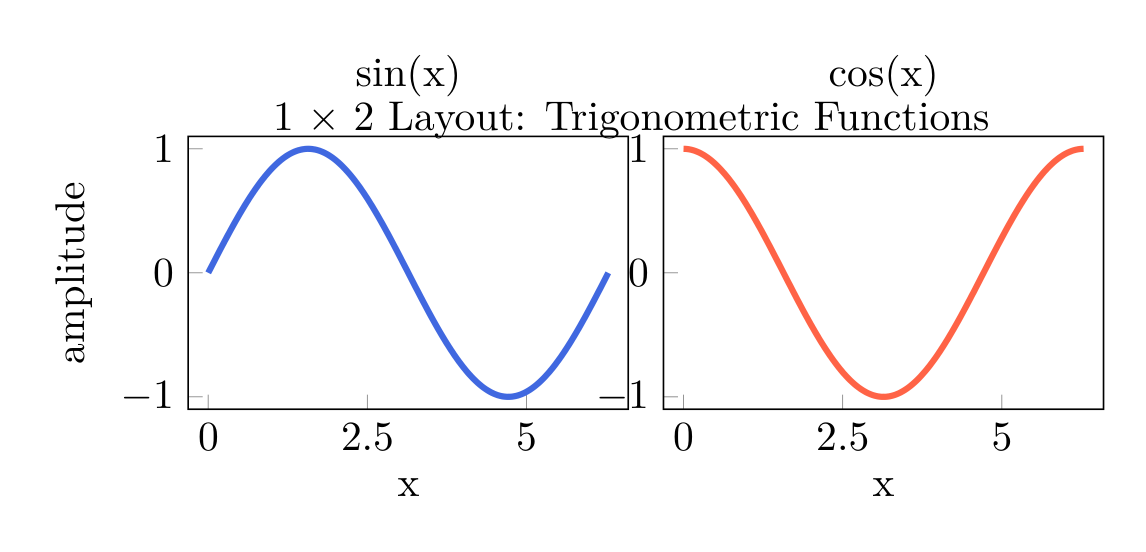
TikzFigure subplots
This tutorial demonstrates how to create subplots using the tikzfigure backend: side by side, stacked, or in a grid.
Advanced plotext
This tutorial focuses on practical terminal workflows that are easy to miss when moving from Matplotlib to the Plotext backend: layer-by-layer output, subplot dashboards, terminal-safe files, and…
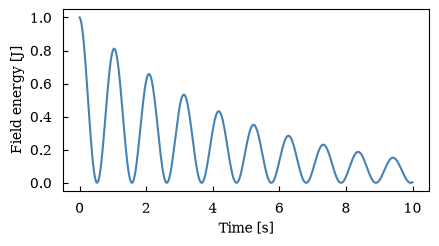
xarray data
maxplotlib understands labelled xarray data. Hand it a DataArray and it takes the coordinates for the axes, builds axis labels from the longname and units attributes, and titles the plot with the…
Nothing matches.