Layers
Layers let you assign each piece of data to a numbered layer. You can then render a subset of layers — e.g. to reveal a derivation step by step, or to produce separate PDF overlays from a single source file.
import numpy as np
from maxplotlib import Canvas
Backend selection
Section titled “Backend selection”All examples in this tutorial use the same Canvas API; you can switch rendering backends at any time:
BACKEND = "matplotlib"for static Matplotlib outputBACKEND = "plotly"for interactive Plotly output (Jupyter-friendly)
Most cells end with canvas.show(backend=BACKEND) so you can re-run the whole notebook with a different backend.
# Change to "plotly" for interactive outputBACKEND = "matplotlib"1 · Assigning data to layers
Section titled “1 · Assigning data to layers”Pass layer=<int> to any plot call. Layers are just integer tags — the default is 0.
x = np.linspace(0, 2 * np.pi, 200)
canvas = Canvas(width="10cm", ratio=0.55)
canvas.plot(x, np.sin(x), color="steelblue", label=r"$\sin(x)$", layer=0)canvas.plot(x, np.cos(x), color="tomato", label=r"$\cos(x)$", layer=1)canvas.plot(    x,    np.sin(x) * np.cos(x),    color="seagreen",    label=r"$\sin(x)\cos(x)$",    linestyle="dashed",    layer=2,)
canvas.set_xlabel("x")canvas.set_legend(True)canvas.set_title("Three curves on three layers")canvas.show(backend=BACKEND)  # renders all layers by default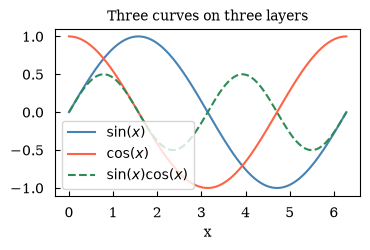
(<Figure size 393.701x216.535 with 1 Axes>, array([[<Axes: title={'center': 'Three curves on three layers'}, xlabel='x'>]], dtype=object))2 · Rendering specific layers
Section titled “2 · Rendering specific layers”Pass layers=[...] to canvas.show() or canvas.savefig() to render only a subset of layers.
x = np.linspace(0, 2 * np.pi, 200)
canvas = Canvas(width="10cm", ratio=0.55)
canvas.plot(x, np.sin(x), color="steelblue", label=r"$\sin(x)$", layer=0)canvas.plot(x, np.cos(x), color="tomato", label=r"$\cos(x)$", layer=1)canvas.plot(    x,    np.sin(x) * np.cos(x),    color="seagreen",    label=r"$\sin(x)\cos(x)$",    linestyle="dashed",    layer=2,)
canvas.set_xlabel("x")canvas.set_legend(True)
print("--- Layer 0 only ---")canvas.set_title("Layer 0 only")
canvas.show(backend=BACKEND, layers=[0])
--- Layer 0 only ---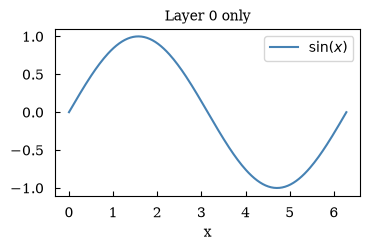
(<Figure size 393.701x216.535 with 1 Axes>, array([[<Axes: title={'center': 'Layer 0 only'}, xlabel='x'>]], dtype=object))# Same canvas — now show layers 0 and 1 togethercanvas.set_title("Layers 0 and 1")
canvas.show(backend=BACKEND, layers=[0, 1])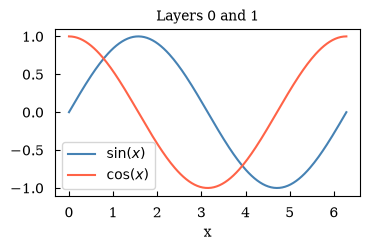
(<Figure size 393.701x216.535 with 1 Axes>, array([[<Axes: title={'center': 'Layers 0 and 1'}, xlabel='x'>]], dtype=object))# All layerscanvas.set_title("All layers")
canvas.show(backend=BACKEND, layers=[0, 1, 2])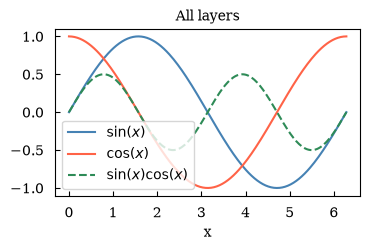
(<Figure size 393.701x216.535 with 1 Axes>, array([[<Axes: title={'center': 'All layers'}, xlabel='x'>]], dtype=object))3 · Saving layer-by-layer
Section titled “3 · Saving layer-by-layer”savefig with layer_by_layer=True writes one file per layer (e.g. fig_layer0.pdf, fig_layer1.pdf, …). This is ideal for building slide animations or LaTeX overlays.
# Demonstration — not executed to avoid writing files during tutorial## canvas.savefig('fig.pdf', layer_by_layer=True)## Produces:# fig_layer0.pdf (layer 0 only)# fig_layer1.pdf (layers 0–1)# fig_layer2.pdf (layers 0–2, i.e. all)## Each file is a cumulative reveal, suitable for \includegraphics[<1->]{fig_layer0}# in Beamer.4 · Use case: progressively revealing a derivation
Section titled “4 · Use case: progressively revealing a derivation”Build a plot where each layer adds the next step of a mathematical derivation.
x = np.linspace(0, 2 * np.pi, 300)
canvas = Canvas(width="11cm", ratio=0.6)
# Layer 0: raw data (noisy sine)rng = np.random.default_rng(42)y_data = np.sin(x) + rng.normal(0, 0.15, len(x))canvas.scatter(x, y_data, color="gray", s=8, alpha=0.5, label="measured data", layer=0)
# Layer 1: true functioncanvas.plot(    x, np.sin(x), color="steelblue", linewidth=2, label=r"true: $\sin(x)$", layer=1)
# Layer 2: envelopecanvas.fill_between(    x,    np.sin(x) - 0.15,    np.sin(x) + 0.15,    alpha=0.2,    color="steelblue",    label=r"$\pm 0.15$ envelope",    layer=2,)
canvas.set_xlabel("x")canvas.set_ylabel("y")canvas.set_legend(True)
# Step 1: only the data cloudcanvas.set_title("Step 1 – raw data")canvas.show(backend=BACKEND, layers=[0])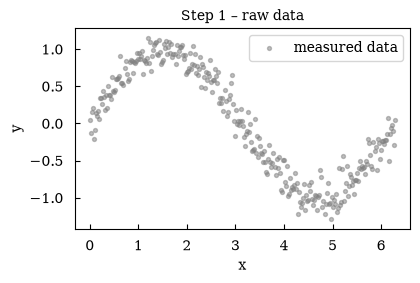
(<Figure size 433.071x259.843 with 1 Axes>, array([[<Axes: title={'center': 'Step 1 – raw data'}, xlabel='x', ylabel='y'>]], dtype=object))# Step 2: add the true curvecanvas.set_title("Step 2 – add true function")canvas.show(backend=BACKEND, layers=[0, 1])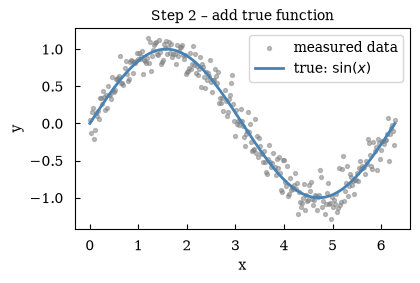
(<Figure size 433.071x259.843 with 1 Axes>, array([[<Axes: title={'center': 'Step 2 – add true function'}, xlabel='x', ylabel='y'>]], dtype=object))# Step 3: add the uncertainty envelopecanvas.set_title("Step 3 – add uncertainty envelope")canvas.show(backend=BACKEND, layers=[0, 1, 2])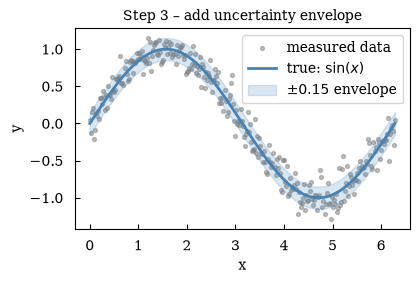
(<Figure size 433.071x259.843 with 1 Axes>, array([[<Axes: title={'center': 'Step 3 – add uncertainty envelope'}, xlabel='x', ylabel='y'>]], dtype=object))Summary
Section titled “Summary”| Concept | How |
|---|---|
| Assign to layer | canvas.plot(..., layer=1) |
| Render subset | canvas.show(layers=[0, 1]) |
| Save all layers | canvas.savefig('fig.pdf', layer_by_layer=True) |
| Default layer | 0 (omit layer= and it goes to layer 0) |
Layers make it easy to build slide-deck animations or incremental pedagogical figures from a single Python file.