Plot types
maxplotlib exposes all common Matplotlib plot types through a unified API. This notebook demonstrates each type individually, then shows how to combine multiple types in a single subplot.
Plot types covered:
plot · scatter · bar · fill_between · errorbar ·
axhline / axvline · hlines / vlines · combined plots · annotate / text
import numpy as np
from maxplotlib import Canvas
%matplotlib inline
rng = np.random.default_rng(42)x = np.linspace(0, 2 * np.pi, 300)
Backend selection
Section titled “Backend selection”All examples in this tutorial use the same Canvas API; you can switch rendering backends at any time:
BACKEND = "matplotlib"for static Matplotlib outputBACKEND = "plotly"for interactive Plotly output (Jupyter-friendly)
Most cells end with canvas.show(backend=BACKEND) so you can re-run the whole notebook with a different backend.
# Change to "plotly" for interactive outputBACKEND = "matplotlib"1 Line plot — canvas.plot()
Section titled “1 Line plot — canvas.plot()”canvas = Canvas()
canvas.plot( x, np.sin(x), label="sin(x)", color="royalblue", linestyle="solid", linewidth=2)canvas.plot( x, np.cos(x), label="cos(x)", color="tomato", linestyle="dashed", linewidth=2)
canvas.set_xlabel("x")canvas.set_ylabel("y")canvas.set_title("Line Plot")canvas.set_legend(True)canvas.set_grid(True)canvas.show(backend=BACKEND)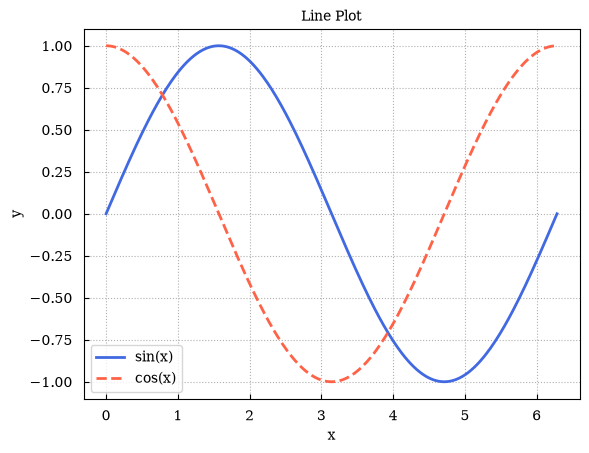
(<Figure size 640x480 with 1 Axes>, array([[<Axes: title={'center': 'Line Plot'}, xlabel='x', ylabel='y'>]], dtype=object))2 Scatter plot — ax.scatter()
Section titled “2 Scatter plot — ax.scatter()”Use c= to colour each point by a scalar value (requires a colormap-compatible array).
n = 200sx = rng.standard_normal(n)sy = rng.standard_normal(n)values = np.sqrt(sx**2 + sy**2)  # colour by distance from origin
canvas = Canvas()canvas.scatter(sx, sy, c=values, s=30, label="data points")canvas.set_xlabel("x")canvas.set_ylabel("y")canvas.set_title("Scatter Plot — coloured by distance")canvas.set_aspect("equal")canvas.show(backend=BACKEND)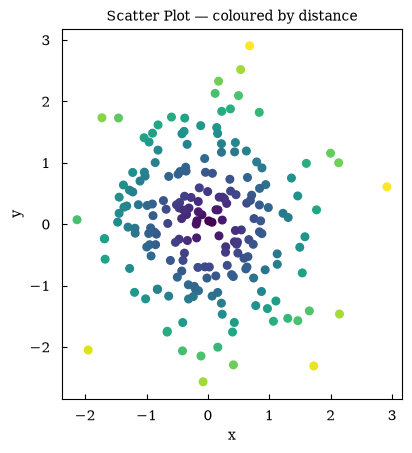
(<Figure size 640x480 with 1 Axes>, array([[<Axes: title={'center': 'Scatter Plot — coloured by distance'}, xlabel='x', ylabel='y'>]], dtype=object))3 Bar chart — ax.bar()
Section titled “3 Bar chart — ax.bar()”categories = ["Jan", "Feb", "Mar", "Apr", "May", "Jun"]values_bar = [12, 19, 15, 22, 30, 27]
canvas = Canvas()canvas.bar(categories, values_bar, color="steelblue", width=0.6, label="monthly sales")canvas.set_xlabel("Month")canvas.set_ylabel("Sales (units)")canvas.set_title("Bar Chart")canvas.set_legend(True)# canvas.show(backend=BACKEND) # TODO: Fix this error4 Fill between — ax.fill_between()
Section titled “4 Fill between — ax.fill_between()”Useful for shading confidence bands or uncertainty regions.
t = np.linspace(0, 4 * np.pi, 300)mean = np.sin(t) * np.exp(-t / 10)upper = mean + 0.3 * (1 - t / (4 * np.pi))lower = mean - 0.3 * (1 - t / (4 * np.pi))
canvas = Canvas()canvas.plot(t, mean, color="royalblue", label="mean", linewidth=2)canvas.fill_between(t, lower, upper, alpha=0.25, color="royalblue", label="±1 std")canvas.set_xlabel("t")canvas.set_ylabel("value")canvas.set_title("Fill Between — Confidence Band")canvas.set_legend(True)canvas.show(backend=BACKEND)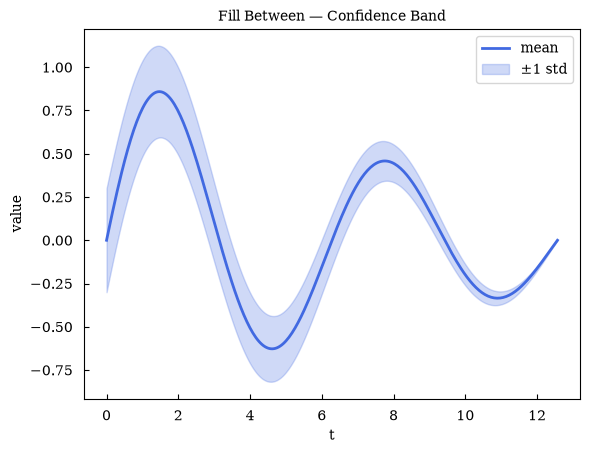
(<Figure size 640x480 with 1 Axes>, array([[<Axes: title={'center': 'Fill Between — Confidence Band'}, xlabel='t', ylabel='value'>]], dtype=object))5 Error bars — ax.errorbar()
Section titled “5 Error bars — ax.errorbar()”xm = np.linspace(0, 2 * np.pi, 12)ym = np.sin(xm) + rng.normal(0, 0.1, len(xm))yerr = 0.1 + 0.05 * rng.random(len(xm))
canvas = Canvas()canvas.errorbar( xm, ym, yerr=yerr, fmt="o", capsize=4, color="tomato", label="measurements")canvas.plot(x, np.sin(x), color="gray", linestyle="dashed", label="true sin(x)")canvas.set_xlabel("x")canvas.set_ylabel("y")canvas.set_title("Error Bars")canvas.set_legend(True)canvas.set_grid(True)canvas.show(backend=BACKEND)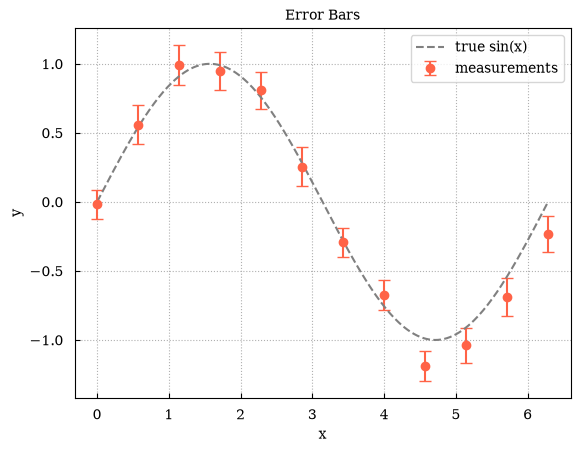
(<Figure size 640x480 with 1 Axes>, array([[<Axes: title={'center': 'Error Bars'}, xlabel='x', ylabel='y'>]], dtype=object))6 Reference lines — axhline and axvline
Section titled “6 Reference lines — axhline and axvline”Span the entire axis to mark thresholds or zero-crossings.
canvas = Canvas()canvas.plot(x, np.sin(x), color="royalblue", label="sin(x)")
canvas.axhline(y=0, color="black", linestyle="solid", linewidth=0.8)canvas.axhline(y=0.5, color="green", linestyle="dashed", linewidth=1.2, label="y = 0.5")canvas.axhline(    y=-0.5, color="green", linestyle="dashed", linewidth=1.2, label="y = -0.5")canvas.axvline(x=np.pi, color="red", linestyle="dotted", linewidth=1.5, label="x = π")
canvas.set_xlabel("x")canvas.set_title("axhline / axvline")canvas.set_legend(True)canvas.show(backend=BACKEND)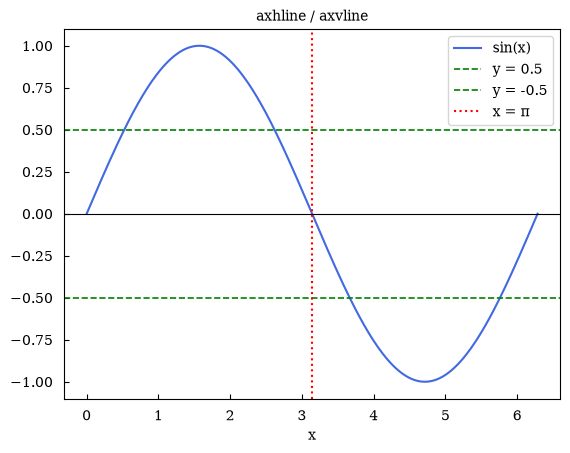
(<Figure size 640x480 with 1 Axes>, array([[<Axes: title={'center': 'axhline / axvline'}, xlabel='x'>]], dtype=object))7 Segment lines — hlines and vlines
Section titled “7 Segment lines — hlines and vlines”Draw multiple horizontal or vertical line segments with explicit start/end coordinates.
canvas = Canvas()canvas.plot(x, np.sin(x), color="lightgray", linewidth=1)
# Horizontal segments spanning half the x-rangecanvas.hlines(    y=[0.5, -0.5],    xmin=0,    xmax=np.pi,    colors="seagreen",    linestyles="dashed",    label="hlines at ±0.5",)
# Vertical segments at specific x positionscanvas.vlines(    x=[np.pi / 2, 3 * np.pi / 2],    ymin=-1,    ymax=1,    colors="tomato",    linestyles="dotted",    label="vlines at π/2, 3π/2",)
canvas.set_xlabel("x")canvas.set_title("hlines / vlines")canvas.set_legend(True)canvas.show(backend=BACKEND)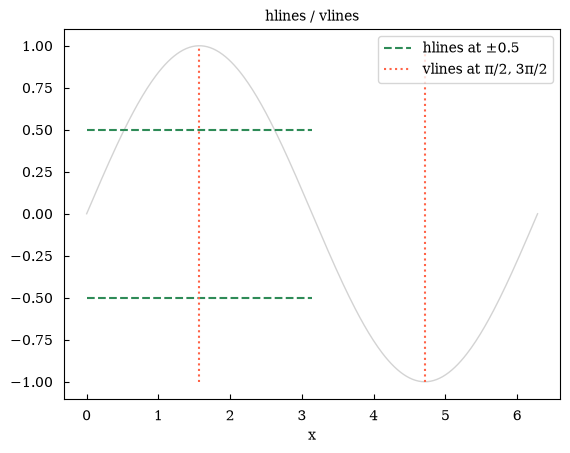
(<Figure size 640x480 with 1 Axes>, array([[<Axes: title={'center': 'hlines / vlines'}, xlabel='x'>]], dtype=object))8 Combining plot types
Section titled “8 Combining plot types”A single subplot can hold many plot types simultaneously. Here we overlay a line, a shaded uncertainty band, and scatter points.
t = np.linspace(0, 2 * np.pi, 300)signal = np.sin(t) * np.exp(-t / 8)noise = rng.normal(0, 0.08, len(t))band = 0.15 * np.exp(-t / 8)
# Sparse measurement pointstidx = np.arange(0, len(t), 20)tx, ty = t[tidx], (signal + noise)[tidx]
canvas = Canvas()
canvas.fill_between(    t, signal - band, signal + band, alpha=0.2, color="royalblue", label="uncertainty")canvas.plot(t, signal, color="royalblue", linewidth=2, label="model")canvas.scatter(tx, ty, color="tomato", s=25, marker="o", label="measurements")canvas.axhline(y=0, color="gray", linestyle="dashed", linewidth=0.8)
canvas.set_xlabel("time")canvas.set_ylabel("amplitude")canvas.set_title("Combined: line + fill_between + scatter")canvas.set_legend(True)canvas.set_grid(True)canvas.show(backend=BACKEND)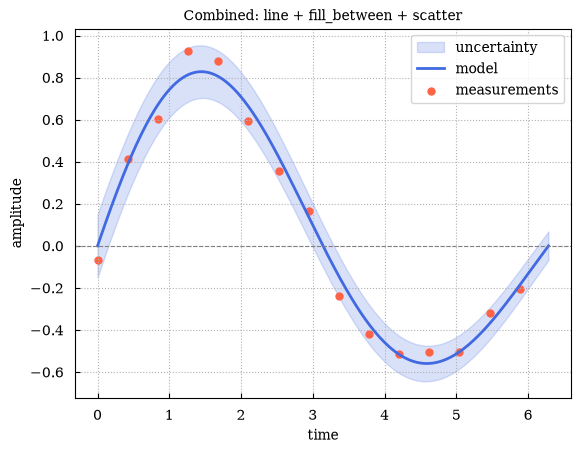
(<Figure size 640x480 with 1 Axes>, array([[<Axes: title={'center': 'Combined: line + fill_between + scatter'}, xlabel='time', ylabel='amplitude'>]], dtype=object))9 Annotations — ax.annotate() and ax.text()
Section titled “9 Annotations — ax.annotate() and ax.text()”canvas = Canvas()canvas.plot(x, np.sin(x), color="royalblue")
# Arrow annotation pointing to the peakcanvas.annotate( "peak", xy=(np.pi / 2, 1.0), xytext=(np.pi / 2 + 0.8, 0.7), arrowprops=dict(arrowstyle="->"),)
# Free-floating text labelcanvas.text(3 * np.pi / 2, 0.15, "zero\ncrossing", ha="center", fontsize=9)
canvas.set_xlabel("x")canvas.set_ylabel("sin(x)")canvas.set_title("Annotate and Text")canvas.show(backend=BACKEND)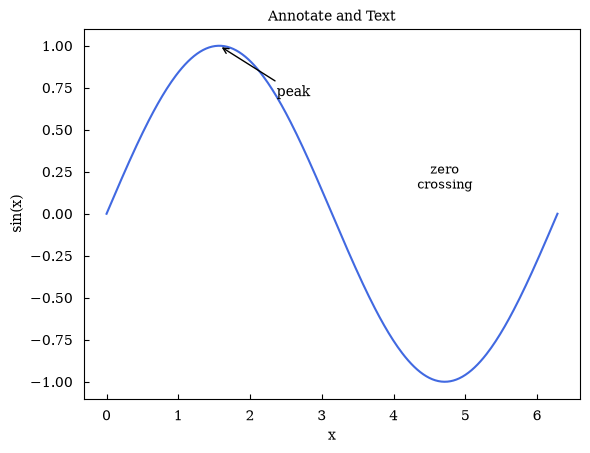
(<Figure size 640x480 with 1 Axes>, array([[<Axes: title={'center': 'Annotate and Text'}, xlabel='x', ylabel='sin(x)'>]], dtype=object))Summary
Section titled “Summary”| Plot type | Method | Key kwargs |
|---|---|---|
| Line | canvas.plot(x, y) | color, linestyle, linewidth, label |
| Scatter | ax.scatter(x, y) | c, s, marker, label |
| Bar | ax.bar(x, height) | color, width, label |
| Filled band | ax.fill_between(x, y1, y2) | alpha, color, label |
| Error bars | ax.errorbar(x, y, yerr=...) | fmt, capsize, label |
| Full-span h/v line | ax.axhline(y=...) / ax.axvline(x=...) | color, linestyle |
| Segment lines | ax.hlines(y, xmin, xmax) / ax.vlines(x, ymin, ymax) | colors, linestyles |
| Arrow annotation | ax.annotate(text, xy=..., xytext=..., arrowprops=...) | |
| Free text | ax.text(x, y, text) | ha, fontsize |
You now know the full set of plot types available in maxplotlib. 🎉