Axes and annotations
This tutorial covers every way to control the coordinate frame of a subplot: labels, limits, tick marks, log scales, grids, legends, and annotations.
import numpy as np
from maxplotlib import Canvas
Backend selection
Section titled “Backend selection”All examples in this tutorial use the same Canvas API; you can switch rendering backends at any time:
BACKEND = "matplotlib"for static Matplotlib outputBACKEND = "plotly"for interactive Plotly output (Jupyter-friendly)
Most cells end with canvas.show(backend=BACKEND) so you can re-run the whole notebook with a different backend.
# Change to "plotly" for interactive outputBACKEND = "matplotlib"1 · Labels and title
Section titled “1 · Labels and title”LaTeX strings are supported in all text arguments.
x = np.linspace(0, 2 * np.pi, 200)
canvas = Canvas(width="10cm", ratio=0.55)canvas.plot(x, np.sin(x), color="steelblue")
canvas.set_xlabel(r"$x$ (radians)")canvas.set_ylabel(r"$\sin(x)$")canvas.set_title(r"The sine function $f(x) = \sin(x)$")canvas.show(backend=BACKEND)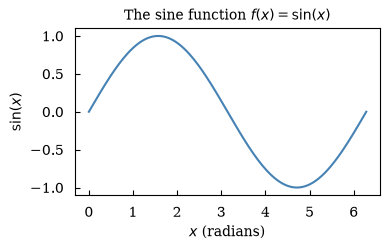
(<Figure size 393.701x216.535 with 1 Axes>, array([[<Axes: title={'center': 'The sine function $f(x) = \\sin(x)$'}, xlabel='$x$ (radians)', ylabel='$\\sin(x)$'>]], dtype=object))2 · Axis limits
Section titled “2 · Axis limits”x = np.linspace(0, 4 * np.pi, 300)
canvas = Canvas(width="10cm", ratio=0.5)canvas.plot(x, np.sin(x), color="tomato")
# Show only the first full periodcanvas.set_xlim(0, 2 * np.pi)canvas.set_ylim(-1.2, 1.2)
canvas.set_xlabel("x")canvas.set_ylabel(r"$\sin(x)$")canvas.set_title("Axis limits: first period only")canvas.show(backend=BACKEND)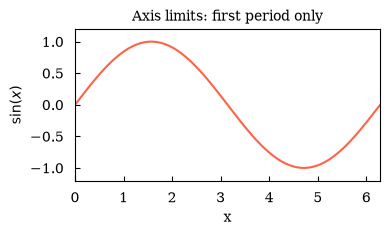
(<Figure size 393.701x196.85 with 1 Axes>, array([[<Axes: title={'center': 'Axis limits: first period only'}, xlabel='x', ylabel='$\\sin(x)$'>]], dtype=object))3 · Custom ticks
Section titled “3 · Custom ticks”Pass tick positions and optional labels to set_xticks.
months = [    "Jan",    "Feb",    "Mar",    "Apr",    "May",    "Jun",    "Jul",    "Aug",    "Sep",    "Oct",    "Nov",    "Dec",]temps = [3, 4, 7, 12, 17, 21, 23, 22, 18, 13, 7, 4]
canvas = Canvas(width="12cm", ratio=0.45)canvas.plot(range(12), temps, marker="o", color="steelblue", linewidth=2)
canvas.set_xticks(list(range(12)), labels=months)canvas.set_ylabel(r"Temperature ($^\circ$C)")canvas.set_title("Monthly average temperature")canvas.show(backend=BACKEND)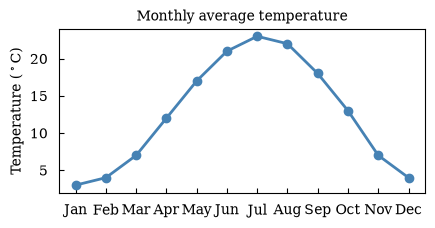
(<Figure size 472.441x212.598 with 1 Axes>, array([[<Axes: title={'center': 'Monthly average temperature'}, ylabel='Temperature ($^\\circ$C)'>]], dtype=object))4 · Log scale
Section titled “4 · Log scale”Use set_yscale('log') for data spanning several orders of magnitude. Compare linear and log in a 1×2 layout.
x = np.linspace(0.1, 5, 200)y = np.exp(2 * x)
canvas, (ax1, ax2) = Canvas.subplots(ncols=2, width="14cm", ratio=0.4)
ax1.plot(x, y, color="seagreen")ax1.set_xlabel("x")ax1.set_ylabel(r"$e^{2x}$")ax1.set_title("Linear scale")
ax2.plot(x, y, color="seagreen")ax2.set_xlabel("x")ax2.set_yscale("log")ax2.set_title("Log scale")
canvas.suptitle("Linear vs log scale")canvas.show(backend=BACKEND)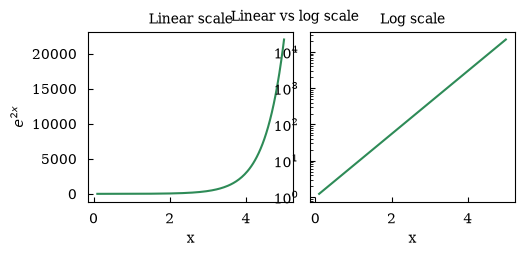
(<Figure size 551.181x220.472 with 2 Axes>, array([[<Axes: title={'center': 'Linear scale'}, xlabel='x', ylabel='$e^{2x}$'>, <Axes: title={'center': 'Log scale'}, xlabel='x'>]], dtype=object))5 · Grid
Section titled “5 · Grid”x = np.linspace(0, 2 * np.pi, 200)
canvas, (ax1, ax2) = Canvas.subplots(ncols=2, width="12cm", ratio=0.5)
ax1.plot(x, np.cos(x), color="steelblue")ax1.set_title("No grid")ax1.set_xlabel("x")
ax2.plot(x, np.cos(x), color="steelblue")ax2.set_grid(True)ax2.set_title("With grid")ax2.set_xlabel("x")
canvas.show(backend=BACKEND)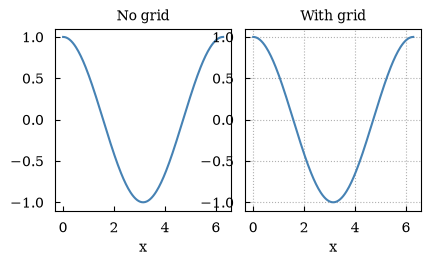
(<Figure size 472.441x236.22 with 2 Axes>, array([[<Axes: title={'center': 'No grid'}, xlabel='x'>, <Axes: title={'center': 'With grid'}, xlabel='x'>]], dtype=object))6 · Legend
Section titled “6 · Legend”Enable with set_legend(True). Labels come from label= kwargs.
x = np.linspace(0, 2 * np.pi, 200)
canvas = Canvas(width="10cm", ratio=0.55)canvas.plot(x, np.sin(x), color="steelblue", label=r"$\sin(x)$")canvas.plot(x, np.cos(x), color="tomato", label=r"$\cos(x)$")canvas.plot(x, np.sin(2 * x), color="seagreen", label=r"$\sin(2x)$", linestyle="dashed")
canvas.set_xlabel("x")canvas.set_legend(True)canvas.set_title("Legend demo")canvas.show(backend=BACKEND)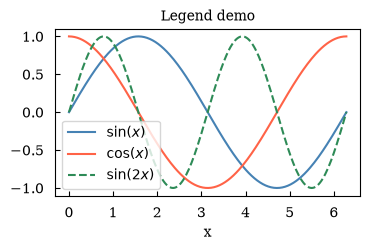
(<Figure size 393.701x216.535 with 1 Axes>, array([[<Axes: title={'center': 'Legend demo'}, xlabel='x'>]], dtype=object))7 · annotate
Section titled “7 · annotate”Draw an arrow from a text label to a data point.
x = np.linspace(0, 2 * np.pi, 200)y = np.sin(x)
canvas = Canvas(width="10cm", ratio=0.55)canvas.plot(x, y, color="steelblue")
# Annotate the maximumcanvas.annotate(    r"maximum $\approx 1$",    xy=(np.pi / 2, 1.0),    xytext=(np.pi / 2 + 1.0, 0.7),    arrowprops=dict(arrowstyle="->", color="black"),    fontsize=9,    color="darkred",)
canvas.set_xlabel("x")canvas.set_ylabel(r"$\sin(x)$")canvas.set_title("annotate demo")canvas.show(backend=BACKEND)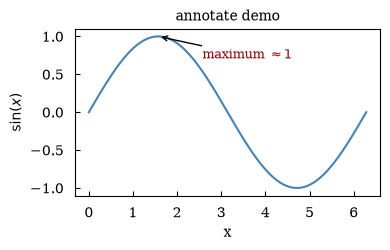
(<Figure size 393.701x216.535 with 1 Axes>, array([[<Axes: title={'center': 'annotate demo'}, xlabel='x', ylabel='$\\sin(x)$'>]], dtype=object))8 · text
Section titled “8 · text”Place a text label at arbitrary data coordinates.
x = np.linspace(-2, 2, 200)
canvas = Canvas(width="10cm", ratio=0.55)canvas.plot(x, x**2, color="darkorange")
canvas.text(    0, 3.2, r"$f(x) = x^2$", ha="center", va="bottom", fontsize=12, color="darkorange")
canvas.set_xlabel("x")canvas.set_ylabel(r"$f(x)$")canvas.set_title("text demo")canvas.show(backend=BACKEND)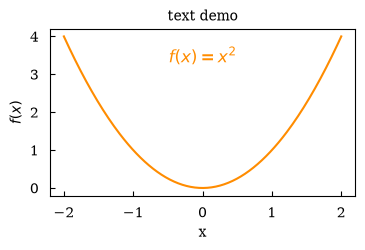
(<Figure size 393.701x216.535 with 1 Axes>, array([[<Axes: title={'center': 'text demo'}, xlabel='x', ylabel='$f(x)$'>]], dtype=object))9 · Aspect ratio
Section titled “9 · Aspect ratio”set_aspect('equal') ensures a circle looks circular.
theta = np.linspace(0, 2 * np.pi, 300)
canvas = Canvas(width="7cm", ratio=1.0)canvas.plot(np.cos(theta), np.sin(theta), color="steelblue", linewidth=2)canvas.set_aspect("equal")canvas.set_title("Circle with equal aspect ratio")canvas.set_xlabel("x")canvas.set_ylabel("y")canvas.show(backend=BACKEND)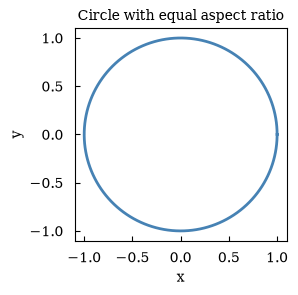
(<Figure size 275.591x275.591 with 1 Axes>, array([[<Axes: title={'center': 'Circle with equal aspect ratio'}, xlabel='x', ylabel='y'>]], dtype=object))Summary
Section titled “Summary”| Method | Purpose |
|---|---|
set_xlabel / set_ylabel | Axis labels (LaTeX OK) |
set_title | Subplot title |
set_xlim / set_ylim | Axis range |
set_xticks(pos, labels=) | Custom tick marks |
set_yscale('log') | Logarithmic scale |
set_grid(True) | Background grid |
set_legend(True) | Auto legend |
annotate(...) | Arrow annotation |
text(x, y, s) | Free text label |
set_aspect('equal') | Equal x/y scaling |