Gantt charts
This tutorial demonstrates how to create Gantt charts using maxplotlib across different backends.
Gantt charts are useful for visualizing project schedules, task timelines, and resource allocation.
from maxplotlib import CanvasBasic Gantt Chart
Section titled “Basic Gantt Chart”Let’s create a simple project timeline with 5 tasks.
# Define project taskstasks = ["Planning", "Design", "Development", "Testing", "Deployment"]start_times = [0, 5, 10, 25, 35]  # Days from project startdurations = [5, 5, 15, 10, 5]  # Duration in days
# Create canvas and add gantt chartcanvas = Canvas(nrows=1, ncols=1, figsize=(12, 6))canvas.gantt(    tasks=tasks,    start_times=start_times,    durations=durations,    color="skyblue",    edgecolor="navy",    alpha=0.8,)
canvas.set_xlabel("Time (days)")canvas.set_title("Project Timeline")canvas.render(backend="matplotlib")
(<Figure size 1200x600 with 1 Axes>, array([[<Axes: title={'center': 'Project Timeline'}, xlabel='Time (days)'>]], dtype=object))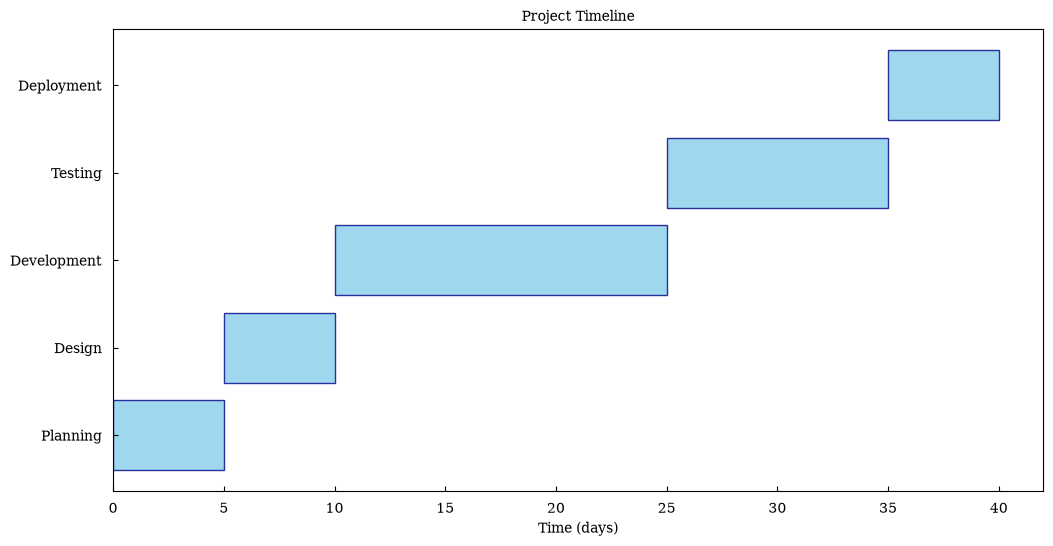
Multiple Project Phases
Section titled “Multiple Project Phases”Visualize different project phases with different colors using layers.
# Phase 1: Planning and Designphase1_tasks = ["Requirements", "Architecture", "UI Design"]phase1_starts = [0, 3, 6]phase1_durations = [3, 3, 4]
# Phase 2: Implementationphase2_tasks = ["Backend Dev", "Frontend Dev", "Integration"]phase2_starts = [10, 10, 20]phase2_durations = [10, 10, 5]
# Phase 3: Quality Assurancephase3_tasks = ["Unit Tests", "Integration Tests", "UAT"]phase3_starts = [25, 28, 32]phase3_durations = [3, 4, 3]
canvas = Canvas(nrows=1, ncols=1, figsize=(14, 8))
# Add each phase with different colorscanvas.gantt(    phase1_tasks,    phase1_starts,    phase1_durations,    color="lightblue",    edgecolor="blue",    label="Planning",)canvas.gantt(    phase2_tasks,    phase2_starts,    phase2_durations,    color="lightgreen",    edgecolor="green",    label="Development",)canvas.gantt(    phase3_tasks,    phase3_starts,    phase3_durations,    color="lightyellow",    edgecolor="orange",    label="Testing",)
canvas.set_xlabel("Time (days)")canvas.set_title("Multi-Phase Project Timeline")canvas.set_legend(True)canvas.render(backend="matplotlib")
(<Figure size 1400x800 with 1 Axes>, array([[<Axes: title={'center': 'Multi-Phase Project Timeline'}, xlabel='Time (days)'>]], dtype=object))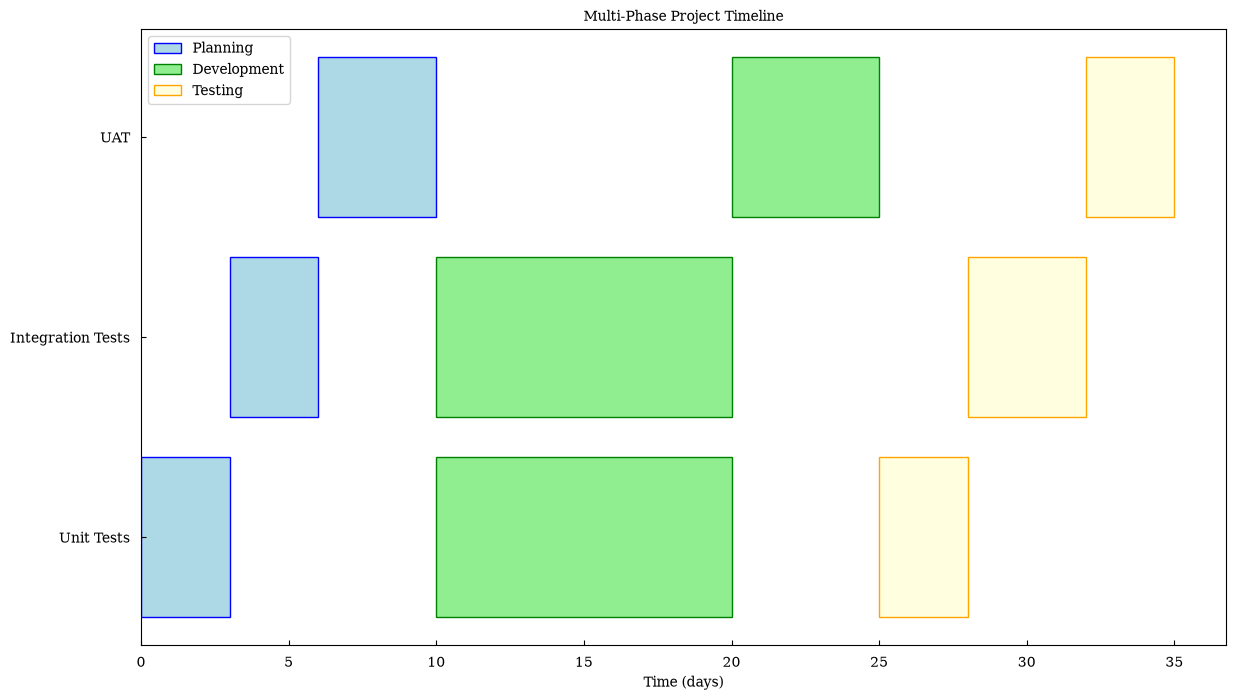
Resource Allocation
Section titled “Resource Allocation”Show how different team members are allocated across tasks.
# Team member assignmentsteam_members = ["Alice", "Bob", "Charlie", "Diana", "Eve"]task_starts = [0, 5, 3, 8, 10]task_durations = [8, 6, 10, 7, 5]
canvas = Canvas(nrows=1, ncols=1, figsize=(12, 6))canvas.gantt(    tasks=team_members,    start_times=task_starts,    durations=task_durations,    color="coral",    edgecolor="darkred",    alpha=0.7,)
canvas.set_xlabel("Week")canvas.set_title("Team Resource Allocation")canvas.render(backend="matplotlib")
(<Figure size 1200x600 with 1 Axes>, array([[<Axes: title={'center': 'Team Resource Allocation'}, xlabel='Week'>]], dtype=object))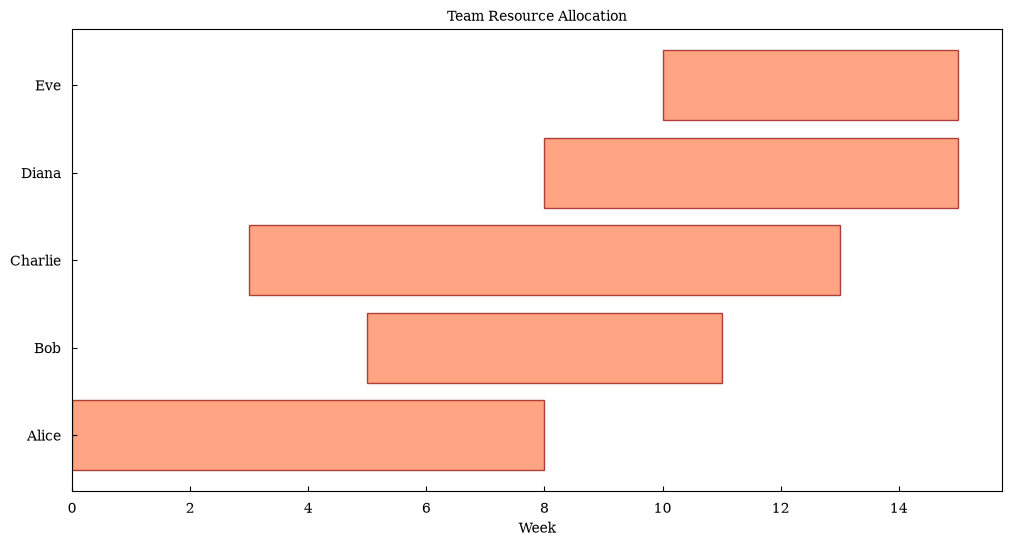
Interactive Gantt Chart with Plotly
Section titled “Interactive Gantt Chart with Plotly”Create an interactive version that allows zooming and hovering.
tasks = ["Research", "Prototype", "Development", "Testing", "Launch"]start_times = [0, 10, 20, 40, 50]durations = [10, 10, 20, 10, 5]
canvas = Canvas(nrows=1, ncols=1, figsize=(12, 6))canvas.gantt(    tasks=tasks,    start_times=start_times,    durations=durations,    color="steelblue",    alpha=0.8,)
canvas.set_xlabel("Days")canvas.set_title("Interactive Project Timeline")fig = canvas.render(backend="plotly")fig.show()
Milestones and Dependencies
Section titled “Milestones and Dependencies”Visualize project milestones (zero-duration tasks) alongside regular tasks.
# Regular taskstasks = ["Phase 1", "Milestone: Review", "Phase 2", "Milestone: Demo", "Phase 3"]start_times = [0, 10, 10, 25, 25]durations = [10, 0, 15, 0, 10]  # Milestones have zero duration
canvas = Canvas(nrows=1, ncols=1, figsize=(12, 6))canvas.gantt(    tasks=tasks,    start_times=start_times,    durations=durations,    color="lightseagreen",    edgecolor="teal",)
canvas.set_xlabel("Days")canvas.set_title("Project with Milestones")canvas.render(backend="matplotlib")
(<Figure size 1200x600 with 1 Axes>, array([[<Axes: title={'center': 'Project with Milestones'}, xlabel='Days'>]], dtype=object))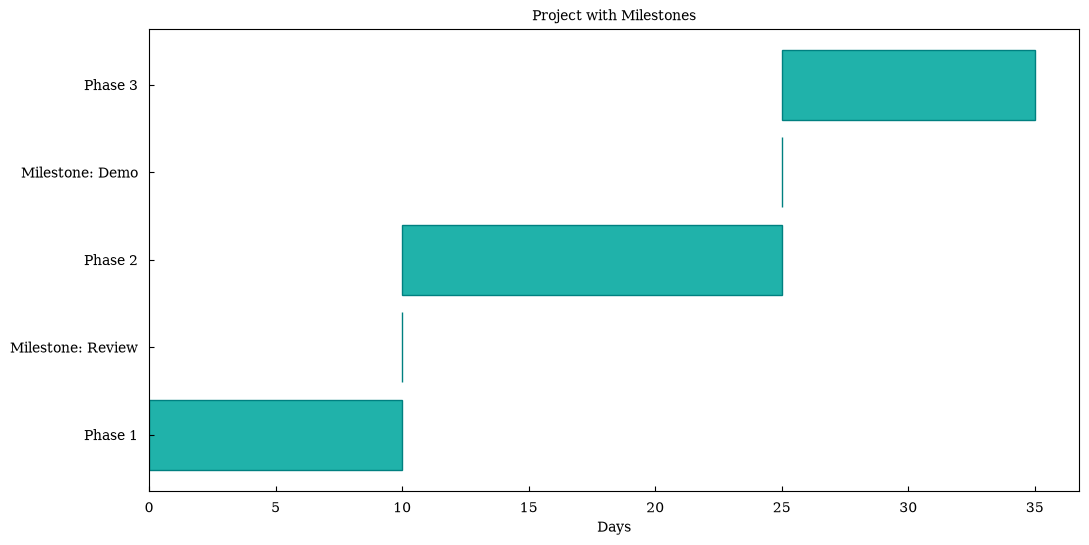
Comparison: Different Backends
Section titled “Comparison: Different Backends”The same Gantt chart rendered with different backends.
tasks = ["Task A", "Task B", "Task C", "Task D"]start_times = [0, 5, 8, 12]durations = [5, 6, 8, 4]
# Matplotlibcanvas_mpl = Canvas(nrows=1, ncols=1, figsize=(10, 5))canvas_mpl.gantt(tasks, start_times, durations, color="skyblue")canvas_mpl.set_title("Matplotlib Backend")canvas_mpl.render(backend="matplotlib")
# Plotlycanvas_plotly = Canvas(nrows=1, ncols=1, figsize=(10, 5))canvas_plotly.gantt(tasks, start_times, durations, color="skyblue")canvas_plotly.set_title("Plotly Backend")fig = canvas_plotly.render(backend="plotly")fig.show()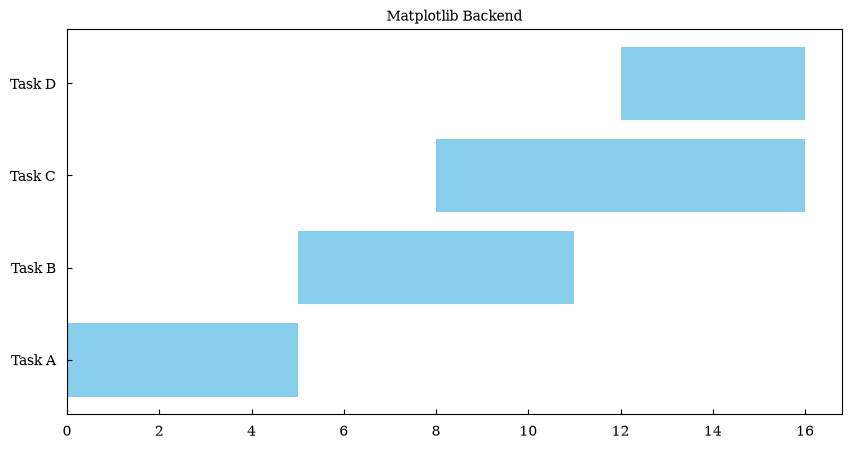
Summary
Section titled “Summary”Gantt charts in maxplotlib support:
- Simple task timelines
- Multiple phases with different colors
- Resource allocation visualization
- Milestones (zero-duration tasks)
- All backends: matplotlib, plotly, plotext, tikzfigure
- Customizable colors, transparency, and edge colors