Styling
maxplotlib passes matplotlib kwargs directly to the underlying renderer, so every colour, linestyle, marker, and alpha option you know from matplotlib works here too.
import numpy as np
from maxplotlib import Canvas
Backend selection
Section titled “Backend selection”All examples in this tutorial use the same Canvas API; you can switch rendering backends at any time:
BACKEND = "matplotlib"for static Matplotlib outputBACKEND = "plotly"for interactive Plotly output (Jupyter-friendly)
Most cells end with canvas.show(backend=BACKEND) so you can re-run the whole notebook with a different backend.
# Change to "plotly" for interactive outputBACKEND = "matplotlib"1 · Colors
Section titled “1 · Colors”Named colors, hex strings, and RGB tuples are all accepted.
x = np.linspace(0, 2 * np.pi, 200)
canvas = Canvas(width="10cm", ratio=0.6)
canvas.plot(x, np.sin(x), color="steelblue", label="named: steelblue")canvas.plot(x, np.sin(x - 0.5), color="#e74c3c", label="hex: #e74c3c")canvas.plot(x, np.sin(x - 1.0), color=(0.2, 0.7, 0.3), label="RGB tuple")
canvas.set_xlabel("x")canvas.set_ylabel("y")canvas.set_title("Color options")canvas.set_legend(True)canvas.show(backend=BACKEND)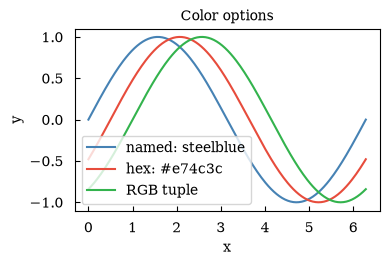
(<Figure size 393.701x236.22 with 1 Axes>, array([[<Axes: title={'center': 'Color options'}, xlabel='x', ylabel='y'>]], dtype=object))2 · Linestyles
Section titled “2 · Linestyles”Use long names ('solid', 'dashed', 'dotted', 'dashdot') or short aliases ('-', '--', ':', '-.').
x = np.linspace(0, 4 * np.pi, 300)styles = [("solid", "-"), ("dashed", "--"), ("dotted", ":"), ("dashdot", "-.")]
canvas = Canvas(width="10cm", ratio=0.6)
for i, (name, ls) in enumerate(styles):    canvas.plot(        x,        np.sin(x) + i * 0.4,        linestyle=ls,        linewidth=2,        color="steelblue",        label=f"{name!r} / {ls!r}",    )
canvas.set_xlabel("x")canvas.set_title("Linestyle comparison")canvas.set_legend(True)canvas.show(backend=BACKEND)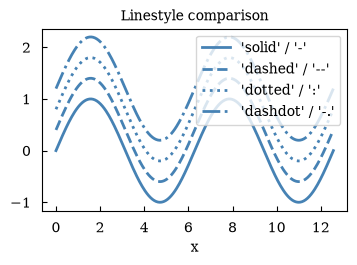
(<Figure size 393.701x236.22 with 1 Axes>, array([[<Axes: title={'center': 'Linestyle comparison'}, xlabel='x'>]], dtype=object))3 · Markers
Section titled “3 · Markers”Pass marker= to ax.plot or ax.scatter.
x = np.linspace(0, 2 * np.pi, 10)markers = ["o", "s", "^", "D", "*", "x", "+"]
canvas = Canvas(width="10cm", ratio=0.65)
for i, m in enumerate(markers):    canvas.plot(        x,        np.sin(x) + i * 0.5,        marker=m,        linestyle="-",        markersize=7,        label=f"marker={m!r}",    )
canvas.set_xlabel("x")canvas.set_title("Marker comparison")canvas.set_legend(True)canvas.show(backend=BACKEND)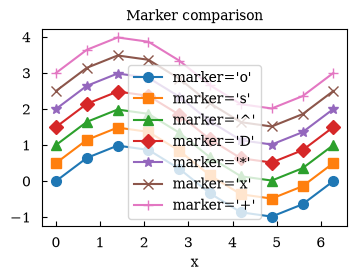
(<Figure size 393.701x255.906 with 1 Axes>, array([[<Axes: title={'center': 'Marker comparison'}, xlabel='x'>]], dtype=object))4 · Linewidth and markersize
Section titled “4 · Linewidth and markersize”Control visual weight with linewidth= and markersize=.
x = np.linspace(0, 2 * np.pi, 40)
canvas = Canvas(width="10cm", ratio=0.55)
canvas.plot(x, np.sin(x), linewidth=0.8, marker="o", markersize=3, label="thin / small")canvas.plot(x, np.sin(x) - 0.6, linewidth=2.5, marker="o", markersize=7, label="medium")canvas.plot(    x, np.sin(x) - 1.2, linewidth=4.5, marker="o", markersize=12, label="thick / large")
canvas.set_xlabel("x")canvas.set_title("Linewidth and markersize")canvas.set_legend(True)canvas.show(backend=BACKEND)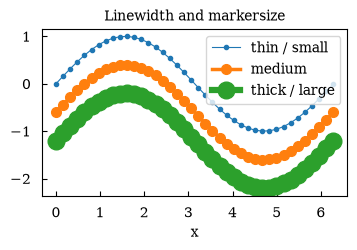
(<Figure size 393.701x216.535 with 1 Axes>, array([[<Axes: title={'center': 'Linewidth and markersize'}, xlabel='x'>]], dtype=object))5 · Alpha (transparency)
Section titled “5 · Alpha (transparency)”alpha= ranges from 0 (invisible) to 1 (opaque). Useful for overlapping fill_between regions.
x = np.linspace(0, 2 * np.pi, 200)
canvas = Canvas(width="10cm", ratio=0.55)
canvas.fill_between(x, np.sin(x), 0, alpha=0.7, color="steelblue", label="alpha=0.7")canvas.fill_between(x, np.sin(2 * x), 0, alpha=0.4, color="tomato", label="alpha=0.4")canvas.fill_between(x, np.sin(3 * x), 0, alpha=0.2, color="seagreen", label="alpha=0.2")
canvas.set_xlabel("x")canvas.set_title("Alpha transparency")canvas.set_legend(True)canvas.show(backend=BACKEND)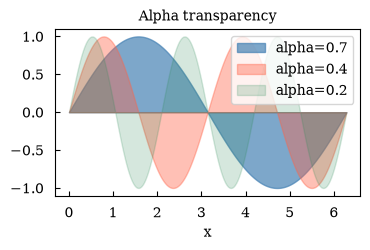
(<Figure size 393.701x216.535 with 1 Axes>, array([[<Axes: title={'center': 'Alpha transparency'}, xlabel='x'>]], dtype=object))6 · Combining styles – a publication-ready plot
Section titled “6 · Combining styles – a publication-ready plot”Combine color, linestyle, marker, linewidth, and alpha in one plot.
x = np.linspace(0, 2 * np.pi, 80)noise = np.random.default_rng(0).normal(0, 0.05, len(x))
canvas = Canvas(width="10cm", ratio=0.6)
# Shaded uncertainty bandcanvas.fill_between(    x, np.sin(x) - 0.15, np.sin(x) + 0.15, alpha=0.15, color="steelblue")
# Noisy datacanvas.scatter(    x, np.sin(x) + noise, color="steelblue", marker="o", s=18, alpha=0.6, label="data")
# Clean modelcanvas.plot(    x,    np.sin(x),    color="#e74c3c",    linestyle="dashed",    linewidth=2.0,    alpha=0.9,    label="model",)
canvas.set_xlabel("x")canvas.set_ylabel("y")canvas.set_title("Publication-style plot")canvas.set_legend(True)canvas.show(backend=BACKEND)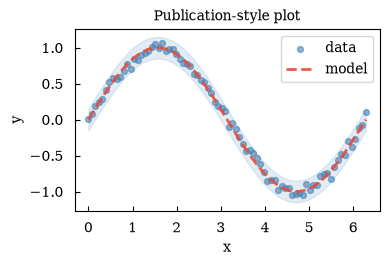
(<Figure size 393.701x236.22 with 1 Axes>, array([[<Axes: title={'center': 'Publication-style plot'}, xlabel='x', ylabel='y'>]], dtype=object))Summary
Section titled “Summary”| Option | Example |
|---|---|
| Named color | color='steelblue' |
| Hex color | color='#e74c3c' |
| RGB tuple | color=(0.2, 0.7, 0.3) |
| Linestyle | linestyle='dashed' or '--' |
| Marker | marker='o' |
| Linewidth | linewidth=2.0 |
| Markersize | markersize=7 |
| Transparency | alpha=0.5 |