Axis and layout
This tutorial demonstrates the latest Matplotlib-style wrappers: filled polygons, logarithmic shortcuts, axis limits and autoscaling, secondary axes, box aspect, and explicit tick labels.
import numpy as np
from maxplotlib import Canvas
x = np.linspace(0.1, 10, 200)
Filled polygons
Section titled “Filled polygons”fill() forwards polygon coordinates to Matplotlib and becomes a filled Plotly scatter trace.
canvas = Canvas()canvas.fill([0, 1, 2, 1], [0, 2, 0, -1], color="tab:orange", alpha=0.5)canvas.set_title("A filled polygon")canvas.show()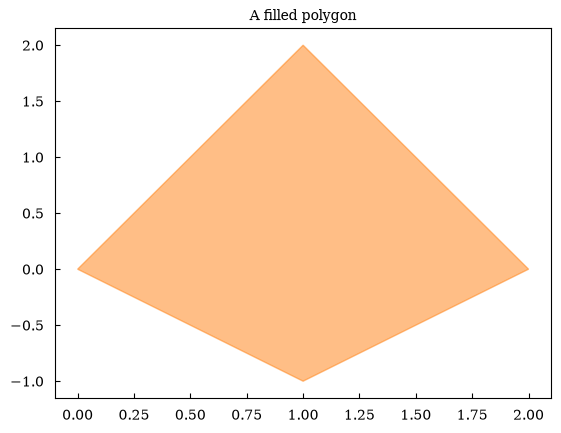
(<Figure size 640x480 with 1 Axes>, array([[<Axes: title={'center': 'A filled polygon'}>]], dtype=object))Logarithmic plotting shortcuts
Section titled “Logarithmic plotting shortcuts”Use semilogx(), semilogy(), or loglog() when the data and axis scale should be configured together. The three-panel example below shows the optional fig/axs style for users familiar with Matplotlib; ordinary one-panel examples use Canvas directly.
canvas, (ax1, ax2, ax3) = Canvas.subplots(nrows=1, ncols=3)ax1.semilogx(x, np.sin(x) + 2)ax2.semilogy(x, np.exp(x / 4))ax3.loglog(x, x**2)ax1.set_title("semilogx")ax2.set_title("semilogy")ax3.set_title("loglog")canvas.show()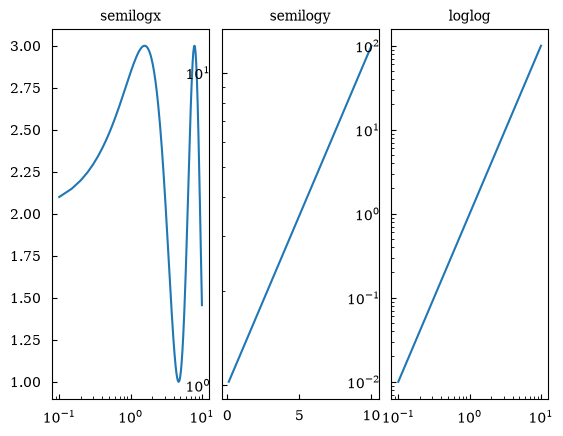
(<Figure size 640x480 with 3 Axes>, array([[<Axes: title={'center': 'semilogx'}>, <Axes: title={'center': 'semilogy'}>, <Axes: title={'center': 'loglog'}>]], dtype=object))Axis limits, modes, and autoscaling
Section titled “Axis limits, modes, and autoscaling”axis() accepts Matplotlib-style modes such as "equal", "tight", and "off", or a four-value [xmin, xmax, ymin, ymax] limit list. relim() and autoscale_view() recompute the visible limits from plotted data.
canvas = Canvas()canvas.plot([0, 1, 2], [0, 4, 1])canvas.axis([0, 2, -1, 5])canvas.relim()canvas.autoscale_view(tight=True)canvas.show()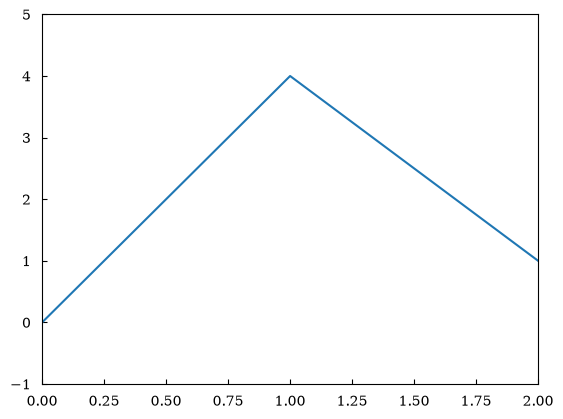
(<Figure size 640x480 with 1 Axes>, array([[<Axes: >]], dtype=object))Secondary x- and y-axes
Section titled “Secondary x- and y-axes”Secondary axes use forward and inverse functions. They are currently rendered by the Matplotlib backend.
canvas = Canvas()canvas.plot(x, x**2)canvas.set_xlabel("distance (m)")canvas.set_ylabel("area (m²)")canvas.secondary_xaxis( "top", functions=(lambda value: value / 1000, lambda value: value * 1000), label="distance (km)",)canvas.secondary_yaxis( "right", # the margin below 0 of the area axis has no length functions=(lambda value: np.sqrt(np.clip(value, 0, None)), lambda value: value**2), label="length (m)",)canvas.show()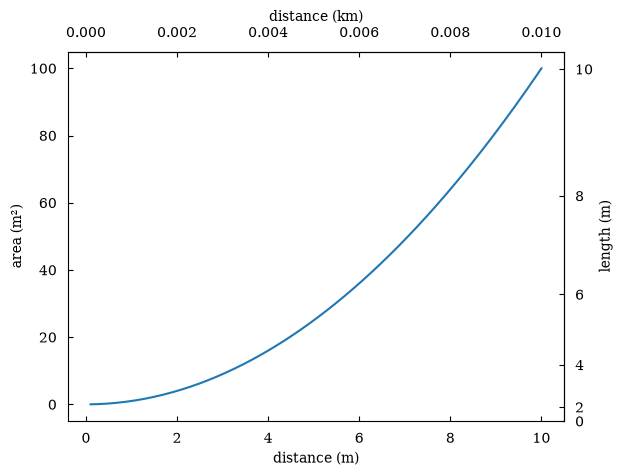
(<Figure size 640x480 with 1 Axes>, array([[<Axes: xlabel='distance (m)', ylabel='area (m²)'>]], dtype=object))Box aspect and explicit tick labels
Section titled “Box aspect and explicit tick labels”canvas = Canvas()canvas.plot([0, 1, 2], [0, 1, 0], marker="o")canvas.set_box_aspect(1)canvas.set_xticks([0, 1, 2])canvas.set_xticklabels(["start", "middle", "end"], rotation=25, color="navy")canvas.set_yticks([0, 1])canvas.set_yticklabels(["low", "high"], fontweight="bold")canvas.show()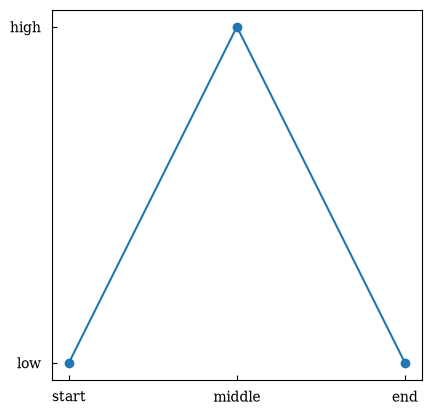
(<Figure size 640x480 with 1 Axes>, array([[<Axes: >]], dtype=object))Plotly rendering
Section titled “Plotly rendering”The filled polygon, logarithmic scales, axis modes, box aspect, and tick labels also work with Plotly. Secondary axes currently require Matplotlib.
plotly_canvas = Canvas()plotly_canvas.fill(x, np.sin(x) + 2, color="purple", alpha=0.25)plotly_canvas.loglog(x, x**2, color="black")plotly_canvas.set_xticklabels(["small", "medium", "large"], color="darkgreen")plotly_canvas.show(backend="plotly")