Flame charts
This tutorial demonstrates how to create flame charts using maxplotlib across different backends.
Flame charts are powerful visualizations for hierarchical profiling data, showing function call stacks and their execution times or sample counts.
from maxplotlib import CanvasBasic Flame Chart
Section titled “Basic Flame Chart”Let’s create a simple flame chart showing a function call hierarchy.
# Define function call hierarchylabels = [    "main()",  # 0 - root    "process_data()",  # 1 - child of main    "load_file()",  # 2 - child of process_data    "parse_json()",  # 3 - child of process_data    "validate()",  # 4 - child of process_data]
# Parent indices (None for root, index for parent)parents = [None, 0, 1, 1, 1]
# Duration or sample count for each functionvalues = [100, 60, 15, 20, 25]
# Start times (when each function begins)start_times = [0, 0, 0, 15, 35]
# Create canvas and add flame chartcanvas = Canvas(nrows=1, ncols=1, figsize=(12, 6))canvas.flame_chart(    labels=labels,    parents=parents,    values=values,    start_times=start_times,    colormap="viridis",    edgecolor="black",)
canvas.set_xlabel("Time (ms)")canvas.set_ylabel("Stack Depth")canvas.set_title("Function Call Hierarchy")canvas.render(backend="matplotlib")
(<Figure size 1200x600 with 1 Axes>, array([[<Axes: title={'center': 'Function Call Hierarchy'}, xlabel='Time (ms)', ylabel='Stack Depth'>]], dtype=object))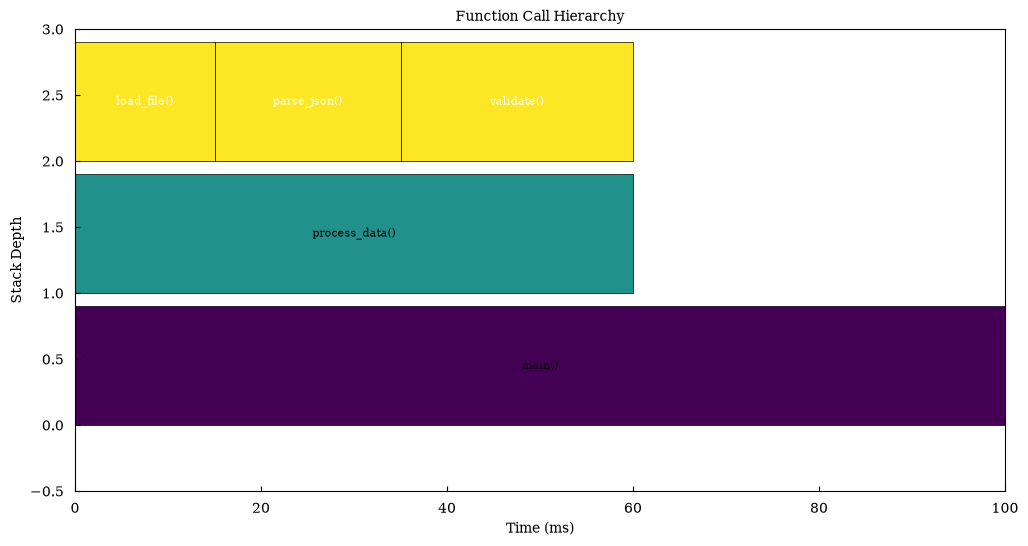
Complex Call Stack
Section titled “Complex Call Stack”Visualize a more complex profiling scenario with multiple levels.
# More complex hierarchylabels = [    "main()",    "init()",    "setup_db()",    "connect()",    "authenticate()",    "process()",    "fetch_data()",    "query_db()",    "transform()",    "map()",    "reduce()",    "cleanup()",]
parents = [    None,  # main    0,  # init -> main    1,  # setup_db -> init    2,  # connect -> setup_db    2,  # authenticate -> setup_db    0,  # process -> main    5,  # fetch_data -> process    6,  # query_db -> fetch_data    5,  # transform -> process    8,  # map -> transform    8,  # reduce -> transform    0,  # cleanup -> main]
values = [200, 40, 30, 15, 15, 120, 50, 40, 70, 35, 35, 20]start_times = [0, 0, 0, 0, 15, 40, 40, 40, 90, 90, 125, 180]
canvas = Canvas(nrows=1, ncols=1, figsize=(14, 8))canvas.flame_chart(    labels=labels,    parents=parents,    values=values,    start_times=start_times,    colormap="plasma",    edgecolor="black",)
canvas.set_xlabel("Time (ms)")canvas.set_ylabel("Stack Depth")canvas.set_title("Complex Application Profiling")canvas.render(backend="matplotlib")
(<Figure size 1400x800 with 1 Axes>, array([[<Axes: title={'center': 'Complex Application Profiling'}, xlabel='Time (ms)', ylabel='Stack Depth'>]], dtype=object))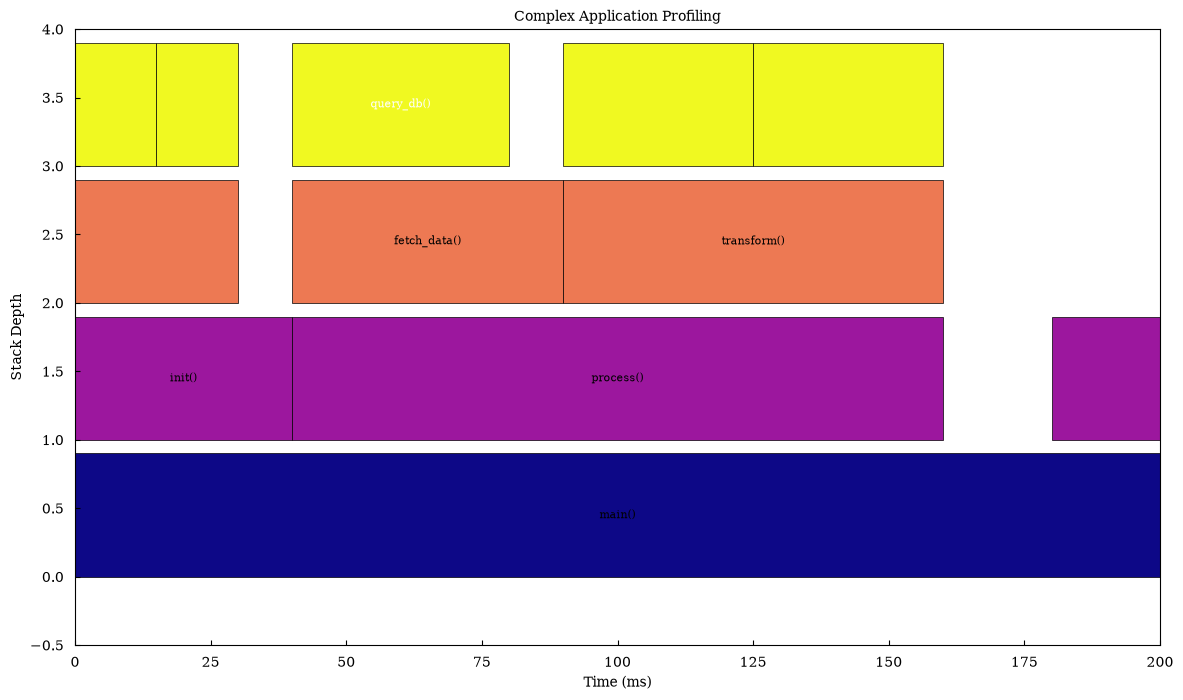
CPU Profiling Simulation
Section titled “CPU Profiling Simulation”Simulate CPU profiling data with multiple parallel execution paths.
# Simulate CPU profiling with parallel taskslabels = [    "app_main",    "worker_1",    "compute_heavy",    "math_ops",    "worker_2",    "io_bound",    "read_file",    "worker_3",    "network_call",    "http_request",]
parents = [None, 0, 1, 2, 0, 4, 5, 0, 7, 8]values = [150, 50, 40, 30, 45, 35, 25, 55, 45, 35]start_times = [0, 0, 0, 5, 50, 50, 55, 95, 95, 100]
canvas = Canvas(nrows=1, ncols=1, figsize=(12, 6))canvas.flame_chart(    labels=labels,    parents=parents,    values=values,    start_times=start_times,    colormap="inferno",    edgecolor="darkred",)
canvas.set_xlabel("Time (ms)")canvas.set_ylabel("Call Stack Depth")canvas.set_title("CPU Profiling: Parallel Workers")canvas.render(backend="matplotlib")
(<Figure size 1200x600 with 1 Axes>, array([[<Axes: title={'center': 'CPU Profiling: Parallel Workers'}, xlabel='Time (ms)', ylabel='Call Stack Depth'>]], dtype=object))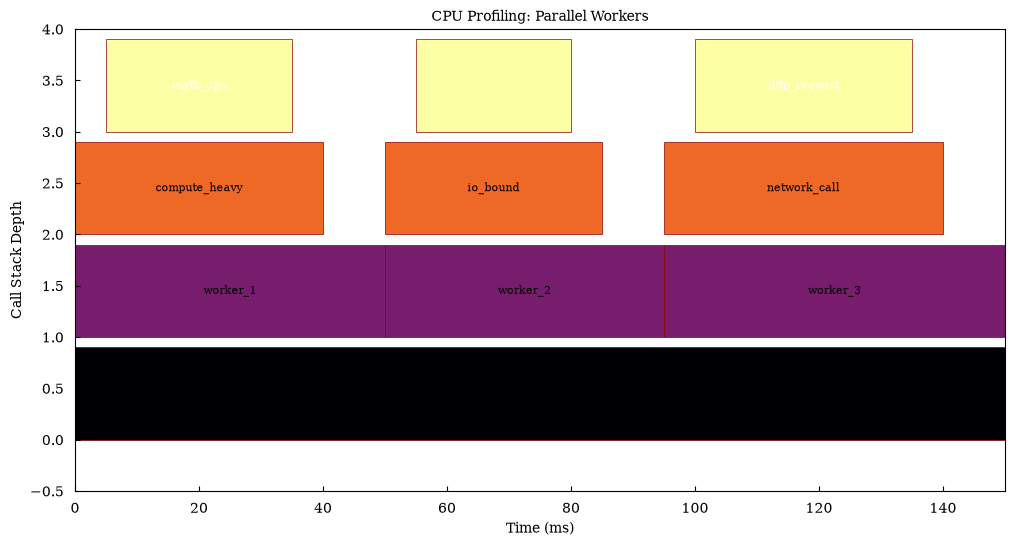
Interactive Flame Chart with Plotly
Section titled “Interactive Flame Chart with Plotly”Create an interactive version for detailed exploration.
labels = [    "main()",    "process_data()",    "load_file()",    "parse_json()",    "validate()",    "compute()",    "algorithm_a()",    "algorithm_b()",    "save_results()",]
parents = [None, 0, 1, 1, 1, 0, 5, 5, 0]values = [100, 40, 10, 15, 15, 50, 25, 25, 10]start_times = [0, 0, 0, 10, 25, 40, 40, 65, 90]
canvas = Canvas(nrows=1, ncols=1, figsize=(12, 6))canvas.flame_chart(    labels=labels,    parents=parents,    values=values,    start_times=start_times,    colormap="Viridis",    edgecolor="black",)
canvas.set_xlabel("Time (ms)")canvas.set_ylabel("Stack Depth")canvas.set_title("Interactive Flame Chart - Hover for Details")fig = canvas.render(backend="plotly")fig.show()
Auto-computed Start Times
Section titled “Auto-computed Start Times”Let maxplotlib compute start times automatically from the hierarchy.
# When start_times=None, they are computed automaticallylabels = ["root", "child1", "child2", "grandchild1", "grandchild2"]parents = [None, 0, 0, 1, 1]values = [100, 50, 50, 25, 25]
canvas = Canvas(nrows=1, ncols=1, figsize=(10, 5))canvas.flame_chart(    labels=labels,    parents=parents,    values=values,    start_times=None,  # Auto-computed    colormap="coolwarm",)
canvas.set_xlabel("Relative Time")canvas.set_ylabel("Depth")canvas.set_title("Flame Chart with Auto-computed Start Times")canvas.render(backend="matplotlib")
(<Figure size 1000x500 with 1 Axes>, array([[<Axes: title={'center': 'Flame Chart with Auto-computed Start Times'}, xlabel='Relative Time', ylabel='Depth'>]], dtype=object))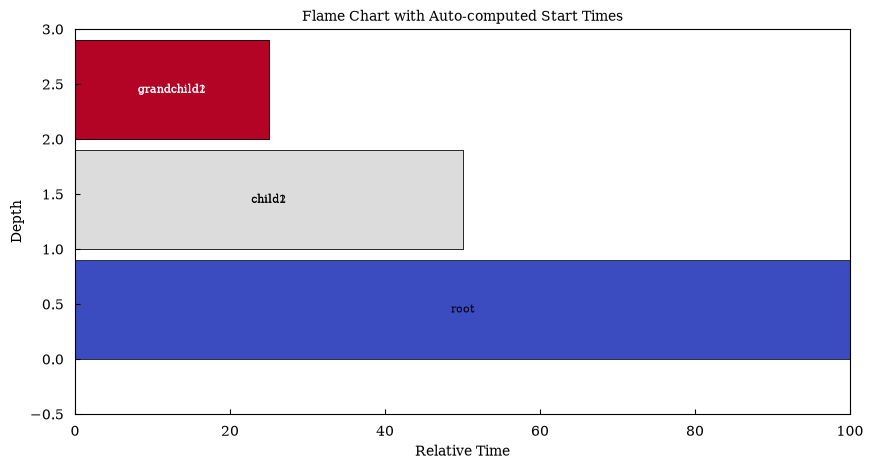
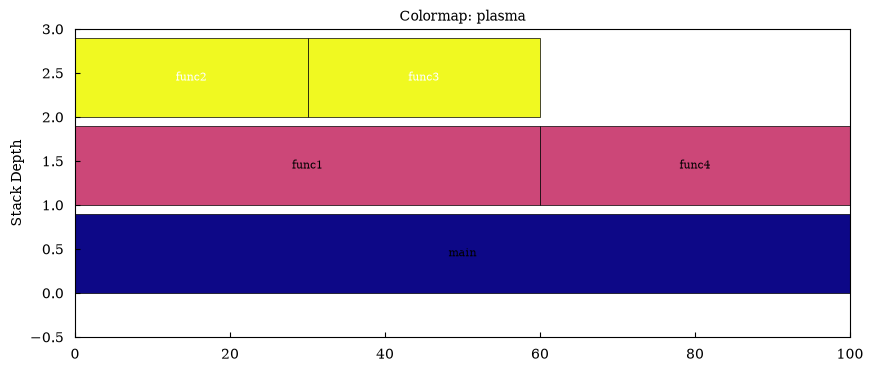
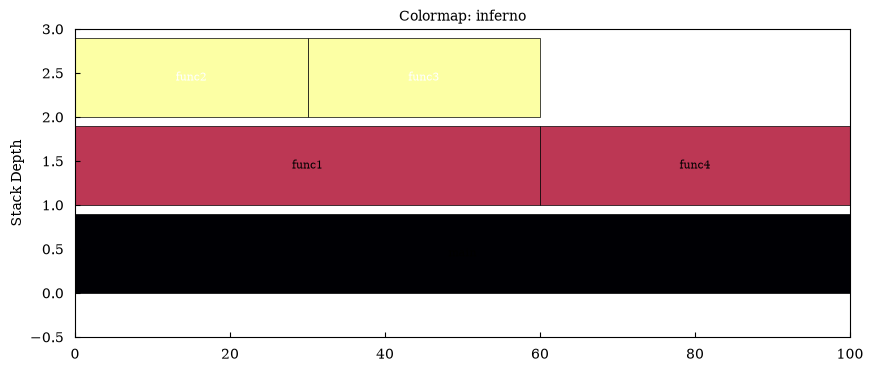
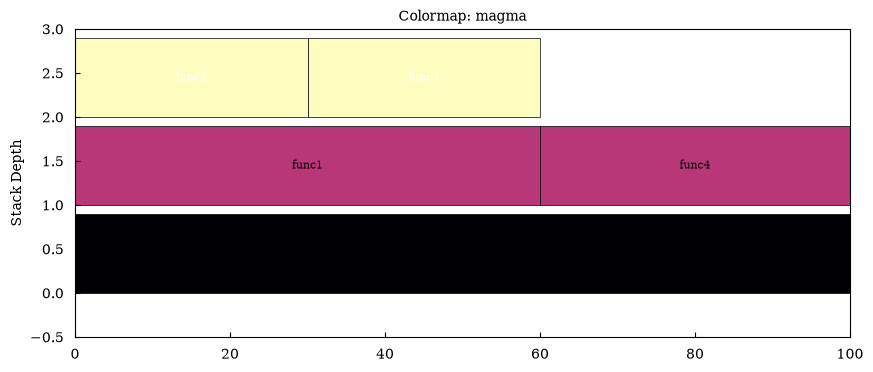
Comparison: Different Colormaps
Section titled “Comparison: Different Colormaps”Explore different colormap options for flame charts.
labels = ["main", "func1", "func2", "func3", "func4"]parents = [None, 0, 1, 1, 0]values = [100, 60, 30, 30, 40]start_times = [0, 0, 0, 30, 60]
colormaps = ["viridis", "plasma", "inferno", "magma"]
for cmap in colormaps:    canvas = Canvas(nrows=1, ncols=1, figsize=(10, 4))    canvas.flame_chart(        labels=labels,        parents=parents,        values=values,        start_times=start_times,        colormap=cmap,        edgecolor="black",    )    canvas.set_title(f"Colormap: {cmap}")    canvas.render(backend="matplotlib")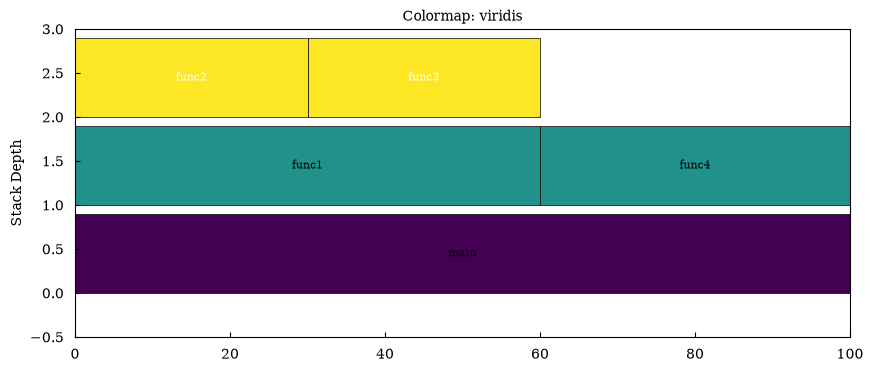
Real-world Example: Web Request Processing
Section titled “Real-world Example: Web Request Processing”Visualize the processing of a web request through various layers.
labels = [    "handle_request",    "authenticate",    "check_token",    "verify_signature",    "route_handler",    "validate_input",    "business_logic",    "db_query",    "cache_check",    "serialize_response",    "json_encode",    "send_response",]
parents = [None, 0, 1, 2, 0, 4, 4, 6, 6, 0, 9, 0]values = [200, 30, 20, 15, 140, 15, 100, 50, 30, 20, 15, 10]start_times = [0, 0, 5, 10, 30, 30, 45, 45, 95, 170, 170, 190]
canvas = Canvas(nrows=1, ncols=1, figsize=(14, 7))canvas.flame_chart(    labels=labels,    parents=parents,    values=values,    start_times=start_times,    colormap="RdYlGn_r",    edgecolor="black",)
canvas.set_xlabel("Time (ms)")canvas.set_ylabel("Call Stack")canvas.set_title("Web Request Processing Profile")canvas.render(backend="matplotlib")
(<Figure size 1400x700 with 1 Axes>, array([[<Axes: title={'center': 'Web Request Processing Profile'}, xlabel='Time (ms)', ylabel='Call Stack'>]], dtype=object))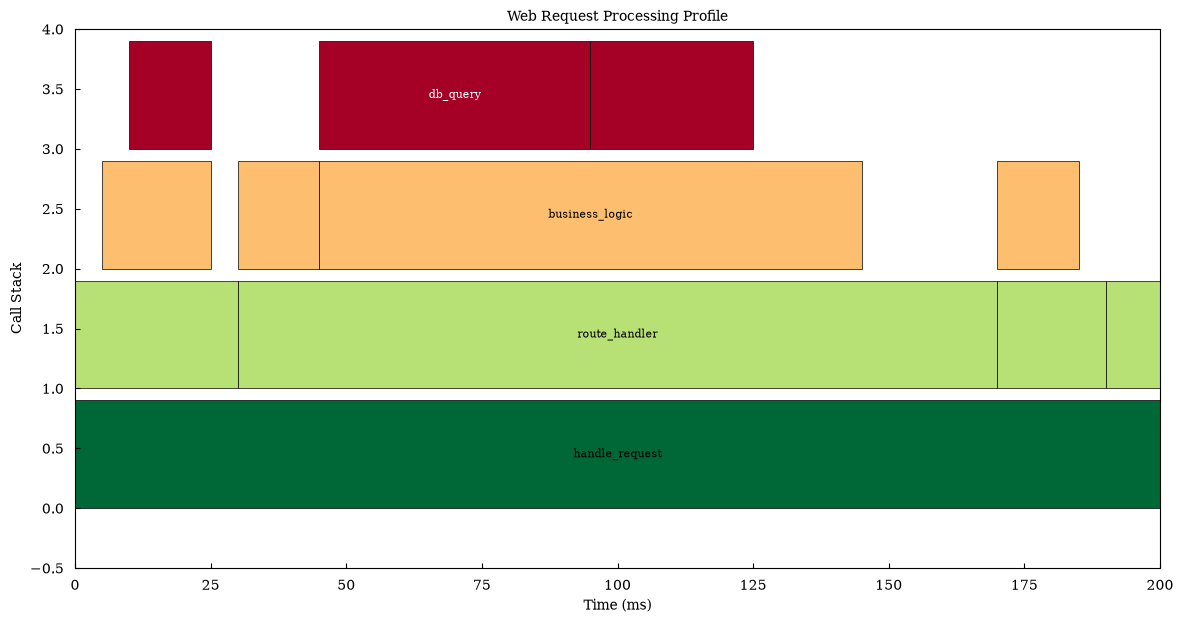
Summary
Section titled “Summary”Flame charts in maxplotlib support:
- Hierarchical profiling data visualization
- Automatic depth calculation from parent relationships
- Optional auto-computed start times
- Multiple colormap options
- All backends: matplotlib, plotly, plotext, tikzfigure
- Interactive exploration with plotly backend
- Customizable colors and edge styling
Perfect for:
- CPU profiling analysis
- Function call stack visualization
- Performance bottleneck identification
- Execution time analysis