Weightings and grid noise
Deposit the same markers with nearest-grid-point, linear and quadratic weights, the first one written here in NumPy.
Field.scatter and Field.gather take a Weighting: a deposit and its gather for each
number of dimensions. LINEAR (cloud-in-cell) and QUADRATIC (the quadratic B-spline) are
built in; the nearest-grid-point weighting below is a pair of NumPy functions with the
arguments of the kernel convention in mpifield.weighting. A compiled one is a kernel folder
with Pyccel, NumPy and CUDA versions, loaded with cunumpy.kernels.Kernel.from_folder, as
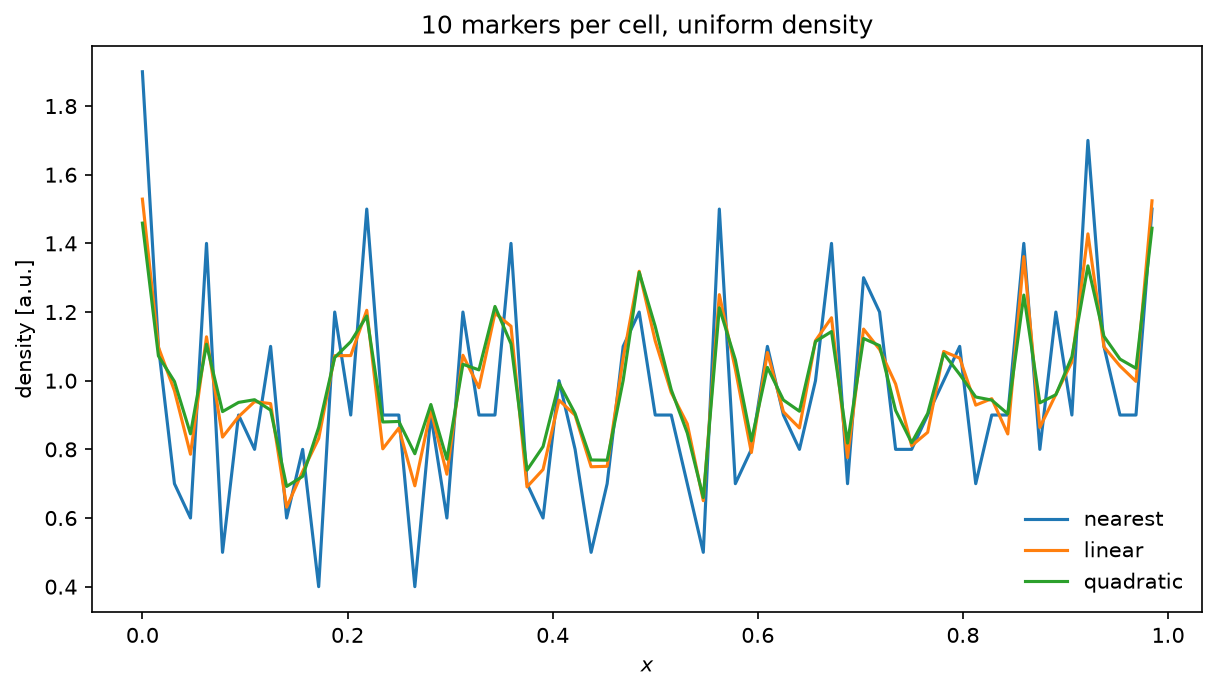
mpifield’s own. The markers sample a uniform density with ten per cell on a periodic grid, so
every departure from the mean is noise: the wider the stencil, the less of it, at ,
and nodes per marker. The plot shows the density along one row of the grid.
Python source
Section titled “Python source”"""Weightings and grid noise
Deposit the same markers with nearest-grid-point, linear and quadratic weights, the first one written here in NumPy.
`Field.scatter` and `Field.gather` take a `Weighting`: a deposit and its gather for eachnumber of dimensions. `LINEAR` (cloud-in-cell) and `QUADRATIC` (the quadratic B-spline) arebuilt in; the nearest-grid-point weighting below is a pair of NumPy functions with thearguments of the kernel convention in `mpifield.weighting`. A compiled one is a kernel folderwith Pyccel, NumPy and CUDA versions, loaded with `cunumpy.kernels.Kernel.from_folder`, asmpifield's own. The markers sample a uniform density with ten per cell on a periodic grid, soevery departure from the mean is noise: the wider the stencil, the less of it, at $1$, $2^2$and $3^2$ nodes per marker. The plot shows the density along one row of the grid."""
import matplotlib.pyplot as pltimport numpy as npimport plasma_plots # noqa: F401 (registers the .plasma accessor)
from mpifield import LINEAR, QUADRATIC, Field, Weighting
def _nearest(positions, geometry): """The nearest node of each marker along each of the two axes, wrapped (periodic).""" lower, cell, num = geometry[0:2], geometry[2:4], geometry[4:6] return tuple( np.rint((positions[d] - lower[d]) / cell[d]).astype(int) % num[d] for d in range(2) )
def scatter_nearest(positions, values, field, *geometry): """Deposit each marker's values on its nearest node.""" np.add.at(field, _nearest(positions, geometry), values.T)
def gather_nearest(positions, field, result, *geometry): """Give each marker the value of its nearest node: the transpose of the deposit.""" result[...] = field[_nearest(positions, geometry)].T
NEAREST = Weighting( "nearest", scatter={2: scatter_nearest}, gather={2: gather_nearest}, halo=1)
rng = np.random.default_rng(13)shape = (64, 64)per_cell = 10positions = rng.random((2, per_cell * shape[0] * shape[1])) # (ndim, N) in [0, 1)^2weights = np.full((1, positions.shape[1]), 1.0 / per_cell) # mean density 1kwargs = { "ndim": 2, "lower_bound": (0.0, 0.0), "upper_bound": (1.0, 1.0), "num_gridpoints": shape, "periodic": (True, True),}
fig, ax = plt.subplots(figsize=(8, 4.5), layout="constrained")for weighting in (NEAREST, LINEAR, QUADRATIC): density = Field(**kwargs) density.scatter(positions, weights, weighting) data = density.to_numpy()[..., 0] print( f"{weighting.name:>9}: total {data.sum() / data.size:.12f}, " f"relative noise {data.std() / data.mean():.3f}" ) density.evaluate(y=0.5, name="density").plasma.plot.lineout(x="x", ax=ax) ax.lines[-1].set_label(weighting.name)ax.set(title=f"{per_cell} markers per cell, uniform density")ax.legend(frameon=False)plt.show()