Test particles
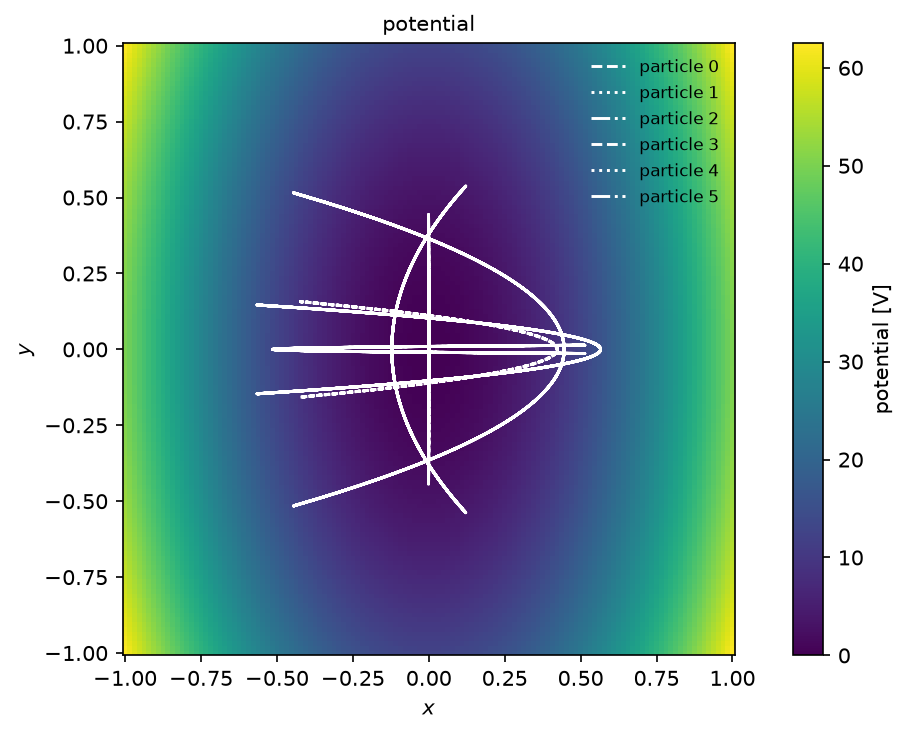
Test particles in a fixed field: push charged particles through a field on a grid with a leapfrog scheme, gathering the field every step.
This is the loop of a test-particle code: gather gives the electric field at
all markers at once, from the compiled gather. The field is that of a 2D potential well,
, so the orbits are Lissajous figures with frequencies in the
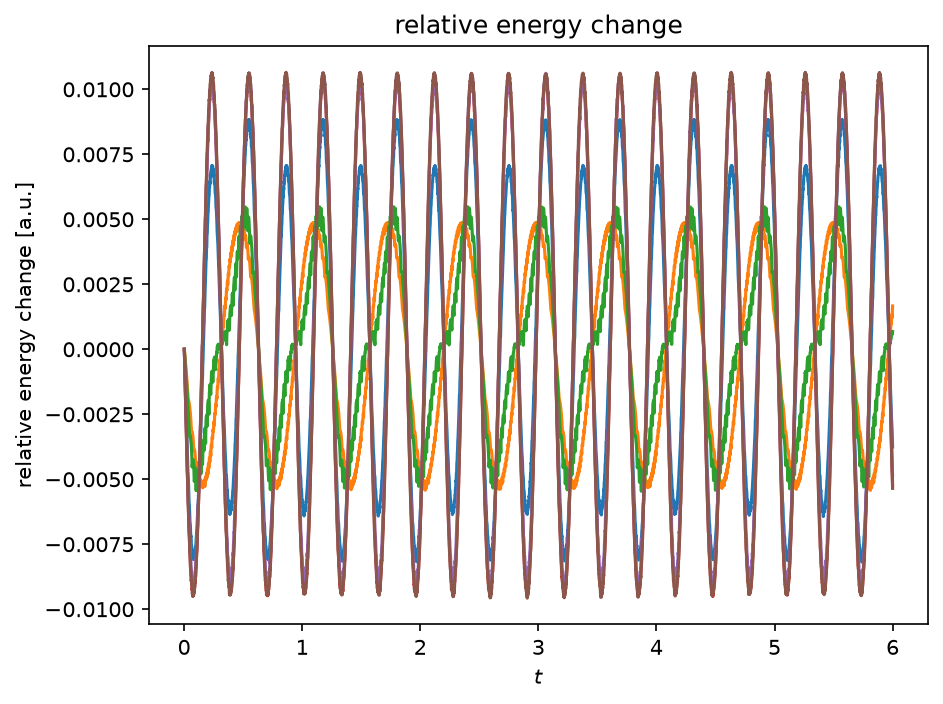
ratio 2:1, and the energy is conserved to the accuracy of the scheme.
Python source
Section titled “Python source”"""Test particles
Test particles in a fixed field: push charged particles through a field on a grid with a leapfrog scheme, gathering the field every step.
This is the loop of a test-particle code: `gather` gives the electric field atall markers at once, from the compiled gather. The field is that of a 2D potential well,$\\phi = \\phi_0 (x^2 + y^2/4)$, so the orbits are Lissajous figures with frequencies in theratio 2:1, and the energy is conserved to the accuracy of the scheme."""
import matplotlib.pyplot as pltimport numpy as npimport plasma_plots # noqa: F401import xarray as xr
from mpifield import Field
kwargs = {"ndim": 2, "lower_bound": (-1.0, -1.0), "upper_bound": (1.0, 1.0)}phi = Field(num_gridpoints=129, **kwargs)x, y = np.meshgrid(*phi.get_grid_points(), indexing="ij")phi.set_field_data(50.0 * (x**2 + y**2 / 4))electric = -phi.gradient()
charge_over_mass = 1.0 # a positive charge in a potential wellrng = np.random.default_rng(11)positions = rng.uniform(-0.6, 0.6, (2, 6))velocities = np.zeros_like(positions)dt, steps = 2e-3, 3000paths = [positions.copy()]energy = []for _ in range(steps): velocities += charge_over_mass * electric.gather(positions) * dt positions += velocities * dt paths.append(positions.copy()) kinetic = 0.5 * (velocities**2).sum(axis=0) energy.append(kinetic + charge_over_mass * phi.gather(positions)[0])paths = np.array(paths)energy = np.array(energy)
lines = { f"particle {i}": (paths[:, 0, i], paths[:, 1, i]) for i in range(paths.shape[2])}phi.plot(name="potential", units="V", overlays={"lines": lines}, equal_aspect=True)drift = xr.DataArray( (energy - energy[0]) / np.abs(energy[0]), dims=("t", "particle"), coords={"t": dt * np.arange(1, steps + 1)}, name="relative energy change",)result = drift.plasma.plot.lineout(x="t", particle=0)for i in range(1, paths.shape[2]): drift.plasma.plot.lineout(x="t", particle=i, ax=result.ax)plt.show()