Smoothing filters
The binomial, Gaussian and uniform filters of Field.smooth, as low-pass filters of a noisy deposit.
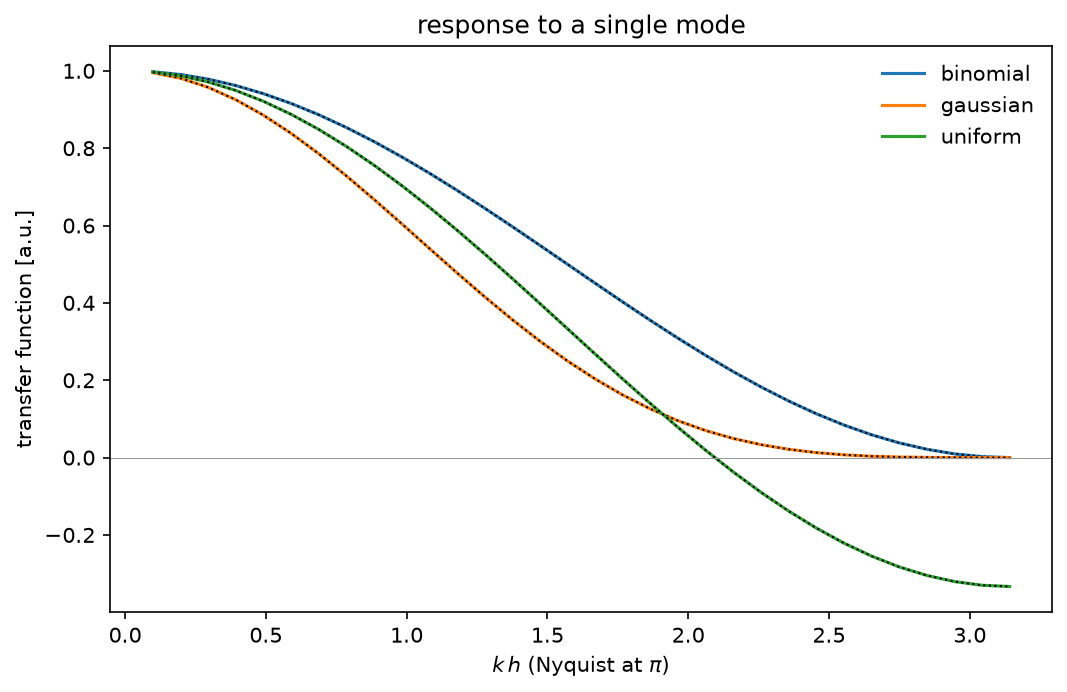
Each filter is a short symmetric stencil applied along each axis; its transfer function is the cosine series of the stencil. The binomial removes the grid-scale (Nyquist) mode completely, the 5-point Gaussian is that filter twice, and the 3-point average keeps a third of the Nyquist mode with the opposite sign. The plot measures the response of each filter to single Fourier modes on a periodic grid and compares it with the formula.
Python source
Section titled “Python source”"""Smoothing filters
The binomial, Gaussian and uniform filters of `Field.smooth`, as low-pass filters of a noisy deposit.
Each filter is a short symmetric stencil applied along each axis; its transfer function isthe cosine series of the stencil. The binomial $[1,2,1]/4$ removes the grid-scale (Nyquist)mode completely, the 5-point Gaussian $[1,4,6,4,1]/16$ is that filter twice, and the 3-pointaverage $[1,1,1]/3$ keeps a third of the Nyquist mode with the opposite sign. The plotmeasures the response of each filter to single Fourier modes on a periodic grid and comparesit with the formula."""
import matplotlib.pyplot as pltimport numpy as npimport plasma_plots # noqa: F401import xarray as xr
from mpifield import Field
n = 64kwargs = {"ndim": 1, "lower_bound": (0.0,), "upper_bound": (1.0,), "periodic": True}modes = np.arange(1, n // 2 + 1)theta = 2 * np.pi * modes / nformulas = { "binomial": np.cos(theta / 2) ** 2, "gaussian": np.cos(theta / 2) ** 4, "uniform": (1 + 2 * np.cos(theta)) / 3,}fig, ax = plt.subplots(figsize=(7, 4.5), layout="constrained")for name, formula in formulas.items(): response = [] for k in modes: field = Field(num_gridpoints=n, **kwargs) (x,) = field.get_grid_points() field.set_field_data(np.cos(2 * np.pi * k * x)) filtered = field.smooth(filter_name=name, in_place=False) response.append(float(filtered.local[0, 0])) # the cosine's peak at x = 0 measured = xr.DataArray( response, dims="kh", coords={"kh": theta}, name="transfer function" ) measured.plasma.plot.lineout(x="kh", ax=ax) ax.lines[-1].set_label(name) ax.plot(theta, formula, "k:", lw=1)ax.axhline(0, color="0.6", lw=0.5)ax.set(xlabel=r"$k\,h$ (Nyquist at $\pi$)", title="response to a single mode")ax.legend(frameon=False)plt.show()