Three dimensions
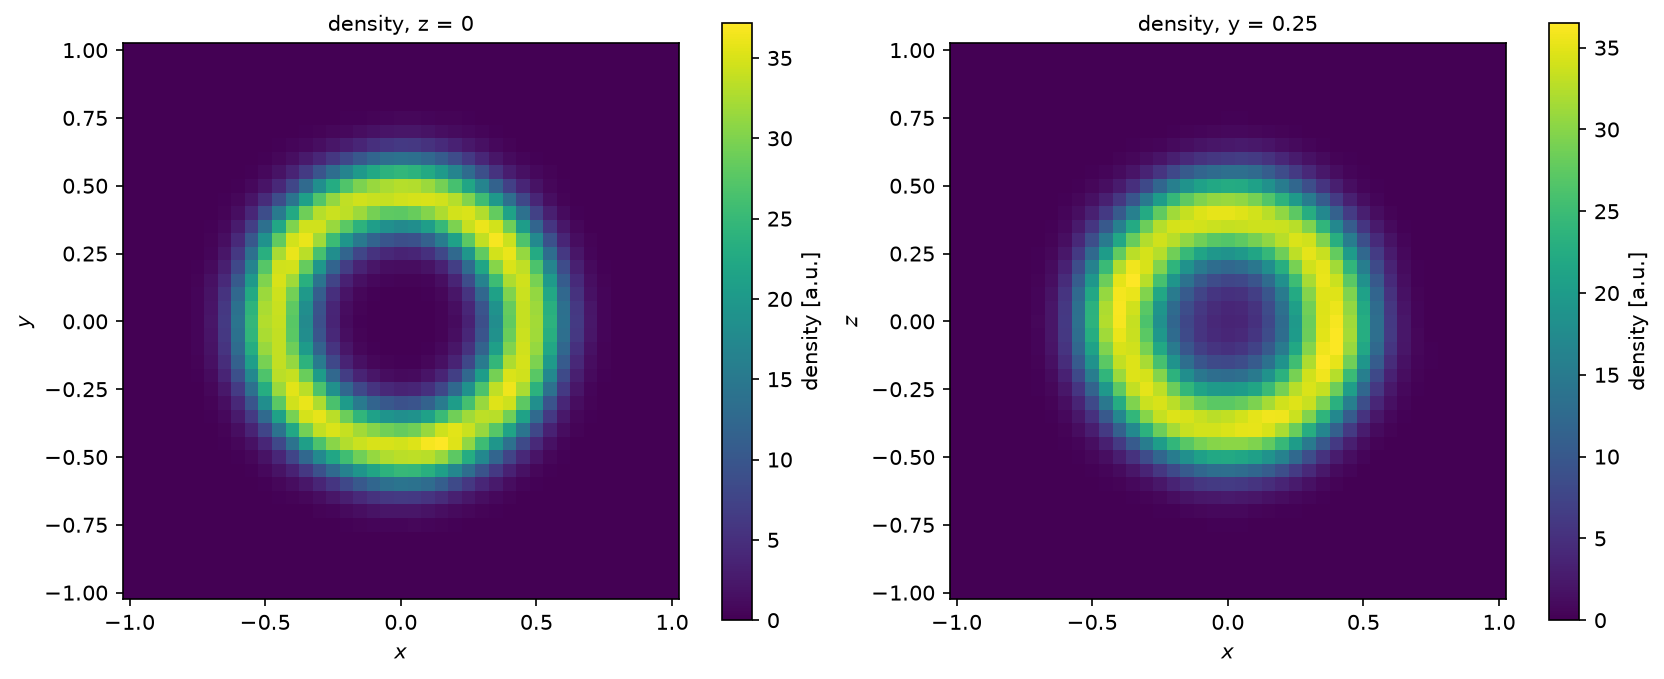
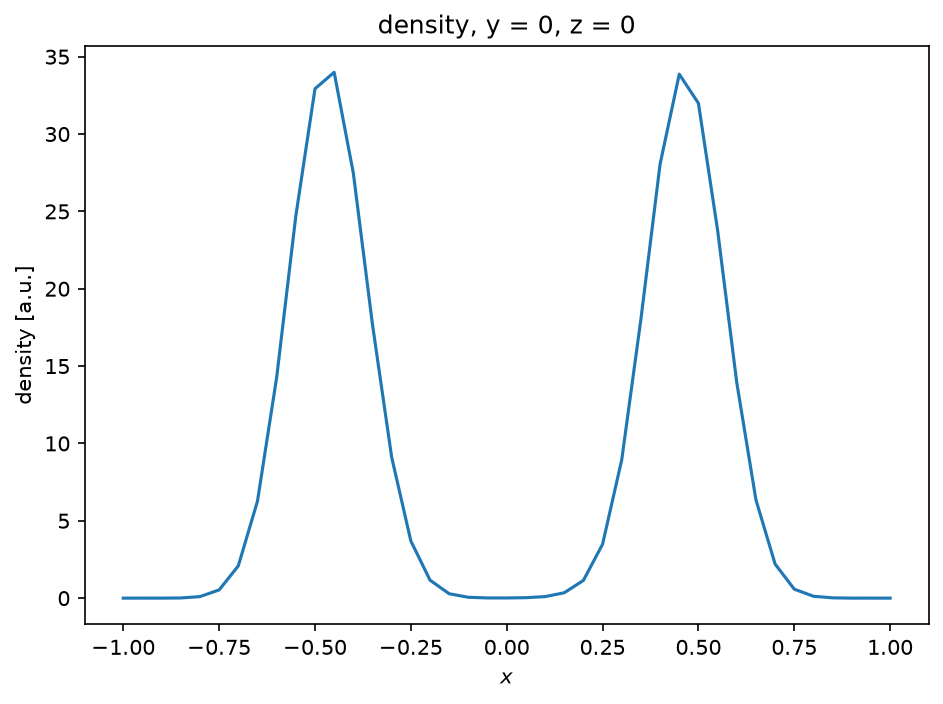
Deposit a 3D cloud of markers, gather back from it, and look at it in slices and lines.
The same calls work in 1D, 2D and 3D: scatter with positions, evaluate
with one coordinate fixed for a plane, two for a line. Here a cloud with a hollow core is
deposited, smoothed and cut through its centre.
Python source
Section titled “Python source”"""Three dimensions
Deposit a 3D cloud of markers, gather back from it, and look at it in slices and lines.
The same calls work in 1D, 2D and 3D: `scatter` with $(3, N)$ positions, `evaluate`with one coordinate fixed for a plane, two for a line. Here a cloud with a hollow core isdeposited, smoothed and cut through its centre."""
import matplotlib.pyplot as pltimport numpy as npimport plasma_plots # noqa: F401
from mpifield import Field
rng = np.random.default_rng(10)count = 200_000direction = rng.normal(size=(3, count))direction /= np.linalg.norm(direction, axis=0)positions = direction * (0.5 + 0.08 * rng.normal(size=count)) # a spherical shell
density = Field( ndim=3, lower_bound=(-1.0,) * 3, upper_bound=(1.0,) * 3, num_gridpoints=41)density.scatter(positions, np.ones((1, count)))density.smooth_binomial(passes=2)gathered = density.gather(positions)print(f"mean density seen by the markers: {gathered.mean():.1f} per node")
fig, (left, right) = plt.subplots(1, 2, figsize=(11, 4.5), layout="constrained")density.plot(ax=left, z=0.0, name="density", equal_aspect=True)density.plot(ax=right, y=0.25, name="density", equal_aspect=True)density.plot(y=0.0, z=0.0, name="density")plt.show()