Beam density in 2D
Deposit a sheared, tilted Gaussian beam on a 2D grid, then smooth the deposit.
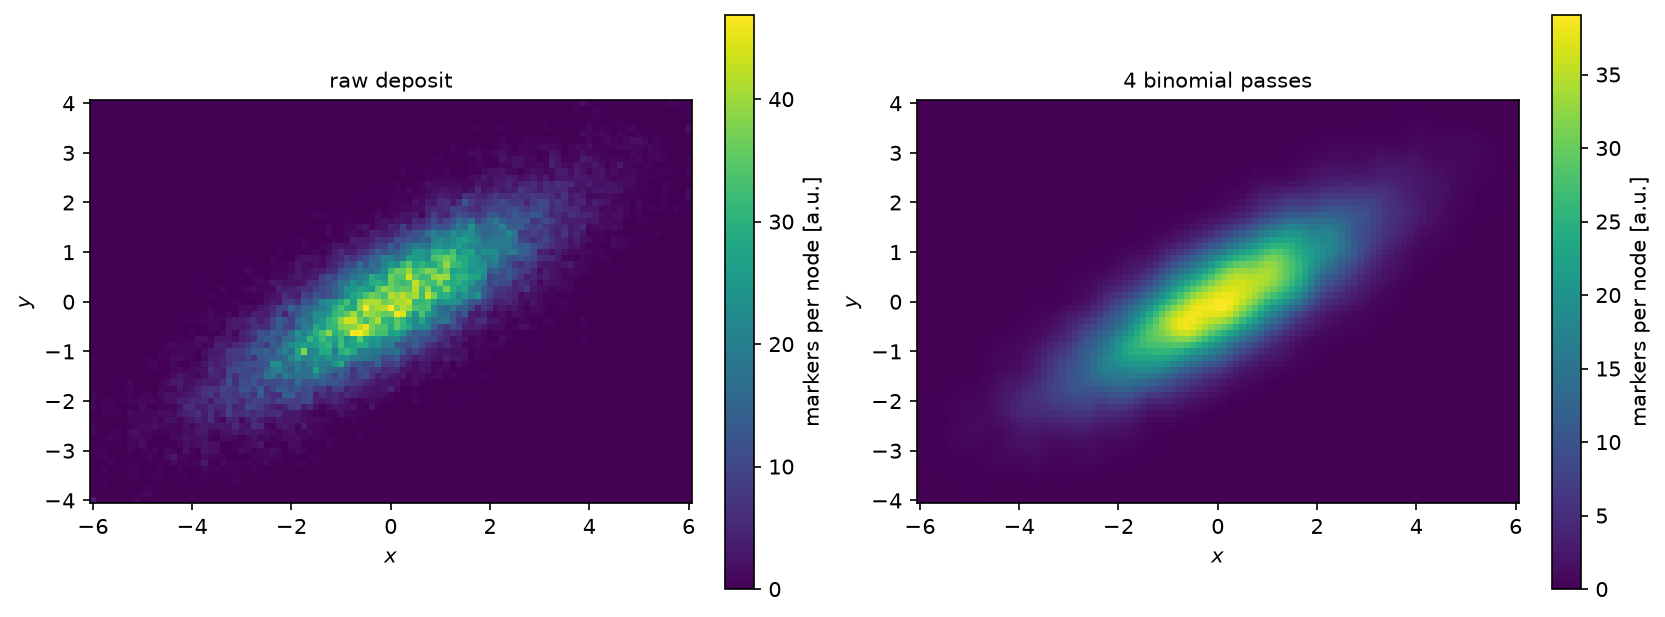
The markers follow a Gaussian whose axes are tilted by 30 degrees. The raw deposit is noisy at this marker count; a few passes of the binomial filter along each axis remove the grid-scale noise while keeping the total, as a PIC code does before solving for the field.
Python source
Section titled “Python source”"""Beam density in 2D
Deposit a sheared, tilted Gaussian beam on a 2D grid, then smooth the deposit.
The markers follow a Gaussian whose axes are tilted by 30 degrees. The raw deposit is noisy atthis marker count; a few passes of the binomial filter $[1, 2, 1]/4$ along each axis removethe grid-scale noise while keeping the total, as a PIC code does before solving for the field."""
import matplotlib.pyplot as pltimport numpy as npimport plasma_plots # noqa: F401
from mpifield import Field
rng = np.random.default_rng(2)count = 20_000angle = np.deg2rad(30)rotation = np.array([[np.cos(angle), -np.sin(angle)], [np.sin(angle), np.cos(angle)]])positions = rotation @ (rng.normal(size=(2, count)) * np.array([[2.0], [0.6]]))
density = Field( ndim=2, lower_bound=(-6.0, -4.0), upper_bound=(6.0, 4.0), num_gridpoints=(97, 65))density.scatter(positions, np.ones((1, count)))smoothed = density.smooth_binomial(passes=4, in_place=False)print(f"total before {density.sum():.1f}, after smoothing {smoothed.sum():.1f}")
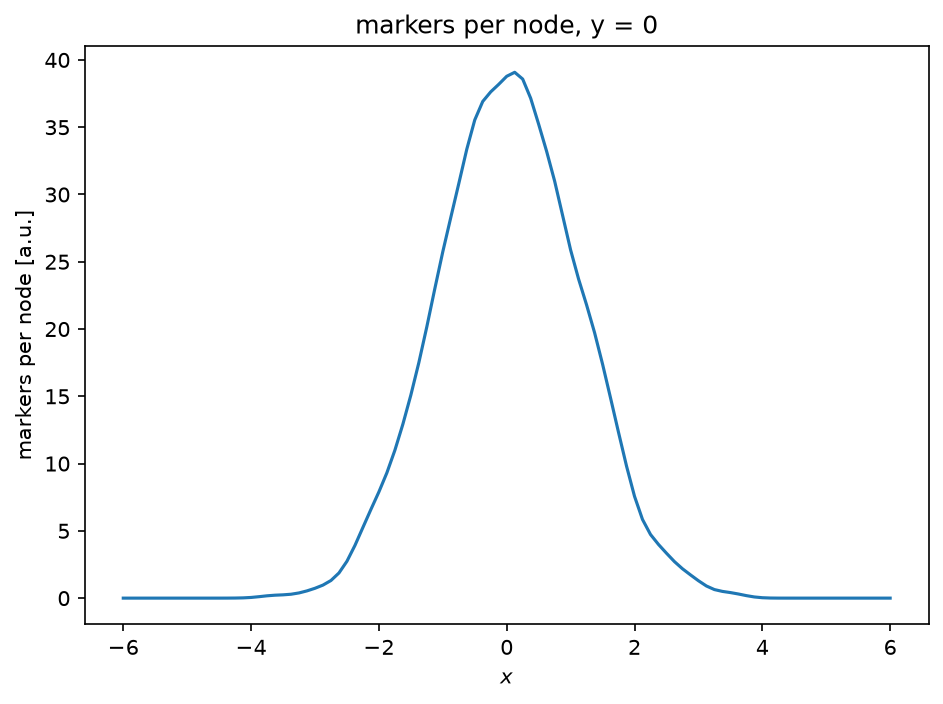
fig, (left, right) = plt.subplots(1, 2, figsize=(11, 4), layout="constrained")density.plot(ax=left, name="markers per node", title="raw deposit", equal_aspect=True)smoothed.plot( ax=right, name="markers per node", title="4 binomial passes", equal_aspect=True)smoothed.plot(y=0.0, name="markers per node")plt.show()