Gather accuracy
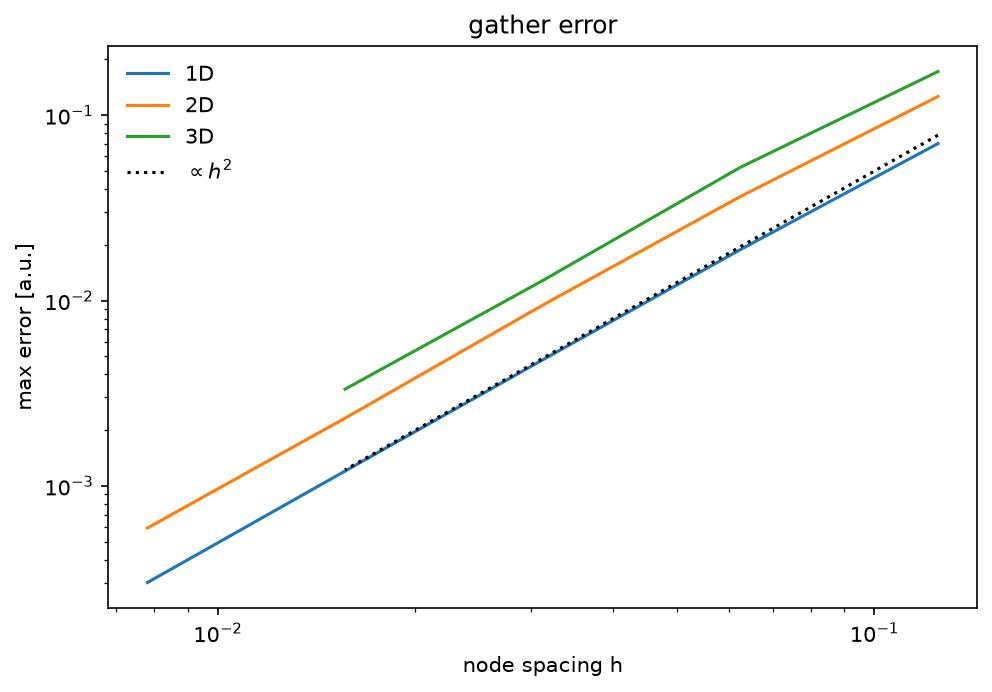
The linear gather is second-order accurate: its error falls as the square of the node spacing.
A smooth field is set on grids of increasing resolution in 1D, 2D and 3D and interpolated at random points. The largest error halves twice for every halving of the spacing, in every dimension: the slope on the log-log plot.
Python source
Section titled “Python source”"""Gather accuracy
The linear gather is second-order accurate: its error falls as the square of the node spacing.
A smooth field $\\sin(2\\pi x)\\cos(2\\pi y)\\ldots$ is set on grids of increasing resolution in1D, 2D and 3D and interpolated at random points. The largest error halves twice for everyhalving of the spacing, in every dimension: the slope $-2$ on the log-log plot."""
import matplotlib.pyplot as pltimport numpy as npimport plasma_plots # noqa: F401import xarray as xr
from mpifield import Field
rng = np.random.default_rng(3)resolutions = np.array([9, 17, 33, 65, 129])
def exact(points): """The test field at component-major points ``(ndim, N)``.""" values = np.sin(2 * np.pi * points[0]) for axis in range(1, points.shape[0]): values = values * np.cos(2 * np.pi * points[axis]) return values
fig, ax = plt.subplots(figsize=(6.5, 4.5), layout="constrained")for ndim in (1, 2, 3): errors = [] for n in resolutions[: 4 if ndim == 3 else 5]: field = Field( ndim=ndim, lower_bound=(0.0,) * ndim, upper_bound=(1.0,) * ndim, num_gridpoints=int(n), ) nodes = np.meshgrid(*field.get_grid_points(), indexing="ij") field.set_field_data(exact(np.stack(nodes))) points = rng.random((ndim, 5000)) errors.append(np.abs(field.gather(points)[0] - exact(points)).max()) spacing = 1.0 / (resolutions[: len(errors)] - 1) error = xr.DataArray( errors, dims="spacing", coords={"spacing": spacing}, name="max error" ) error.plasma.plot.lineout(x="spacing", ax=ax) ax.lines[-1].set_label(f"{ndim}D") order = np.polyfit(np.log(spacing), np.log(errors), 1)[0] print(f"{ndim}D: observed order {order:.2f}")
ax.loglog(spacing, 5 * spacing**2, "k:", label=r"$\propto h^2$")ax.set(xscale="log", yscale="log", xlabel="node spacing h", title="gather error")ax.legend(frameon=False)plt.show()