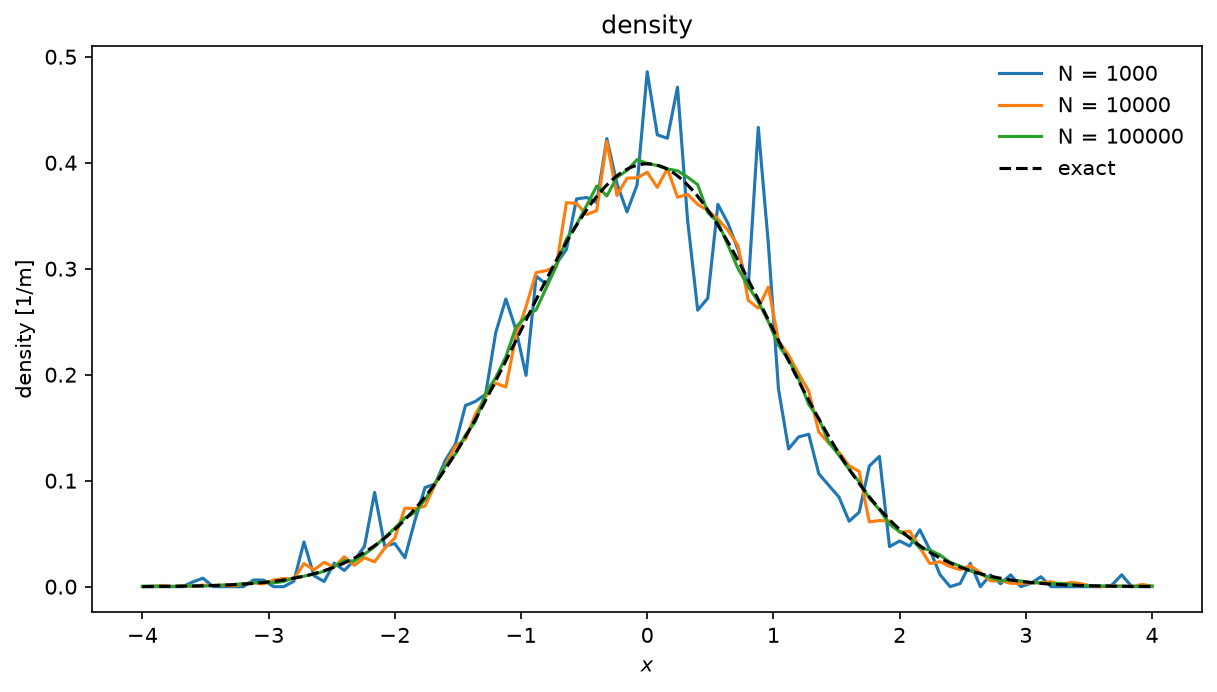
Cloud-in-cell density
Deposit a Maxwellian cloud of markers on a 1D grid and compare the density with the exact profile.
Every marker adds its weight to the two nodes of its cell, in proportion to its distance from the other node (linear, or cloud-in-cell, weights). Divided by the node spacing, the deposit is a density whose noise falls as with the number of markers , and whose total is the total weight exactly: the deposit conserves charge to round-off. The plot compares deposits with , and markers to the Gaussian they sample.
Python source
Section titled “Python source”"""Cloud-in-cell density
Deposit a Maxwellian cloud of markers on a 1D grid and compare the density with the exact profile.
Every marker adds its weight to the two nodes of its cell, in proportion to its distancefrom the other node (linear, or cloud-in-cell, weights). Divided by the node spacing, thedeposit is a density whose noise falls as $1/\\sqrt{N}$ with the number of markers $N$, andwhose total is the total weight exactly: the deposit conserves charge to round-off. Theplot compares deposits with $10^3$, $10^4$ and $10^5$ markers to the Gaussian they sample."""
import matplotlib.pyplot as pltimport numpy as npimport plasma_plots # noqa: F401 (registers the .plasma accessor)
from mpifield import Field
rng = np.random.default_rng(1)num_gridpoints = 101fig, ax = plt.subplots(figsize=(8, 4.5), layout="constrained")for count in (1_000, 10_000, 100_000): density = Field( ndim=1, lower_bound=(-4.0,), upper_bound=(4.0,), num_gridpoints=num_gridpoints ) positions = rng.normal(0.0, 1.0, (1, count)) # component-major (ndim, N) weights = np.full((1, count), 1.0 / count) # unit total density.scatter(positions, weights) density /= float(density.grid_spacing[0]) print(f"N = {count:>6}: total weight on the grid = {density.sum() * 0.08:.15f}") density.plot(ax=ax, name="density", units="1/m") ax.lines[-1].set_label(f"N = {count}")
x = np.linspace(-4, 4, 400)ax.plot(x, np.exp(-(x**2) / 2) / np.sqrt(2 * np.pi), "k--", label="exact")ax.legend(frameon=False)plt.show()