Tutorial 15 - TikzFigure Subplots Tutorial
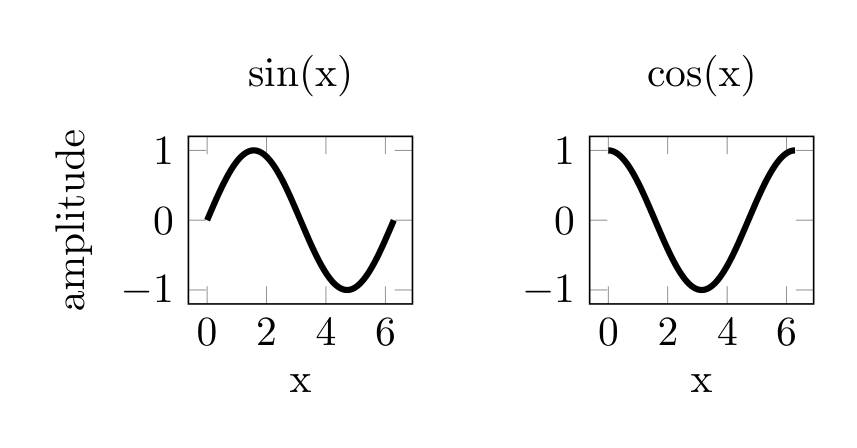
This tutorial demonstrates how to create side-by-side subplots using the tikzfigure backend.
Basic 1×2 Layout
The simplest use case: two plots side by side.
[1]:
from maxplotlib import Canvas
import numpy as np

%load_ext autoreload
%autoreload 2
[2]:
# Create a 1×2 canvas with custom width
x = np.linspace(0, 2 * np.pi, 200)
canvas, (ax1, ax2) = Canvas.subplots(ncols=2, width="10cm", ratio=0.3)

# Left subplot: sine wave
ax1.plot(x, np.sin(x), color="royalblue", label="sin(x)", linewidth=1.5)
ax1.set_title("sin(x)")
ax1.set_xlabel("x")
ax1.set_ylabel("amplitude")

# Right subplot: cosine wave
ax2.plot(x, np.cos(x), color="tomato", label="cos(x)", linewidth=1.5)
ax2.set_title("cos(x)")
ax2.set_xlabel("x")

# Set overall title
canvas.suptitle("1 × 2 Layout: Trigonometric Functions")

# Render with tikzfigure backend
result = canvas.show(backend="tikzfigure")
warning: The `fitz` API is deprecated and will be removed in future. Use `import pymupdf` instead.
Inspecting the generated subplot dimensions
The exported TikZ splits the available width across the columns and keeps the requested overall height. Printing the \\nextgroupplot[...] lines makes that explicit.
[3]:
tikz = canvas.render(backend="tikzfigure")
subplot_code = tikz.generate_tikz()

for line in subplot_code.splitlines():
    if "nextgroupplot" in line:
        print(line.strip())

# With width="10cm" and ratio=0.3, each subplot gets its own width entry.
\nextgroupplot[xlabel=x, ylabel=amplitude, grid=false, height=3cm, title=sin(x), axis width=4.25cm]
\nextgroupplot[xlabel=x, grid=false, height=3cm, title=cos(x), axis width=4.25cm]
1×3 Layout: Multiple Functions
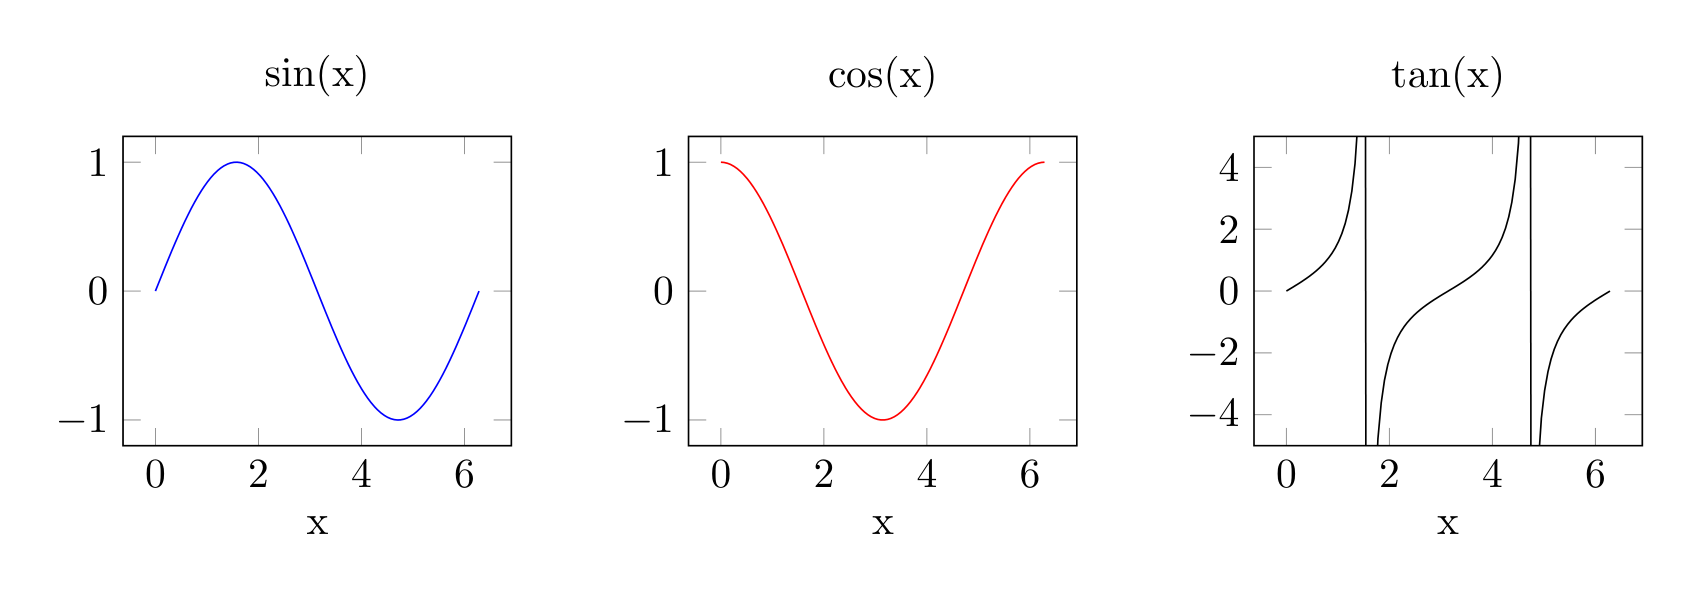
You can create layouts with more than 2 subplots.
[4]:
# Create a 1×3 canvas
canvas, axes = Canvas.subplots(ncols=3, width="12cm", ratio=0.35)

# Three different functions
x = np.linspace(0, 2 * np.pi, 100)

axes[0].plot(x, np.sin(x), color="blue")
axes[0].set_title("sin(x)")
axes[0].set_xlabel("x")

axes[1].plot(x, np.cos(x), color="red")
axes[1].set_title("cos(x)")
axes[1].set_xlabel("x")

axes[2].plot(x, np.tan(x), color="darkgreen")
axes[2].set_title("tan(x)")
axes[2].set_xlabel("x")
axes[2].set_ylim(-5, 5)  # Limit y-range for tan

canvas.suptitle("1 × 3 Layout: Three Trigonometric Functions")
result = canvas.show(backend="tikzfigure")
print(result)
None
Important Notes
Only horizontal layouts (1×n) are supported with tikzfigure backend
Vertical/grid layouts (nrows > 1) will raise an error
Use the direct tikzfigure API for complex layouts or grids
Each subplot’s title becomes a pgfplots
title=entry in the generated LaTeX output