Tutorial 01 — Quick Start
maxplotlib is a thin, expressive wrapper around Matplotlib that simplifies creating publication-quality figures. Its central class, Canvas, replaces the usual fig, ax = plt.subplots() boilerplate and exposes a clean, chainable API.
This notebook walks you through the very basics:
creating a canvas and a subplot
adding lines
using the canvas-level shortcut API
saving figures
[1]:
from maxplotlib import Canvas
import numpy as np

%matplotlib inline
Backend selection
All examples in this tutorial use the same Canvas API; you can switch rendering backends at any time:
BACKEND = "matplotlib"for static Matplotlib outputBACKEND = "plotly"for interactive Plotly output (Jupyter-friendly)
Most cells end with canvas.show(backend=BACKEND) so you can re-run the whole notebook with a different backend.
[2]:
# Change to "plotly" for interactive output
BACKEND = "matplotlib"
1 Minimal example
Canvas.subplots() mirrors plt.subplots(). It returns the canvas and one (or more) subplot axes objects.
[3]:
x = np.linspace(0, 2 * np.pi, 200)
y = np.sin(x)

canvas, ax = Canvas.subplots()
ax.plot(x, y)
canvas.show(backend=BACKEND)
[3]:
(<Figure size 640x480 with 1 Axes>, array([[<Axes: >]], dtype=object))
2 Multiple lines with labels, colors, and linestyles
[4]:
canvas, ax = Canvas.subplots()

ax.plot(x, np.sin(x), label="sin(x)", color="royalblue", linestyle="solid", linewidth=2)
ax.plot(x, np.cos(x), label="cos(x)", color="tomato", linestyle="dashed", linewidth=2)
ax.plot(
    x,
    np.sin(2 * x),
    label="sin(2x)",
    color="forestgreen",
    linestyle="dotted",
    linewidth=1.5,
)

ax.set_xlabel("x")
ax.set_ylabel("y")
ax.set_title("Sine and Cosine")
ax.set_legend(True)

canvas.show(backend=BACKEND)
[4]:
(<Figure size 640x480 with 1 Axes>,
 array([[<Axes: title={'center': 'Sine and Cosine'}, xlabel='x', ylabel='y'>]],
       dtype=object))
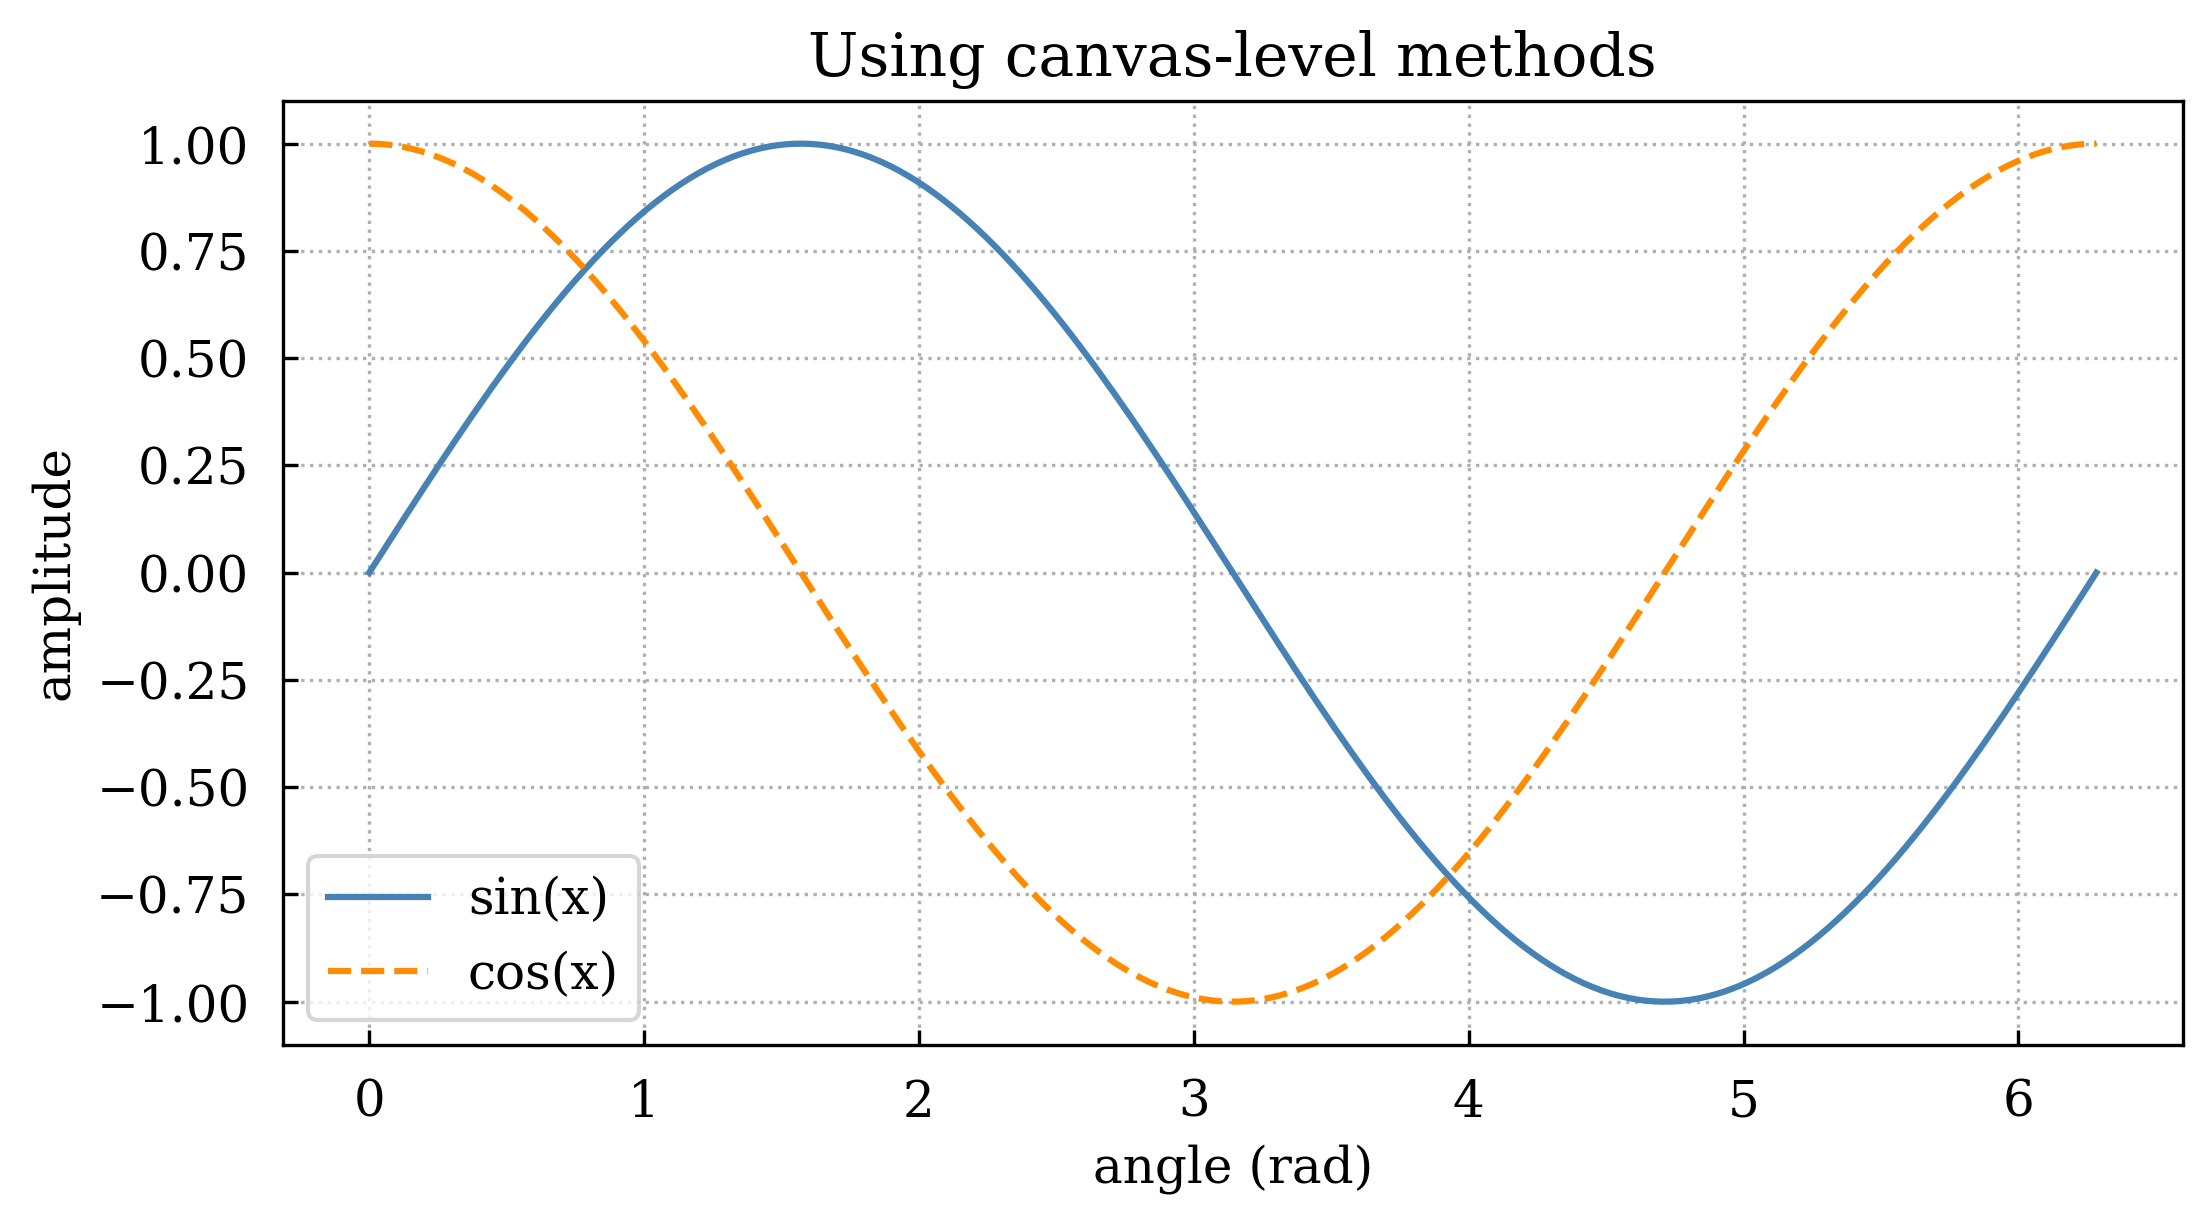
3 Canvas-level shortcut API
For single-subplot figures you can call plot methods directly on the Canvas object — they are forwarded to the subplot at row=0, col=0.
[5]:
canvas = Canvas(ratio=0.5, fontsize=12)

canvas.add_line(x, np.sin(x), label="sin(x)", color="steelblue")
canvas.add_line(x, np.cos(x), label="cos(x)", color="darkorange", linestyle="dashed")

canvas.set_xlabel("angle (rad)")
canvas.set_ylabel("amplitude")
canvas.set_title("Using canvas-level methods")
canvas.set_legend(True)
canvas.set_grid(True)

canvas.show(backend=BACKEND)
[5]:
(<Figure size 640x480 with 1 Axes>,
 array([[<Axes: title={'center': 'Using canvas-level methods'}, xlabel='angle (rad)', ylabel='amplitude'>]],
       dtype=object))
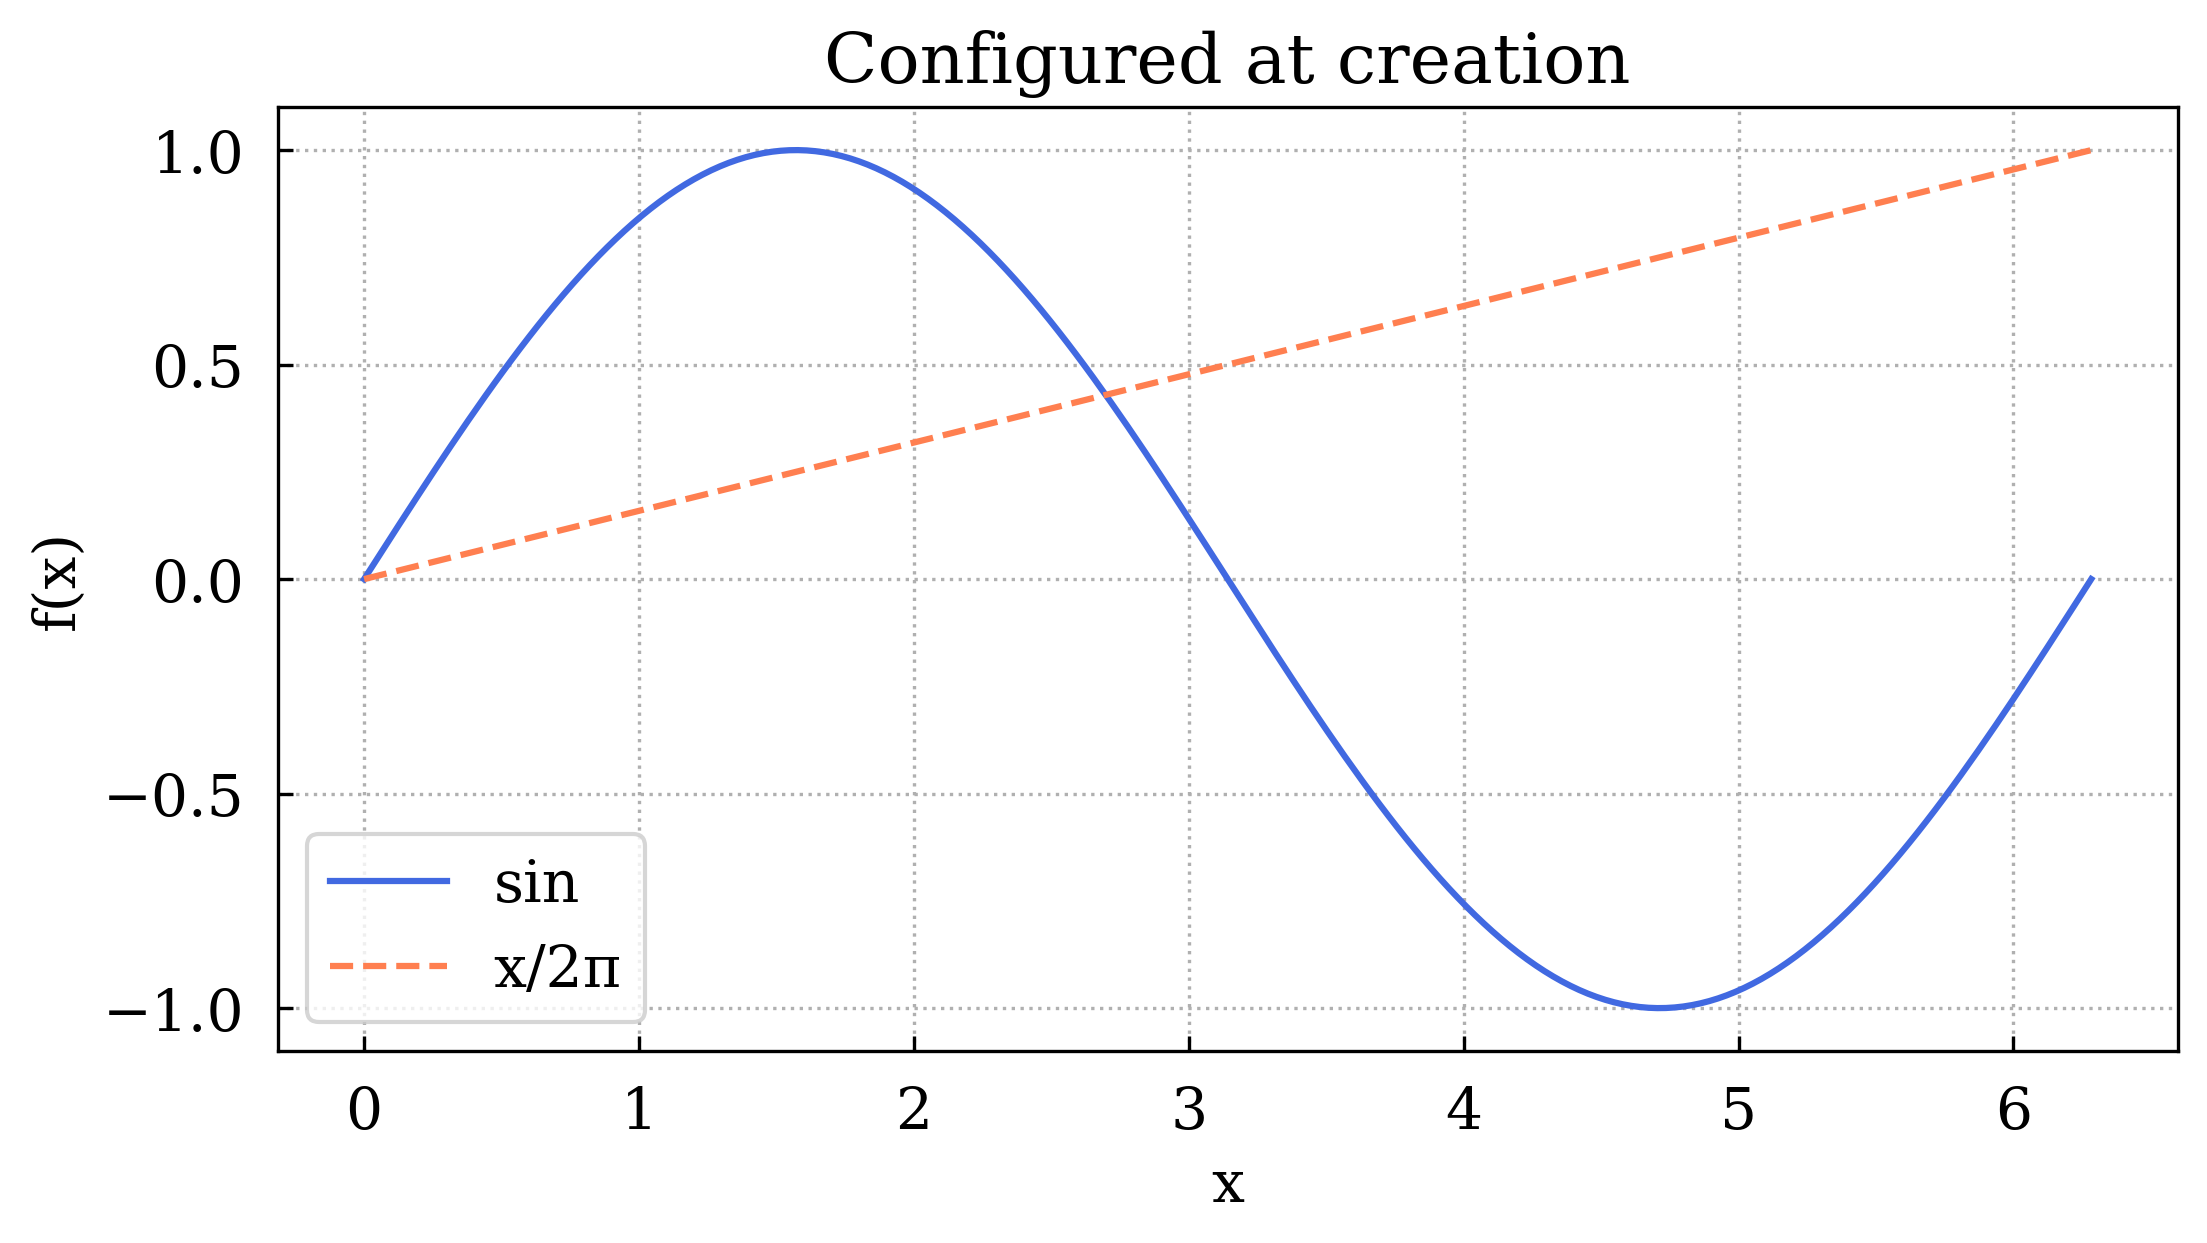
4 Configuring the subplot at creation time
add_subplot() accepts convenience kwargs so you can set labels, grid, and legend in one call.
[6]:
canvas = Canvas(ratio=0.5)
ax = canvas.add_subplot(
    title="Configured at creation",
    xlabel="x",
    ylabel="f(x)",
    grid=True,
    legend=True,
)

ax.plot(x, np.sin(x), label="sin", color="royalblue")
ax.plot(x, x / (2 * np.pi), label="x/2π", color="coral", linestyle="dashed")

canvas.show(backend=BACKEND)

[6]:
(<Figure size 640x480 with 1 Axes>,
 array([[<Axes: title={'center': 'Configured at creation'}, xlabel='x', ylabel='f(x)'>]],
       dtype=object))
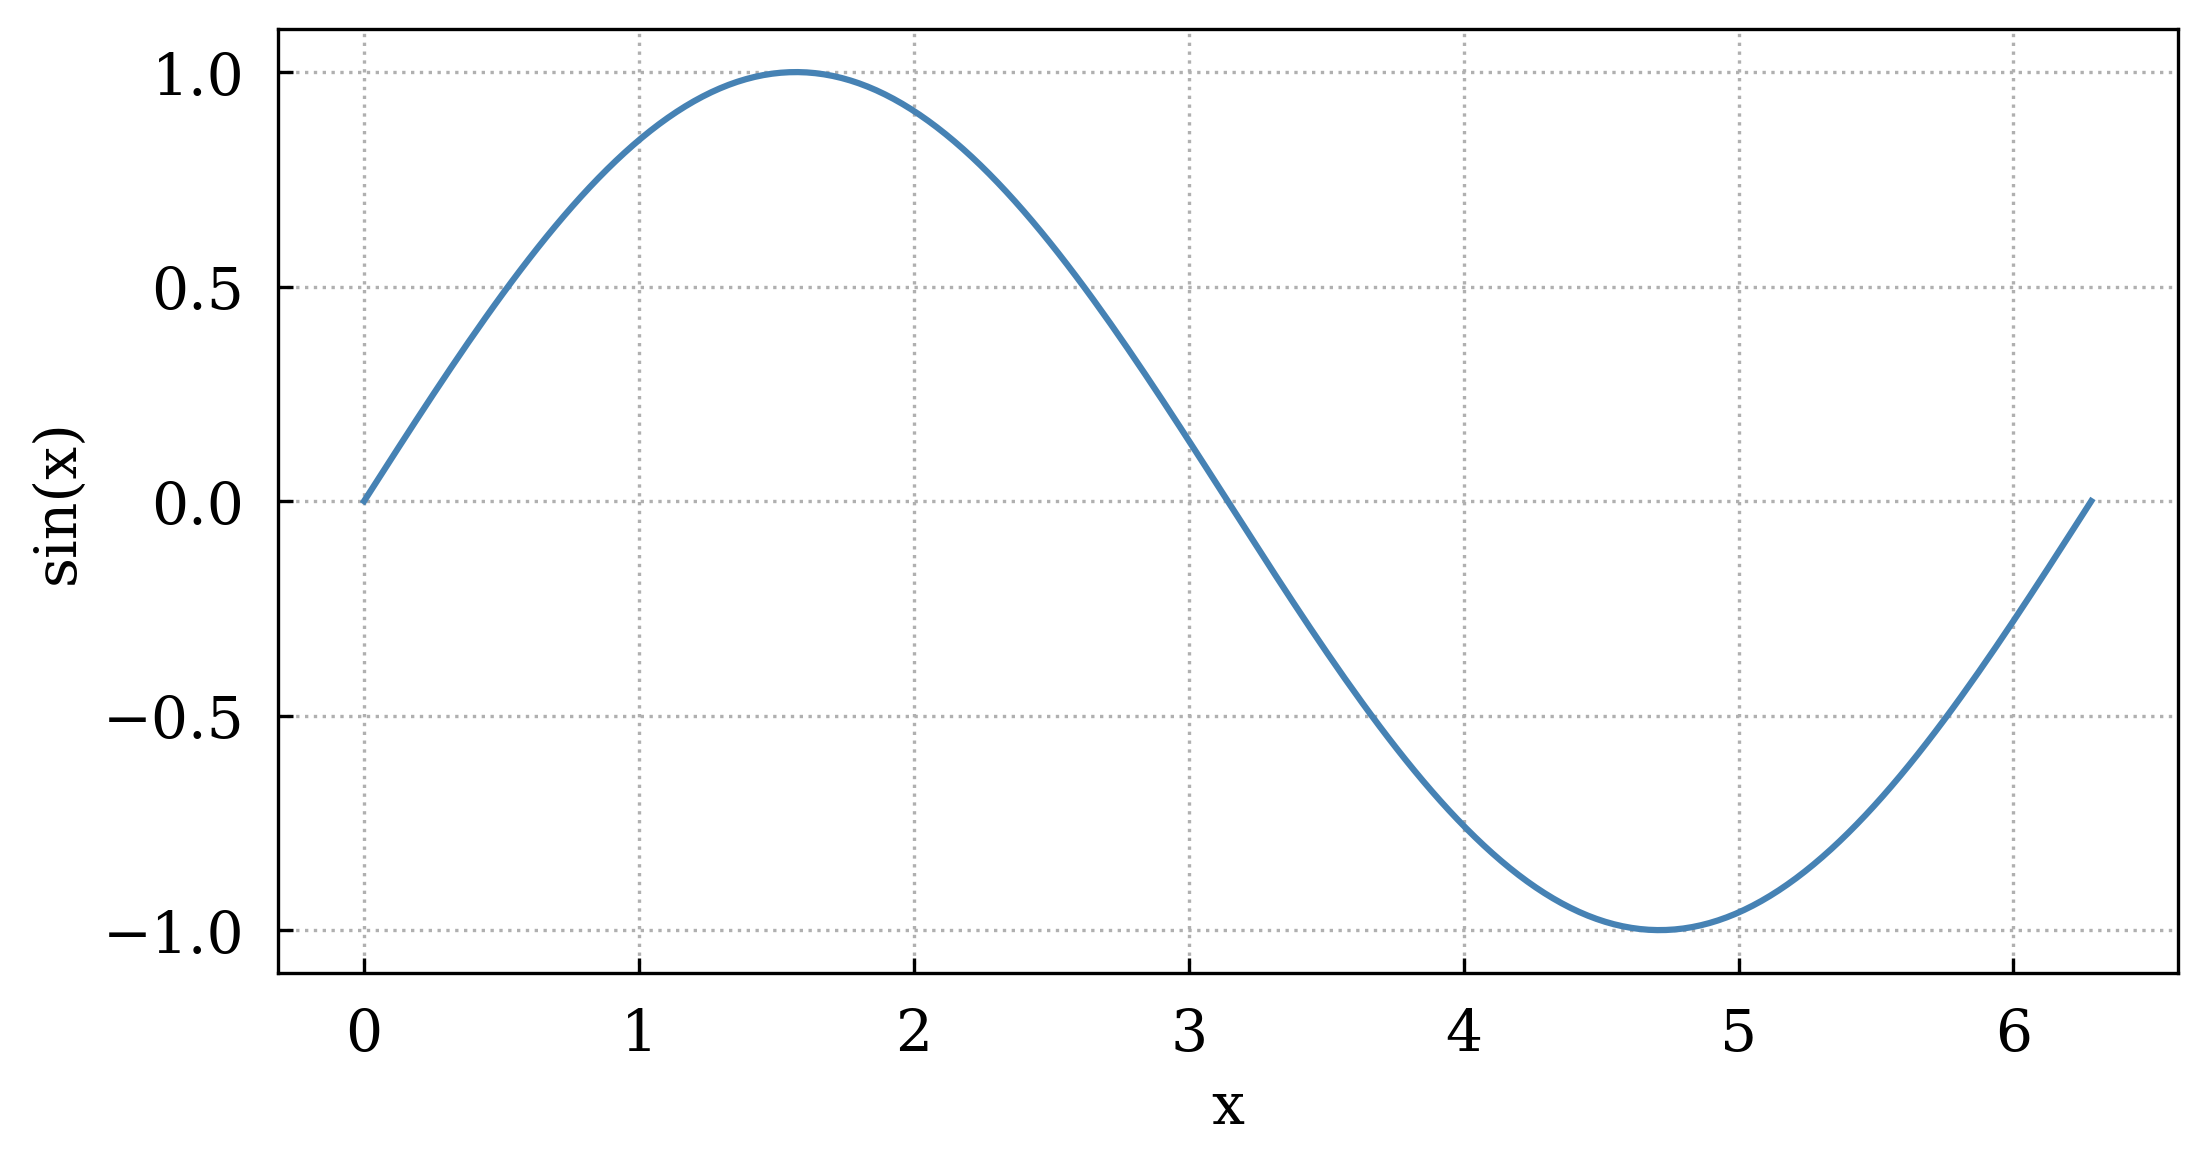
5 Saving a figure
Use canvas.savefig() to write the figure to disk. The file extension determines the format; pass backend='matplotlib' for PDF output.
[7]:
canvas = Canvas(ratio=0.5)
ax = canvas.add_subplot(xlabel="x", ylabel="sin(x)", grid=True)
ax.plot(x, np.sin(x), color="steelblue")

canvas.savefig("tutorial_01_output.png")
print("Figure saved to tutorial_01_output.png")
Figure saved to tutorial_01_output.png
Summary
Task |
Code |
|---|---|
Create canvas + subplot |
|
Add a line |
|
Canvas shortcut |
|
Labels / title |
|
Legend / grid |
|
Display |
|
Save |
|
Continue to Tutorial 02 to learn about multi-subplot layouts.