Tutorial 10 - Matplotlib NxM Subplots and Spacing
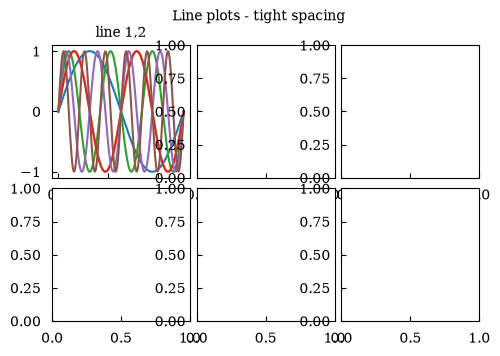
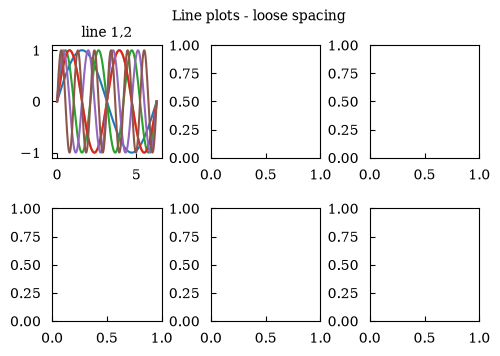
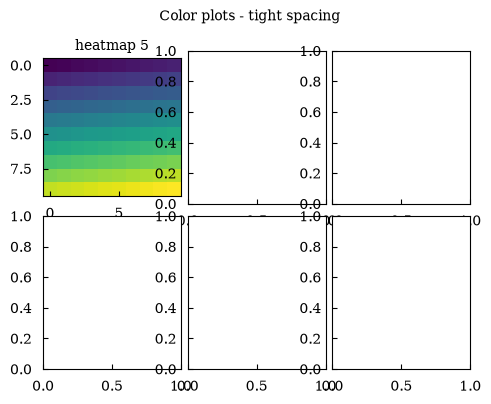
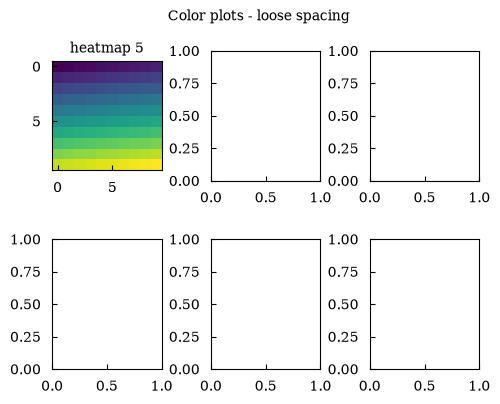
This tutorial shows how to build NxM subplot grids with the matplotlib backend and control the distance between plots using wspace=... and hspace=....
It includes both:
line plots
color plots (
add_imshow)
and prints measured subplot gaps so you can verify spacing changes numerically.
[1]:
import numpy as np
import matplotlib.pyplot as plt

from maxplotlib import Canvas
[2]:
def measure_gaps(axes):
    """Measure one representative horizontal and vertical subplot gap."""
    horizontal_gap = axes[0, 1].get_position().x0 - axes[0, 0].get_position().x1
    vertical_gap = axes[0, 0].get_position().y0 - axes[1, 0].get_position().y1
    return horizontal_gap, vertical_gap
1 · NxM line plots with spacing control
[3]:
x = np.linspace(0, 2 * np.pi, 200)

tight_canvas, tight_axes = Canvas.subplots(
    nrows=2,
    ncols=3,
    width="14cm",
    ratio=0.65,
    wspace=0.05,
    hspace=0.08,
)
for i, row in enumerate(tight_axes):
    for j, ax in enumerate(row):
        tight_canvas.plot(
            x, np.sin((i + 1) * (j + 1) * x), label=f"sin({(i + 1) * (j + 1)}x)"
        )
        tight_canvas.set_title(f"line {i},{j}")

tight_fig, tight_m_axes = tight_canvas.render(backend="matplotlib")
tight_fig.suptitle("Line plots - tight spacing")
tight_h, tight_v = measure_gaps(tight_m_axes)
print(f"tight line gaps: h={tight_h:.4f}, v={tight_v:.4f}")

loose_canvas, loose_axes = Canvas.subplots(
    nrows=2,
    ncols=3,
    width="14cm",
    ratio=0.65,
    wspace=0.45,
    hspace=0.45,
)
for i, row in enumerate(loose_axes):
    for j, ax in enumerate(row):
        loose_canvas.plot(
            x, np.sin((i + 1) * (j + 1) * x), label=f"sin({(i + 1) * (j + 1)}x)"
        )
        loose_canvas.set_title(f"line {i},{j}")

loose_fig, loose_m_axes = loose_canvas.render(backend="matplotlib")
loose_fig.suptitle("Line plots - loose spacing")
loose_h, loose_v = measure_gaps(loose_m_axes)
print(f"loose line gaps: h={loose_h:.4f}, v={loose_v:.4f}")

assert loose_h > tight_h
assert loose_v > tight_v
tight line gaps: h=0.0125, v=0.0296
loose line gaps: h=0.0894, v=0.1414
2 · NxM color plots (imshow) with spacing control
[4]:
base = np.arange(100).reshape(10, 10)

tight_canvas, tight_axes = Canvas.subplots(
    nrows=2,
    ncols=3,
    width="14cm",
    ratio=0.75,
    wspace=0.05,
    hspace=0.08,
)
idx = 0
for row in tight_axes:
    for ax in row:
        tight_canvas.imshow(base + idx, cmap="viridis")
        tight_canvas.set_title(f"heatmap {idx}")
        idx += 1

tight_fig, tight_m_axes = tight_canvas.render(backend="matplotlib")
tight_fig.suptitle("Color plots - tight spacing")
tight_h, tight_v = measure_gaps(tight_m_axes)
print(f"tight color gaps: h={tight_h:.4f}, v={tight_v:.4f}")

loose_canvas, loose_axes = Canvas.subplots(
    nrows=2,
    ncols=3,
    width="14cm",
    ratio=0.75,
    wspace=0.45,
    hspace=0.45,
)
idx = 0
for row in loose_axes:
    for ax in row:
        loose_canvas.imshow(base + idx, cmap="viridis")
        loose_canvas.set_title(f"heatmap {idx}")
        idx += 1

loose_fig, loose_m_axes = loose_canvas.render(backend="matplotlib")
loose_fig.suptitle("Color plots - loose spacing")
loose_h, loose_v = measure_gaps(loose_m_axes)
print(f"loose color gaps: h={loose_h:.4f}, v={loose_v:.4f}")

assert loose_h > tight_h
assert loose_v > tight_v

plt.show()
tight color gaps: h=0.0125, v=0.0480
loose color gaps: h=0.0894, v=0.1661
Plotly preview
The spacing measurements above are Matplotlib-specific. You can still preview the same canvas with the Plotly backend (layout/spacing will differ):
[5]:
# Reuse the last canvas created above
loose_canvas.show(backend="plotly")
Data type cannot be displayed: application/vnd.plotly.v1+json