Tutorial 14 – Axis and layout controls
This tutorial demonstrates the latest Matplotlib-style wrappers: filled polygons, logarithmic shortcuts, axis limits and autoscaling, secondary axes, box aspect, and explicit tick labels.
[1]:
import numpy as np
from maxplotlib import Canvas

x = np.linspace(0.1, 10, 200)
Filled polygons
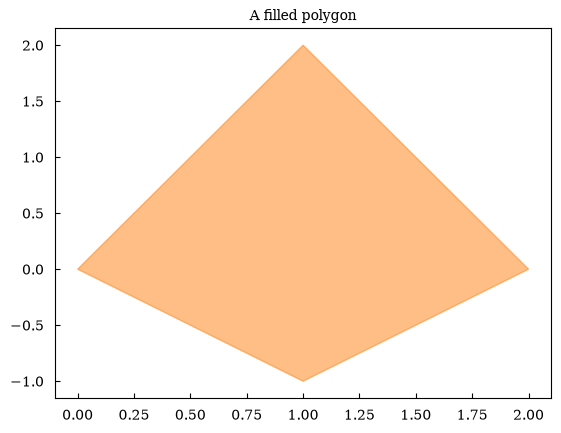
fill() forwards polygon coordinates to Matplotlib and becomes a filled Plotly scatter trace.
[2]:
canvas = Canvas()
canvas.fill([0, 1, 2, 1], [0, 2, 0, -1], color="tab:orange", alpha=0.5)
canvas.set_title("A filled polygon")
canvas.show()
[2]:
(<Figure size 640x480 with 1 Axes>,
 array([[<Axes: title={'center': 'A filled polygon'}>]], dtype=object))
Logarithmic plotting shortcuts
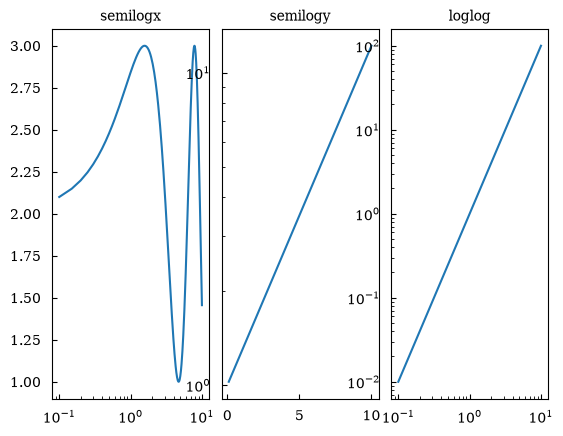
Use semilogx(), semilogy(), or loglog() when the data and axis scale should be configured together. The three-panel example below shows the optional fig/axs style for users familiar with Matplotlib; ordinary one-panel examples use Canvas directly.
[3]:
canvas, (ax1, ax2, ax3) = Canvas.subplots(nrows=1, ncols=3)
ax1.semilogx(x, np.sin(x) + 2)
ax2.semilogy(x, np.exp(x / 4))
ax3.loglog(x, x**2)
ax1.set_title("semilogx")
ax2.set_title("semilogy")
ax3.set_title("loglog")
canvas.show()
[3]:
(<Figure size 640x480 with 3 Axes>,
 array([[<Axes: title={'center': 'semilogx'}>,
         <Axes: title={'center': 'semilogy'}>,
         <Axes: title={'center': 'loglog'}>]], dtype=object))
Axis limits, modes, and autoscaling
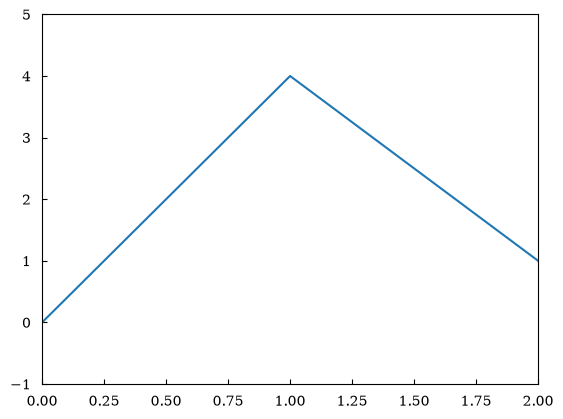
axis() accepts Matplotlib-style modes such as "equal", "tight", and "off", or a four-value [xmin, xmax, ymin, ymax] limit list. relim() and autoscale_view() recompute the visible limits from plotted data.
[4]:
canvas = Canvas()
canvas.plot([0, 1, 2], [0, 4, 1])
canvas.axis([0, 2, -1, 5])
canvas.relim()
canvas.autoscale_view(tight=True)
canvas.show()
[4]:
(<Figure size 640x480 with 1 Axes>, array([[<Axes: >]], dtype=object))
Secondary x- and y-axes
Secondary axes use forward and inverse functions. They are currently rendered by the Matplotlib backend.
[5]:
canvas = Canvas()
canvas.plot(x, x**2)
canvas.set_xlabel("distance (m)")
canvas.set_ylabel("area (m²)")
canvas.secondary_xaxis(
    "top",
    functions=(lambda value: value / 1000, lambda value: value * 1000),
    label="distance (km)",
)
canvas.secondary_yaxis(
    "right", functions=(np.sqrt, lambda value: value**2), label="length (m)"
)
canvas.show()
/home/runner/.local/lib/python3.12/site-packages/matplotlib/axes/_secondary_axes.py:263: RuntimeWarning: invalid value encountered in sqrt
  lims = self._functions[0](np.array(lims))
---------------------------------------------------------------------------
ValueError                                Traceback (most recent call last)
File ~/.local/lib/python3.12/site-packages/matplotlib/backend_bases.py:2257, in FigureCanvasBase.print_figure(self, filename, dpi, facecolor, edgecolor, orientation, format, bbox_inches, pad_inches, bbox_extra_artists, backend, **kwargs)
   2254     # we do this instead of `self.figure.draw_without_rendering`
   2255     # so that we can inject the orientation
   2256     with getattr(renderer, "_draw_disabled", nullcontext)():
-> 2257         self.figure.draw(renderer)
   2258 else:
   2259     renderer = None

File ~/.local/lib/python3.12/site-packages/matplotlib/artist.py:94, in _finalize_rasterization.<locals>.draw_wrapper(artist, renderer, *args, **kwargs)
     92 @wraps(draw)
     93 def draw_wrapper(artist, renderer, *args, **kwargs):
---> 94     result = draw(artist, renderer, *args, **kwargs)
     95     if renderer._rasterizing:
     96         renderer.stop_rasterizing()

File ~/.local/lib/python3.12/site-packages/matplotlib/artist.py:71, in allow_rasterization.<locals>.draw_wrapper(artist, renderer)
     68     if artist.get_agg_filter() is not None:
     69         renderer.start_filter()
---> 71     return draw(artist, renderer)
     72 finally:
     73     if artist.get_agg_filter() is not None:

File ~/.local/lib/python3.12/site-packages/matplotlib/figure.py:3271, in Figure.draw(self, renderer)
   3267     return
   3269 with self._render_lock:
-> 3271     artists = self._get_draw_artists(renderer)
   3272     try:
   3273         renderer.open_group('figure', gid=self.get_gid())

File ~/.local/lib/python3.12/site-packages/matplotlib/figure.py:171, in FigureBase._get_draw_artists(self, renderer)
    169         if hasattr(child, 'apply_aspect'):
    170             locator = child.get_axes_locator()
--> 171             child.apply_aspect(
    172                 locator(child, renderer) if locator else None)
    173 return artists

File ~/.local/lib/python3.12/site-packages/matplotlib/axes/_secondary_axes.py:146, in SecondaryAxis.apply_aspect(self, position)
    144 def apply_aspect(self, position=None):
    145     # docstring inherited.
--> 146     self._set_lims()
    147     super().apply_aspect(position)

File ~/.local/lib/python3.12/site-packages/matplotlib/axes/_secondary_axes.py:268, in SecondaryAxis._set_lims(self)
    265 if neworder != order:
    266     # Flip because the transform will take care of the flipping.
    267     lims = lims[::-1]
--> 268 set_lim(lims)

File ~/.local/lib/python3.12/site-packages/matplotlib/axes/_base.py:4241, in _AxesBase.set_ylim(self, bottom, top, emit, auto, ymin, ymax)
   4239         raise TypeError("Cannot pass both 'top' and 'ymax'")
   4240     top = ymax
-> 4241 return self.yaxis._set_lim(bottom, top, emit=emit, auto=auto)

File ~/.local/lib/python3.12/site-packages/matplotlib/axis.py:1264, in Axis._set_lim(self, v0, v1, emit, auto)
   1262 self.axes._process_unit_info([(name, (v0, v1))], convert=False)
   1263 v0 = self.axes._validate_converted_limits(v0, self.convert_units)
-> 1264 v1 = self.axes._validate_converted_limits(v1, self.convert_units)
   1266 if v0 is None or v1 is None:
   1267     # Axes init calls set_xlim(0, 1) before get_xlim() can be called,
   1268     # so only grab the limits if we really need them.
   1269     old0, old1 = self.get_view_interval()

File ~/.local/lib/python3.12/site-packages/matplotlib/axes/_base.py:3913, in _AxesBase._validate_converted_limits(self, limit, convert)
   3910     converted_limit = converted_limit.squeeze()
   3911 if (isinstance(converted_limit, Real)
   3912         and not np.isfinite(converted_limit)):
-> 3913     raise ValueError("Axis limits cannot be NaN or Inf")
   3914 return converted_limit

ValueError: Axis limits cannot be NaN or Inf
<Figure size 640x480 with 1 Axes>
[5]:
(<Figure size 640x480 with 1 Axes>,
 array([[<Axes: xlabel='distance (m)', ylabel='area (m²)'>]], dtype=object))
Box aspect and explicit tick labels
[6]:
canvas = Canvas()
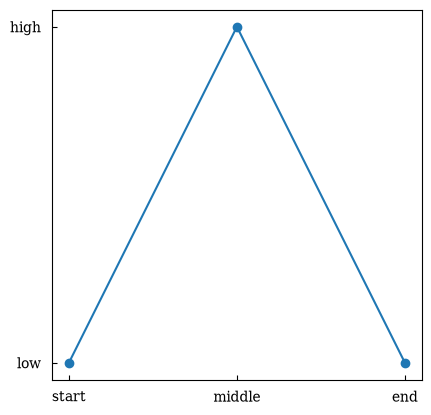
canvas.plot([0, 1, 2], [0, 1, 0], marker="o")
canvas.set_box_aspect(1)
canvas.set_xticks([0, 1, 2])
canvas.set_xticklabels(["start", "middle", "end"], rotation=25, color="navy")
canvas.set_yticks([0, 1])
canvas.set_yticklabels(["low", "high"], fontweight="bold")
canvas.show()
[6]:
(<Figure size 640x480 with 1 Axes>, array([[<Axes: >]], dtype=object))
Plotly rendering
The filled polygon, logarithmic scales, axis modes, box aspect, and tick labels also work with Plotly. Secondary axes currently require Matplotlib.
[7]:
plotly_canvas = Canvas()
plotly_canvas.fill(x, np.sin(x) + 2, color="purple", alpha=0.25)
plotly_canvas.loglog(x, x**2, color="black")
plotly_canvas.set_xticklabels(["small", "medium", "large"], color="darkgreen")
plotly_canvas.show(backend="plotly")
Data type cannot be displayed: application/vnd.plotly.v1+json