Tutorial 04 – Styling
maxplotlib passes matplotlib kwargs directly to the underlying renderer, so every colour, linestyle, marker, and alpha option you know from matplotlib works here too.
[1]:
from maxplotlib import Canvas
import numpy as np
Backend selection
All examples in this tutorial use the same Canvas API; you can switch rendering backends at any time:
BACKEND = "matplotlib"for static Matplotlib outputBACKEND = "plotly"for interactive Plotly output (Jupyter-friendly)
Most cells end with canvas.show(backend=BACKEND) so you can re-run the whole notebook with a different backend.
[2]:
# Change to "plotly" for interactive output
BACKEND = "matplotlib"
1 · Colors
Named colors, hex strings, and RGB tuples are all accepted.
[3]:
x = np.linspace(0, 2 * np.pi, 200)

canvas, ax = Canvas.subplots(width="10cm", ratio=0.6)

ax.plot(x, np.sin(x), color="steelblue", label="named: steelblue")
ax.plot(x, np.sin(x - 0.5), color="#e74c3c", label="hex: #e74c3c")
ax.plot(x, np.sin(x - 1.0), color=(0.2, 0.7, 0.3), label="RGB tuple")

ax.set_xlabel("x")
ax.set_ylabel("y")
ax.set_title("Color options")
ax.set_legend(True)
canvas.show(backend=BACKEND)
[3]:
(<Figure size 393.701x236.22 with 1 Axes>,
 array([[<Axes: title={'center': 'Color options'}, xlabel='x', ylabel='y'>]],
       dtype=object))
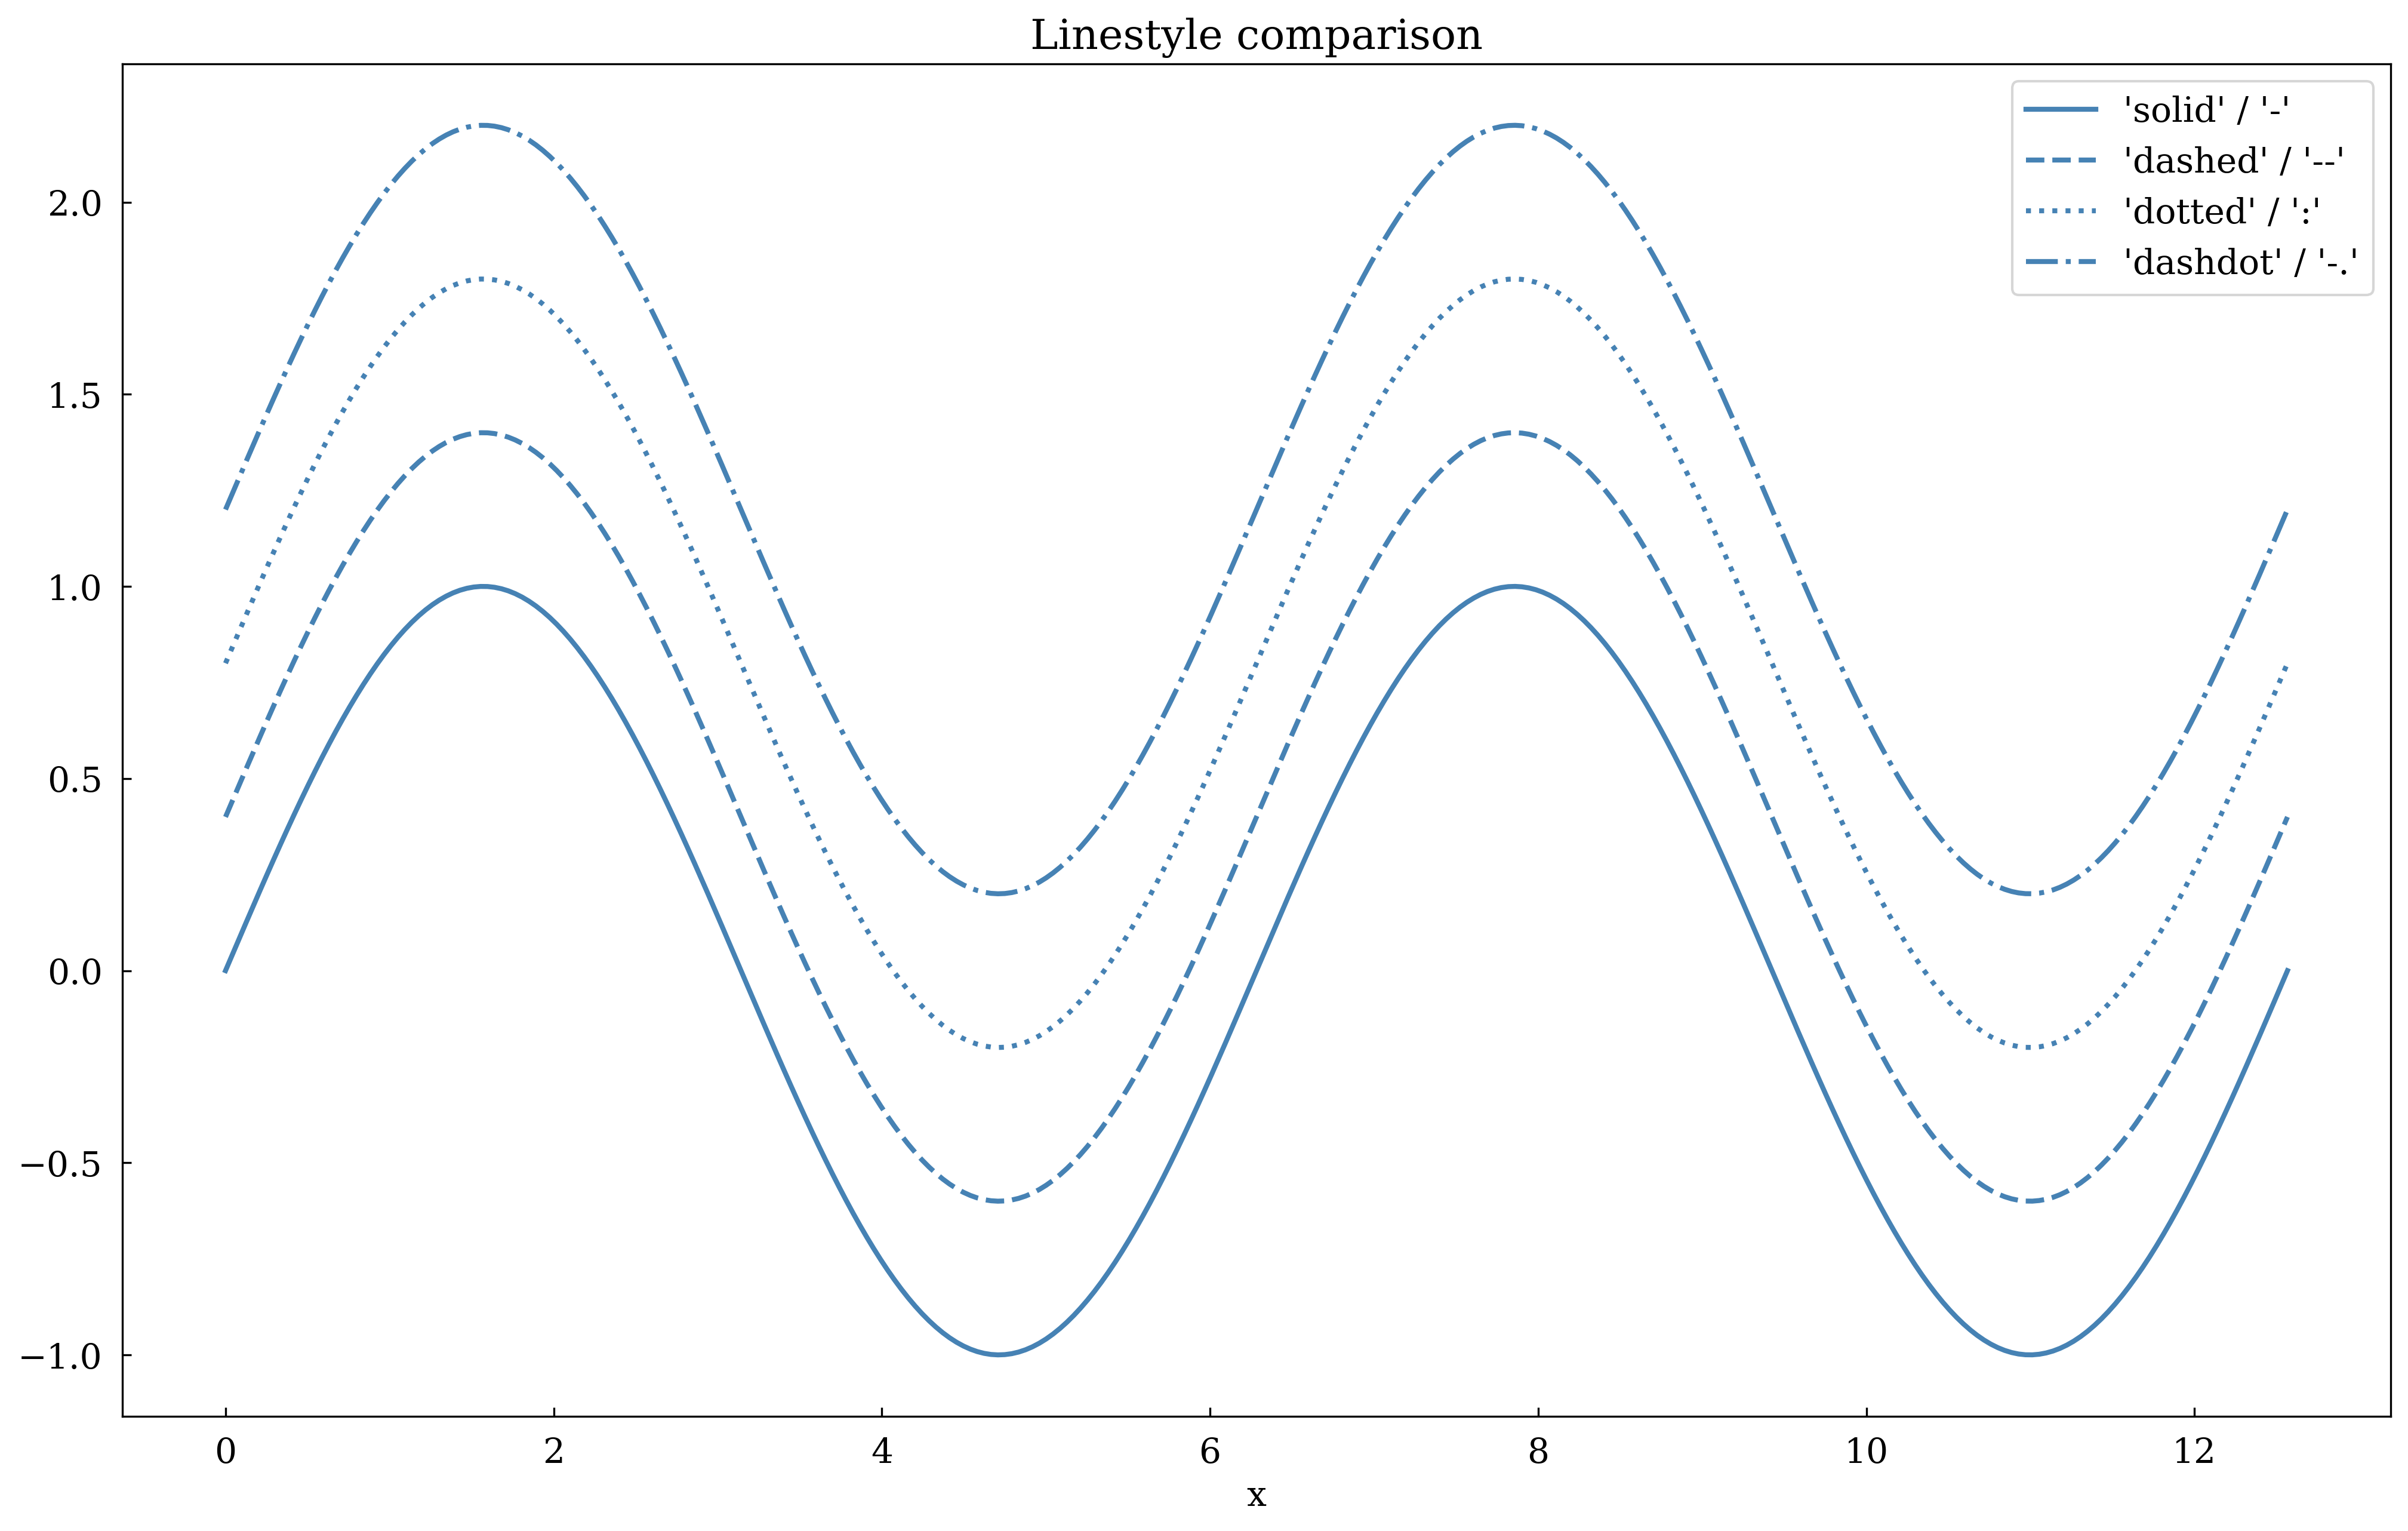
2 · Linestyles
Use long names ('solid', 'dashed', 'dotted', 'dashdot') or short aliases ('-', '--', ':', '-.').
[4]:
x = np.linspace(0, 4 * np.pi, 300)
styles = [("solid", "-"), ("dashed", "--"), ("dotted", ":"), ("dashdot", "-.")]

canvas, ax = Canvas.subplots(width="10cm", ratio=0.6)

for i, (name, ls) in enumerate(styles):
    ax.plot(
        x,
        np.sin(x) + i * 0.4,
        linestyle=ls,
        linewidth=2,
        color="steelblue",
        label=f"{name!r} / {ls!r}",
    )

ax.set_xlabel("x")
ax.set_title("Linestyle comparison")
ax.set_legend(True)
canvas.show(backend=BACKEND)
[4]:
(<Figure size 393.701x236.22 with 1 Axes>,
 array([[<Axes: title={'center': 'Linestyle comparison'}, xlabel='x'>]],
       dtype=object))
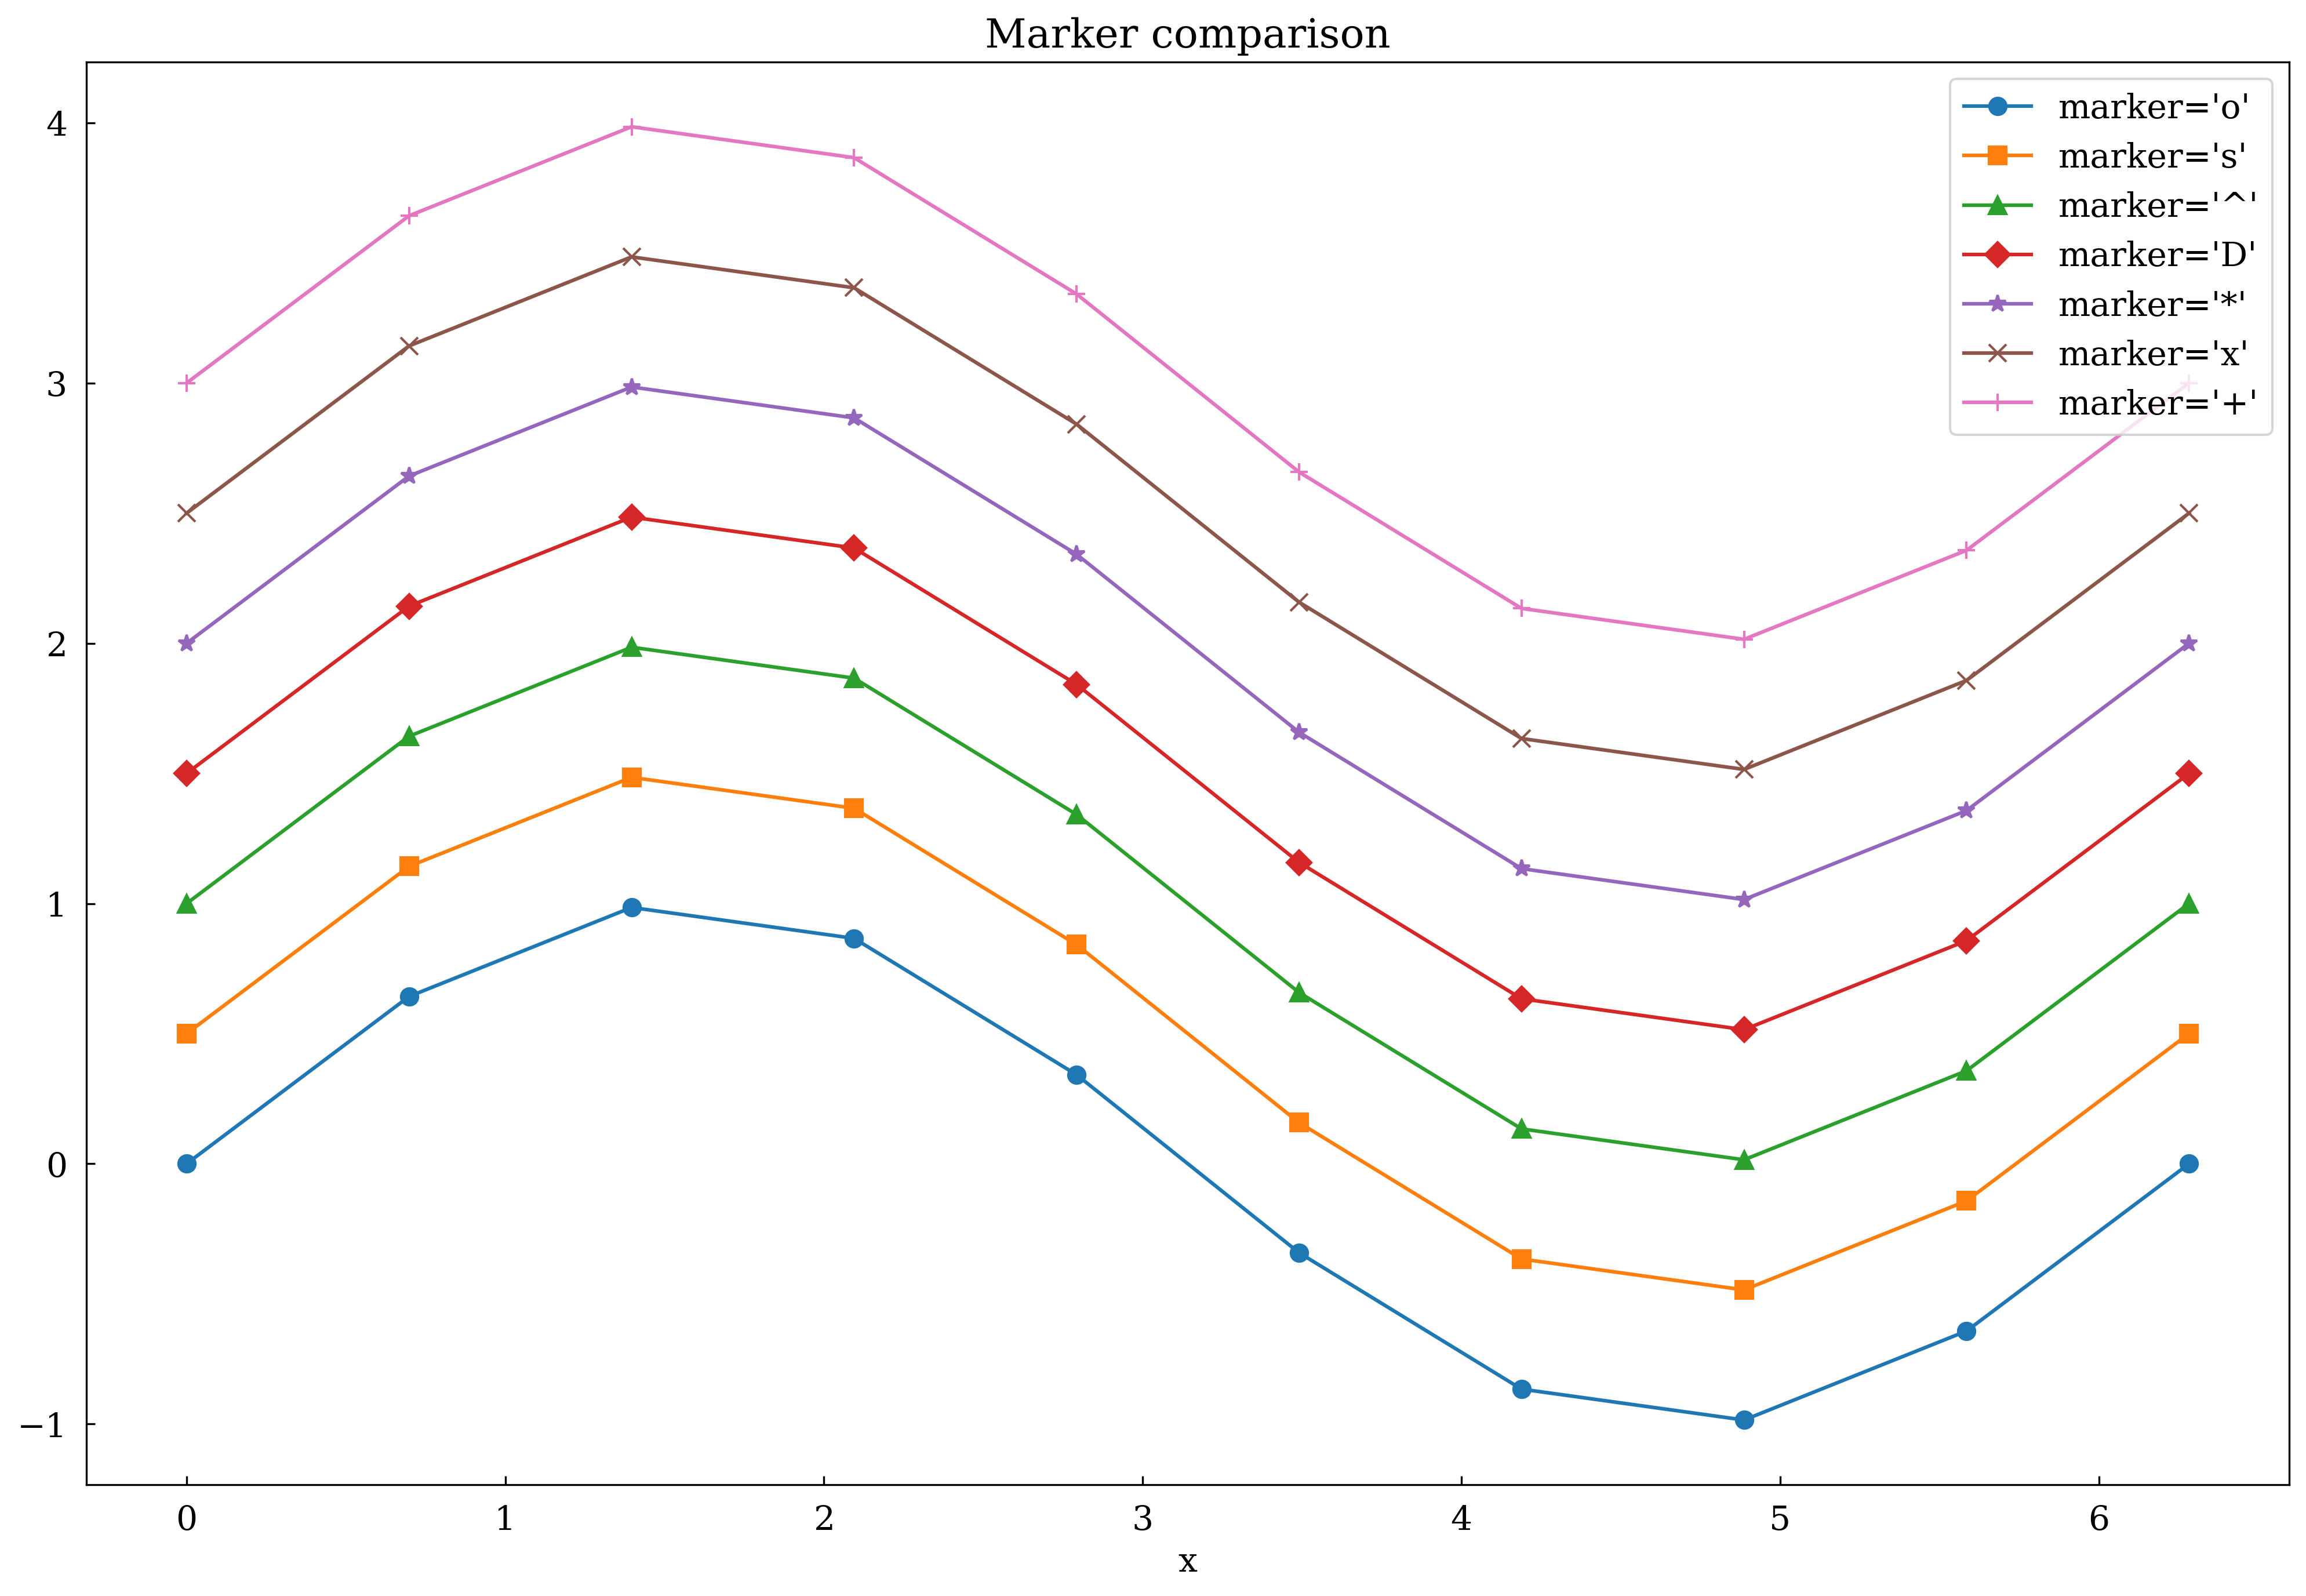
3 · Markers
Pass marker= to ax.plot or ax.scatter.
[5]:
x = np.linspace(0, 2 * np.pi, 10)
markers = ["o", "s", "^", "D", "*", "x", "+"]

canvas, ax = Canvas.subplots(width="10cm", ratio=0.65)

for i, m in enumerate(markers):
    ax.plot(
        x,
        np.sin(x) + i * 0.5,
        marker=m,
        linestyle="-",
        markersize=7,
        label=f"marker={m!r}",
    )

ax.set_xlabel("x")
ax.set_title("Marker comparison")
ax.set_legend(True)
canvas.show(backend=BACKEND)
[5]:
(<Figure size 393.701x255.906 with 1 Axes>,
 array([[<Axes: title={'center': 'Marker comparison'}, xlabel='x'>]],
       dtype=object))
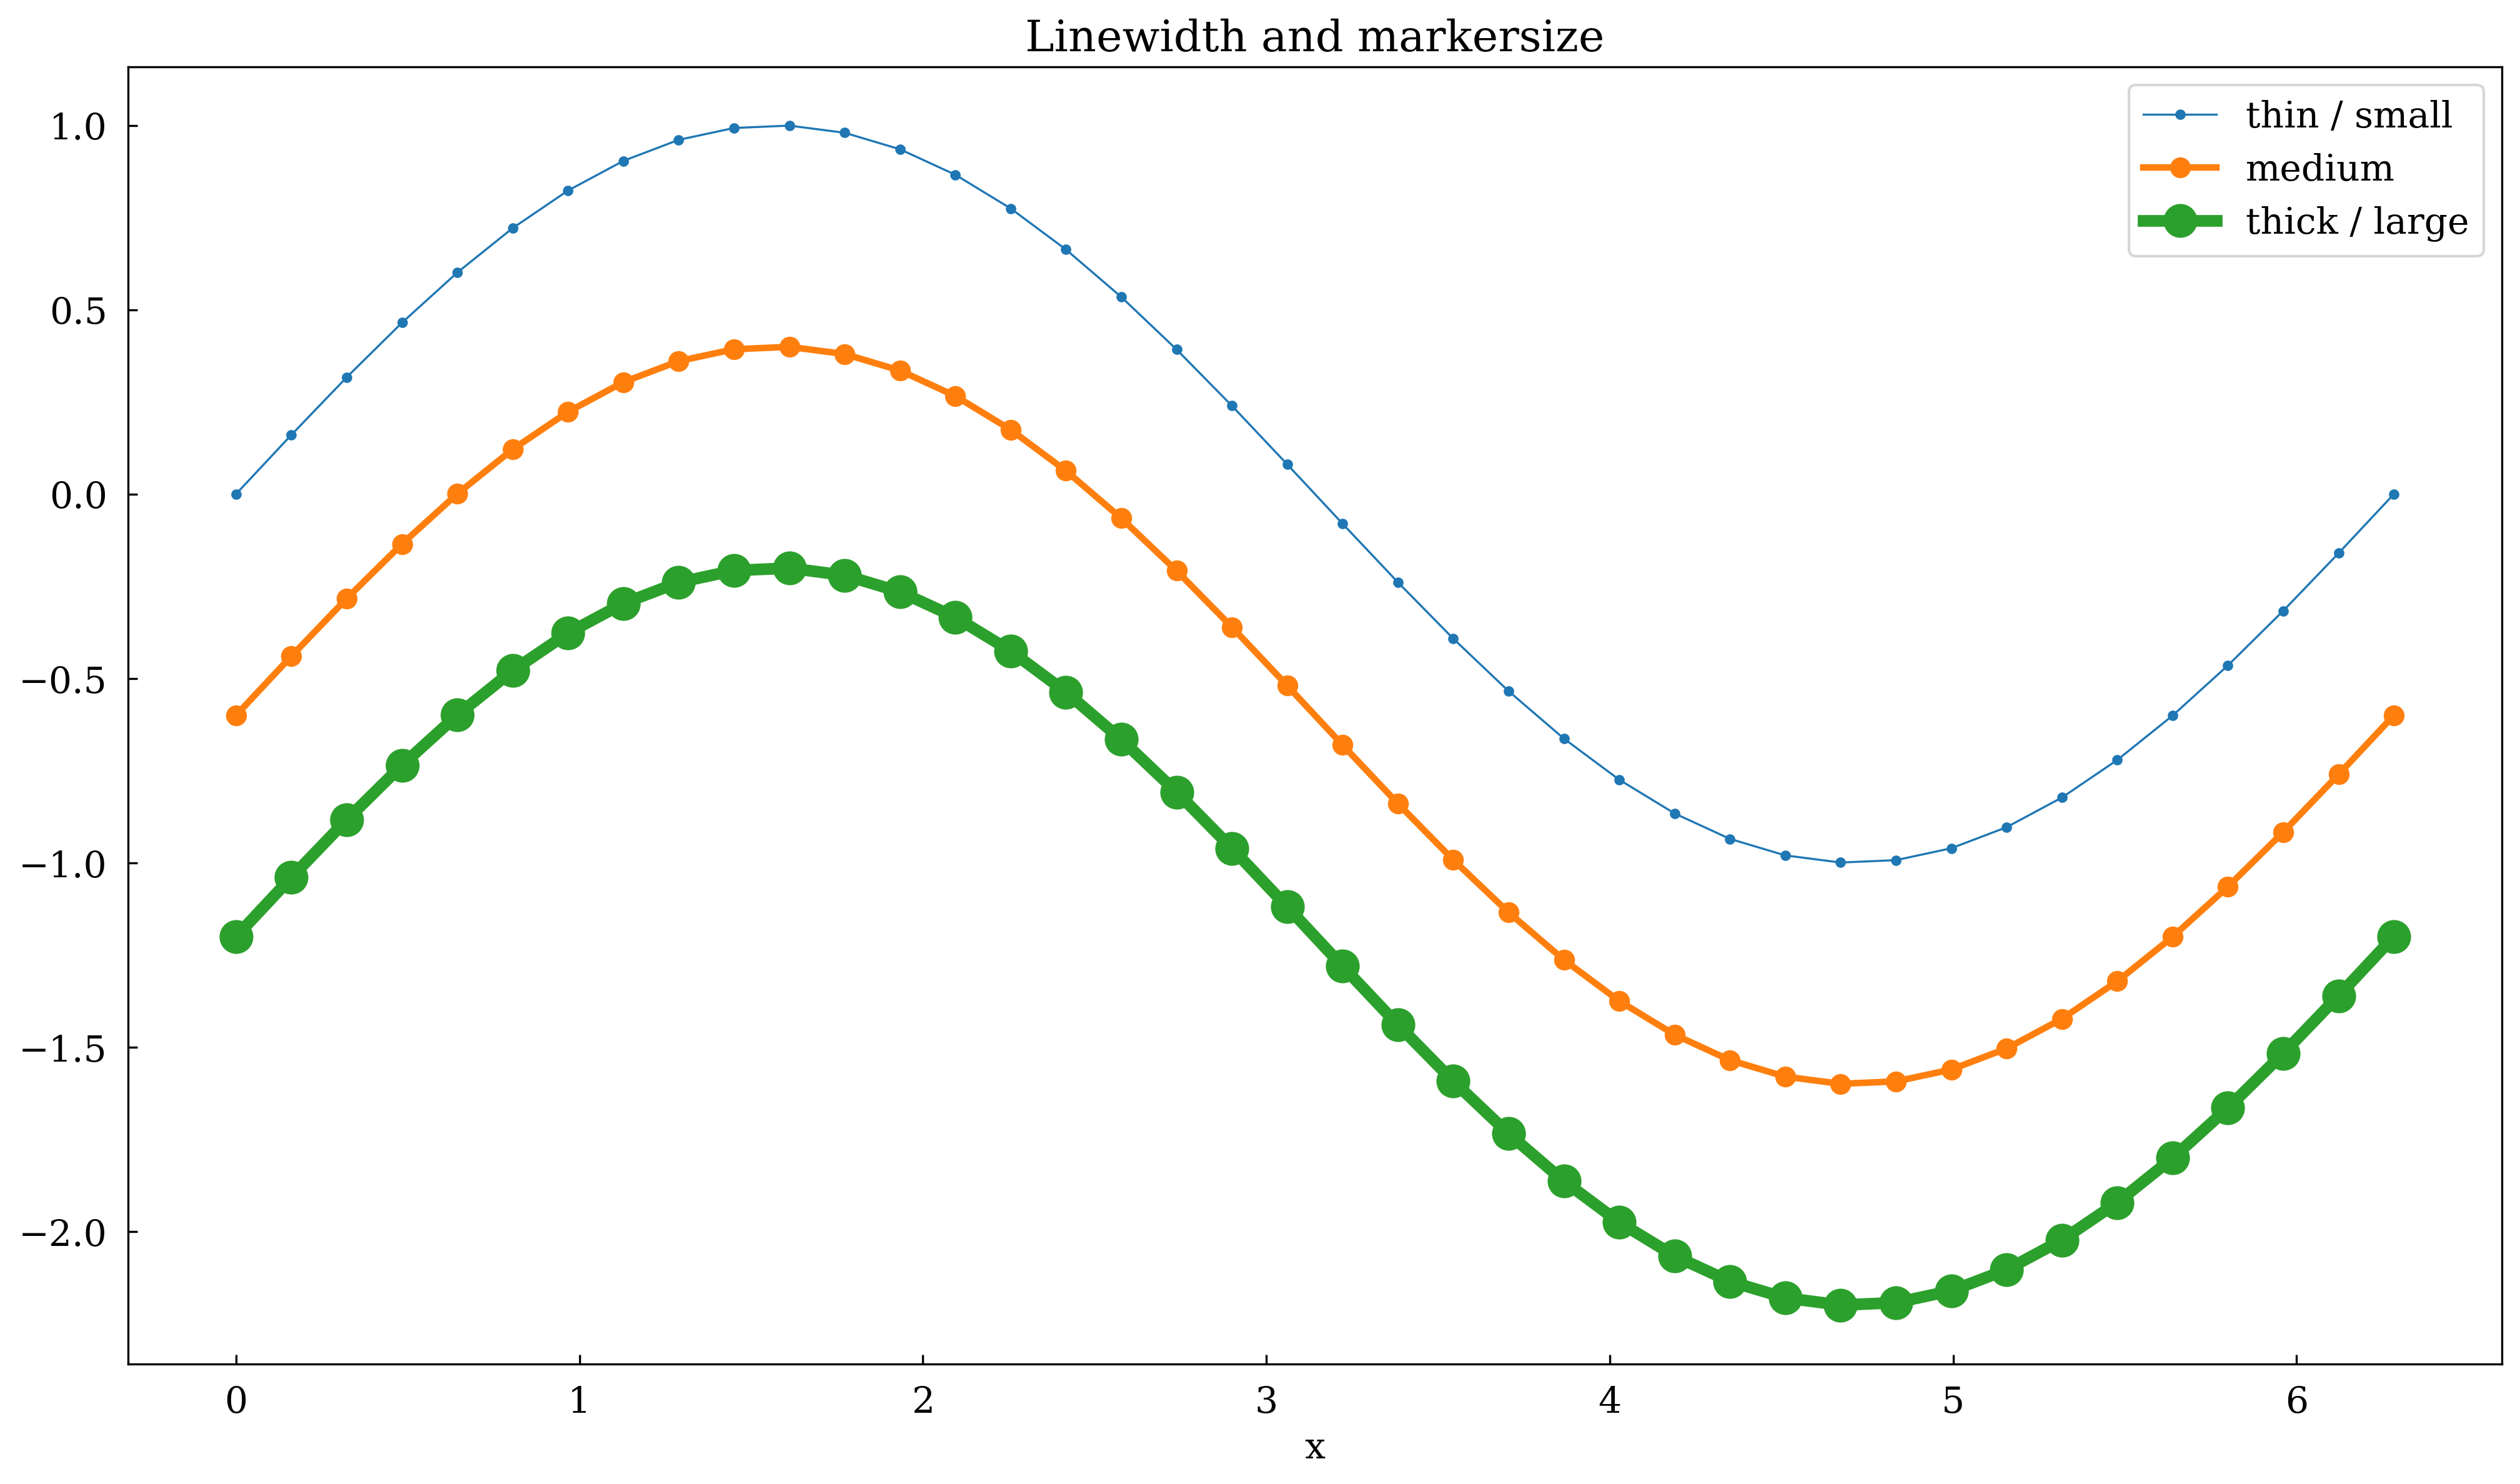
4 · Linewidth and markersize
Control visual weight with linewidth= and markersize=.
[6]:
x = np.linspace(0, 2 * np.pi, 40)

canvas, ax = Canvas.subplots(width="10cm", ratio=0.55)

ax.plot(x, np.sin(x), linewidth=0.8, marker="o", markersize=3, label="thin / small")
ax.plot(x, np.sin(x) - 0.6, linewidth=2.5, marker="o", markersize=7, label="medium")
ax.plot(
    x, np.sin(x) - 1.2, linewidth=4.5, marker="o", markersize=12, label="thick / large"
)

ax.set_xlabel("x")
ax.set_title("Linewidth and markersize")
ax.set_legend(True)
canvas.show(backend=BACKEND)
[6]:
(<Figure size 393.701x216.535 with 1 Axes>,
 array([[<Axes: title={'center': 'Linewidth and markersize'}, xlabel='x'>]],
       dtype=object))
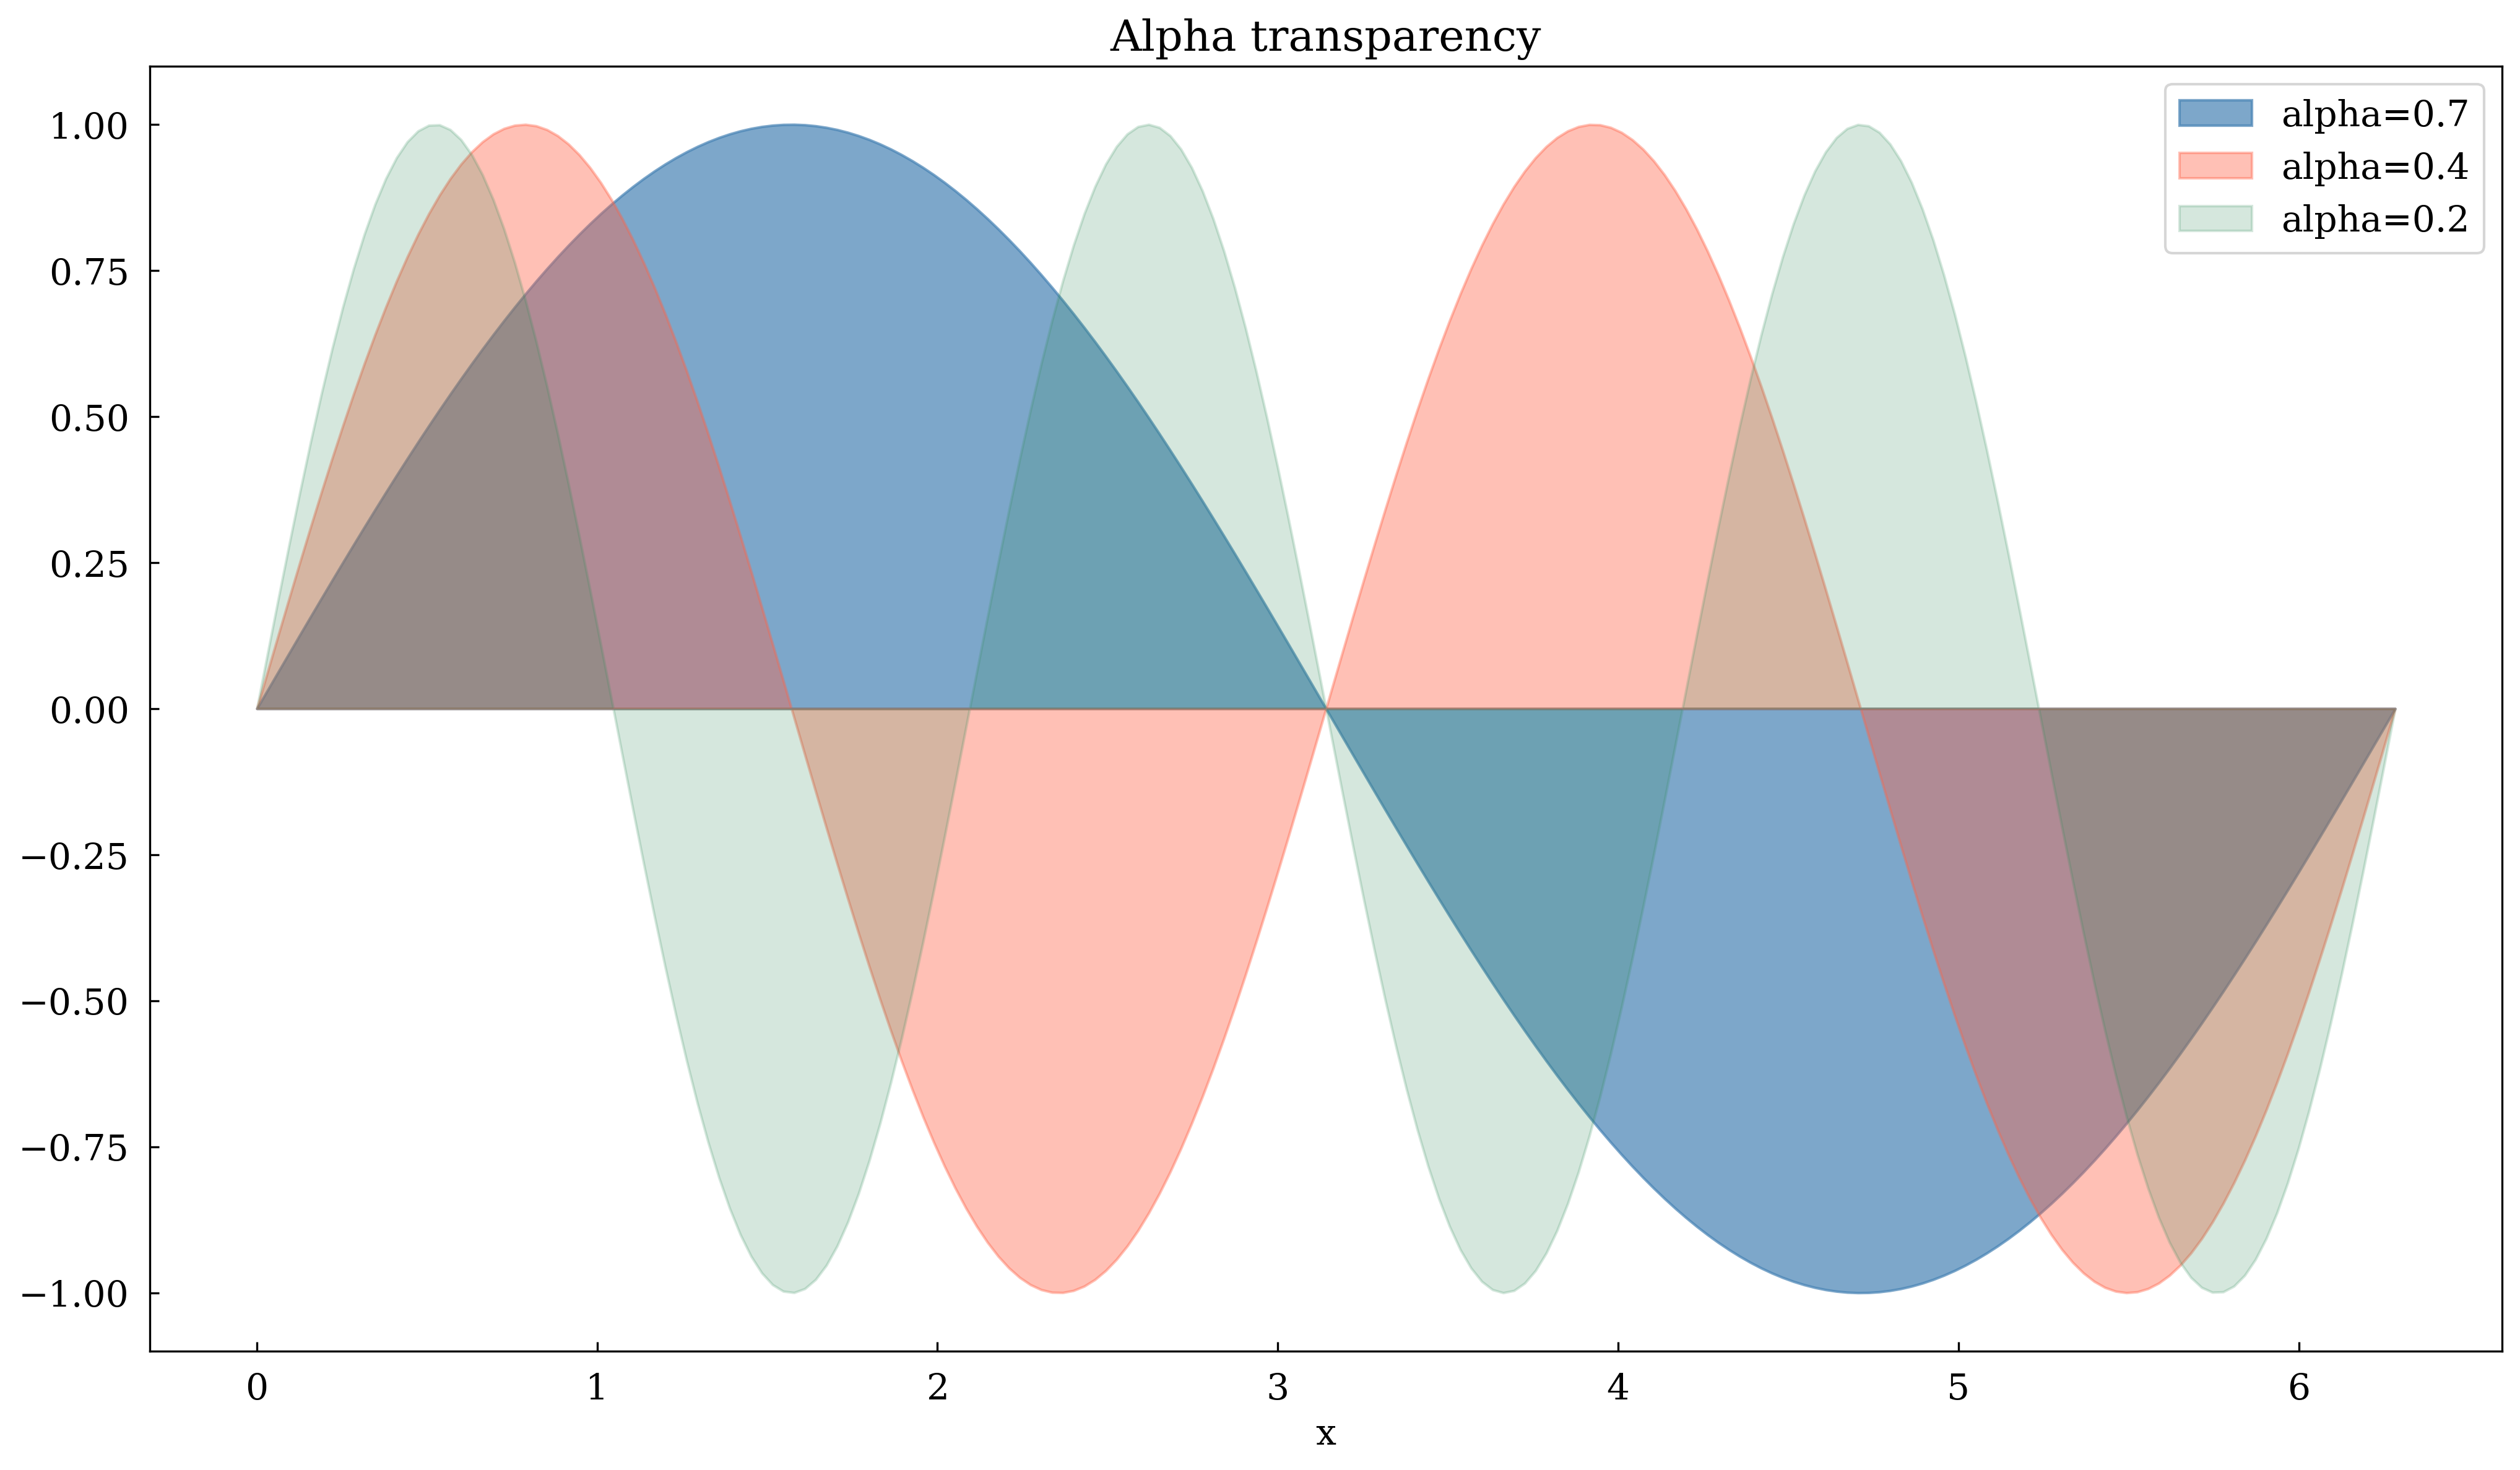
5 · Alpha (transparency)
alpha= ranges from 0 (invisible) to 1 (opaque). Useful for overlapping fill_between regions.
[7]:
x = np.linspace(0, 2 * np.pi, 200)

canvas, ax = Canvas.subplots(width="10cm", ratio=0.55)

ax.fill_between(x, np.sin(x), 0, alpha=0.7, color="steelblue", label="alpha=0.7")
ax.fill_between(x, np.sin(2 * x), 0, alpha=0.4, color="tomato", label="alpha=0.4")
ax.fill_between(x, np.sin(3 * x), 0, alpha=0.2, color="seagreen", label="alpha=0.2")

ax.set_xlabel("x")
ax.set_title("Alpha transparency")
ax.set_legend(True)
canvas.show(backend=BACKEND)
[7]:
(<Figure size 393.701x216.535 with 1 Axes>,
 array([[<Axes: title={'center': 'Alpha transparency'}, xlabel='x'>]],
       dtype=object))
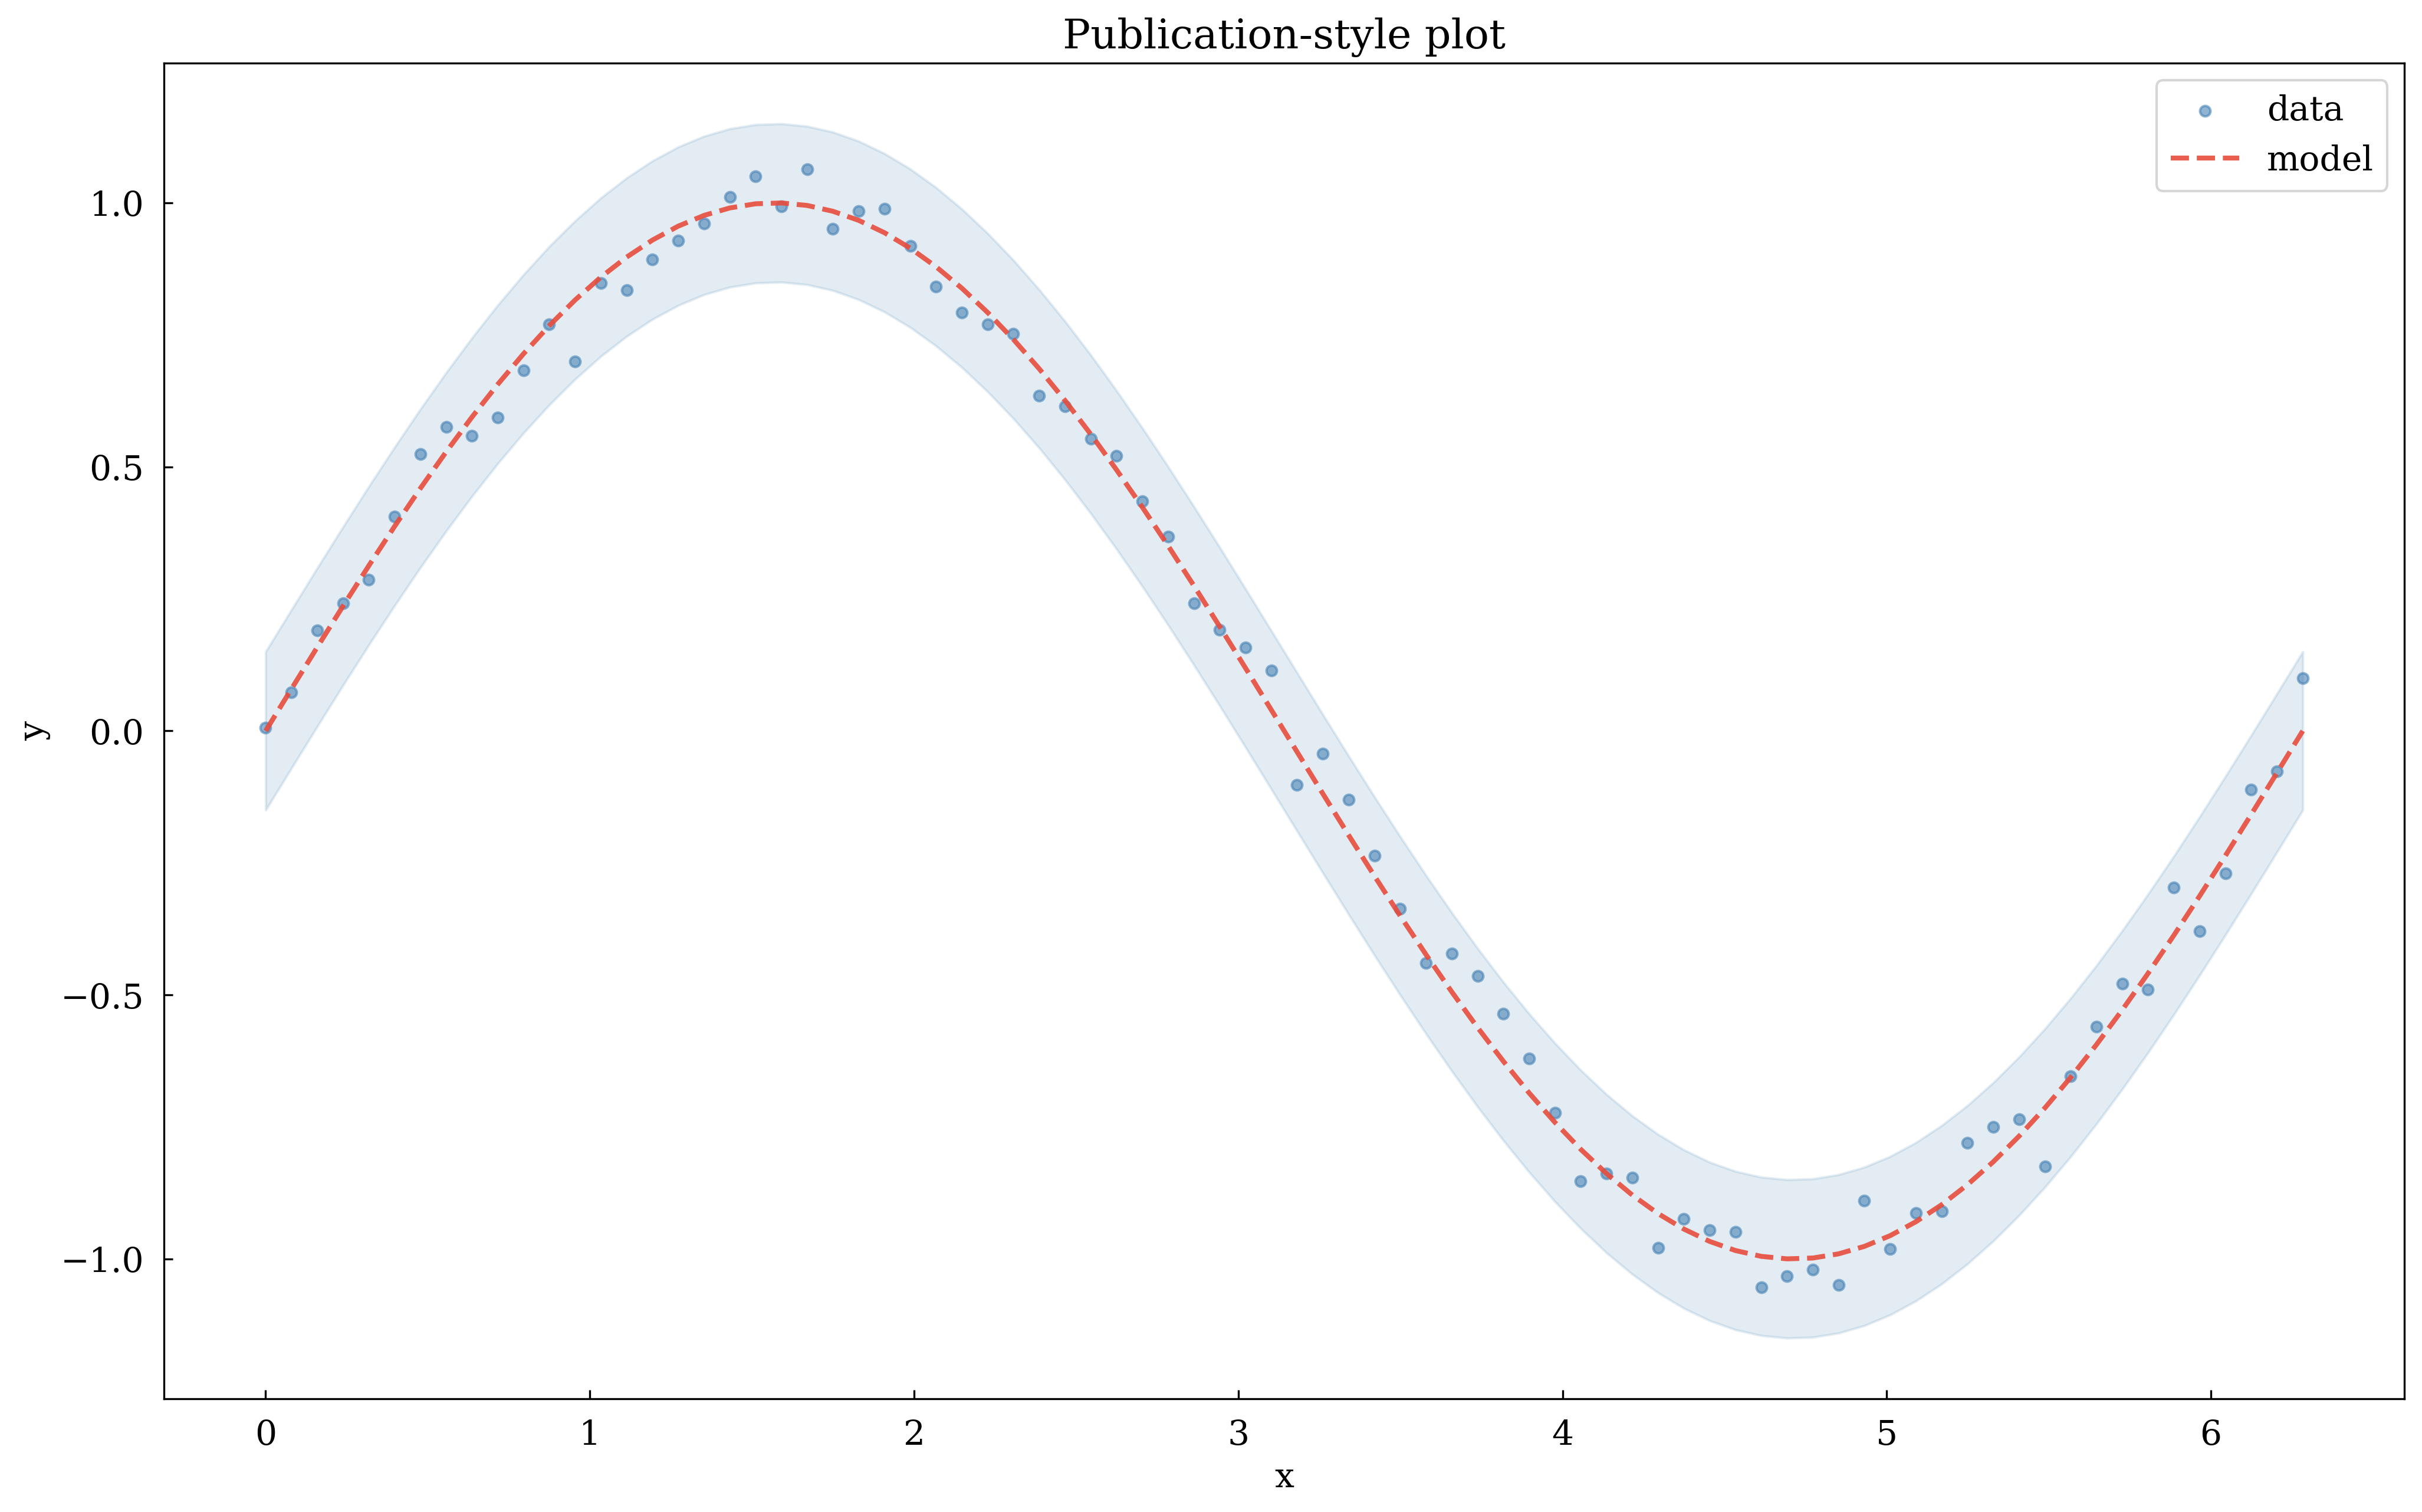
6 · Combining styles – a publication-ready plot
Combine color, linestyle, marker, linewidth, and alpha in one plot.
[8]:
x = np.linspace(0, 2 * np.pi, 80)
noise = np.random.default_rng(0).normal(0, 0.05, len(x))

canvas, ax = Canvas.subplots(width="10cm", ratio=0.6)

# Shaded uncertainty band
ax.fill_between(x, np.sin(x) - 0.15, np.sin(x) + 0.15, alpha=0.15, color="steelblue")

# Noisy data
ax.scatter(
    x, np.sin(x) + noise, color="steelblue", marker="o", s=18, alpha=0.6, label="data"
)

# Clean model
ax.plot(
    x,
    np.sin(x),
    color="#e74c3c",
    linestyle="dashed",
    linewidth=2.0,
    alpha=0.9,
    label="model",
)

ax.set_xlabel("x")
ax.set_ylabel("y")
ax.set_title("Publication-style plot")
ax.set_legend(True)
canvas.show(backend=BACKEND)

[8]:
(<Figure size 393.701x236.22 with 1 Axes>,
 array([[<Axes: title={'center': 'Publication-style plot'}, xlabel='x', ylabel='y'>]],
       dtype=object))
Summary
Option |
Example |
|---|---|
Named color |
|
Hex color |
|
RGB tuple |
|
Linestyle |
|
Marker |
|
Linewidth |
|
Markersize |
|
Transparency |
|