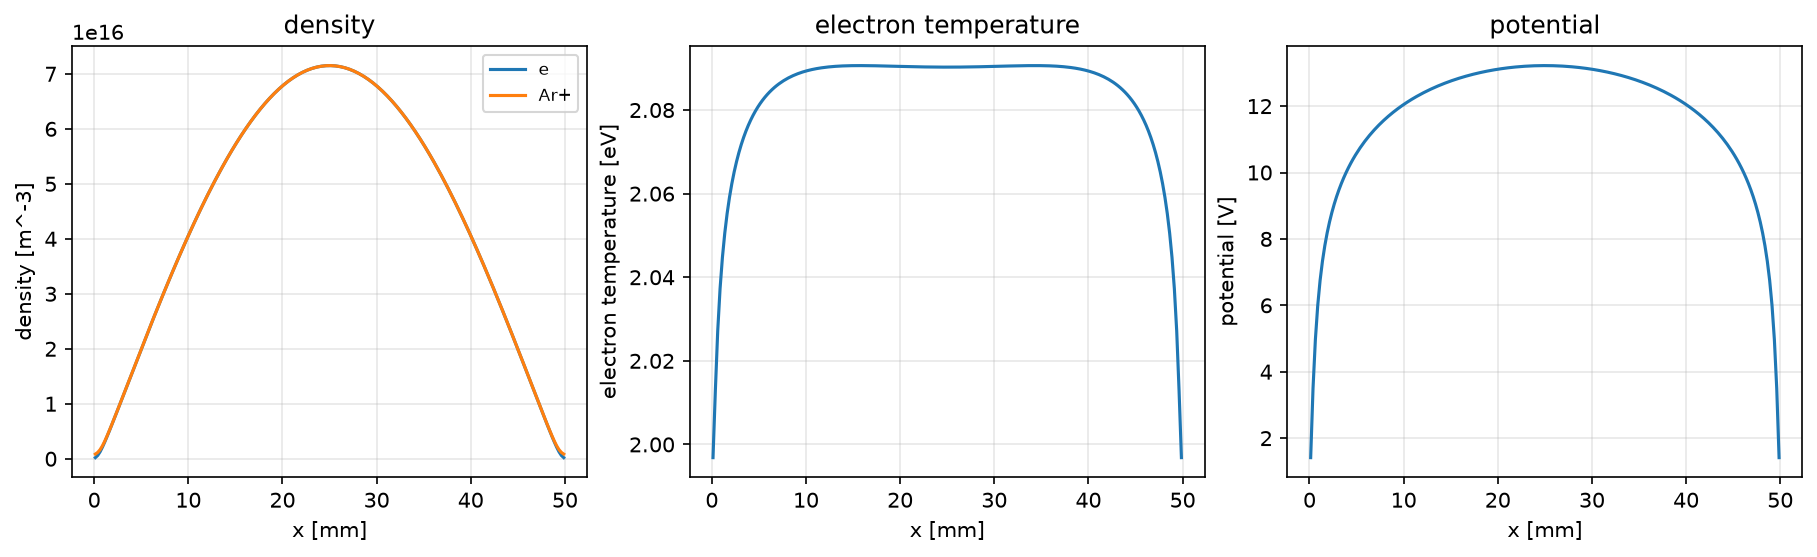
A 1D argon discharge between two grounded walls: profiles from the fluid model.
Electrons and ions drift and diffuse in their own field (Poisson’s equation),
the electrons are heated uniformly and lose energy in ionization, which sustains
the plasma against the losses to the walls. The plasma sits a few electron
temperatures above the walls, with a sheath at each. The transport coefficients
and the step cross section are illustrative, not argon data. The steady state is
an xarray dataset (state.to_dataset()), plotted with plasma-plots.
Python source
Section titled “Python source”"""A 1D argon discharge between two grounded walls: profiles from the fluid model.
Electrons and ions drift and diffuse in their own field (Poisson's equation),the electrons are heated uniformly and lose energy in ionization, which sustainsthe plasma against the losses to the walls. The plasma sits a few electrontemperatures above the walls, with a sheath at each. The transport coefficientsand the step cross section are illustrative, not argon data. The steady state isan xarray dataset (``state.to_dataset()``), plotted with plasma-plots."""
import numpy as npimport plasma_plotsfrom plasmacoll import CrossSectionfrom plasmacoll.constants import ELECTRON_MASS
from wellbalanced import ELECTRON, Fluid1D, FluidSpecies, Reaction, Species
argon_ion = Species.atomic("Ar+", 39.948, 1)ionization = Reaction.from_cross_section( ("e", "Ar"), ("e", "e", "Ar+"), CrossSection.constant(2.0e-20, threshold=15.76), ELECTRON_MASS, electron_energy_loss=15.76, name="ionization",)length = 0.05model = Fluid1D( species=[ FluidSpecies(ELECTRON, mobility=1.0e3), FluidSpecies(argon_ion, mobility=10.0), ], reactions=[ionization], length=length, cells=200, fixed={"Ar": 1.0e21}, heating=2.0e4, # W/m^3)guess = 1.0e15 * np.sin(np.pi * model.x / length) + 1.0e12state = model.steady_state(model.pack({"e": guess, "Ar+": guess}, 3.0, 0.0))print(f"converged: {state.converged}")print( "energy balance (eV m^-2 s^-1):", {k: f"{v:.3e}" for k, v in model.energy_balance(state).items()},)
profiles = state.to_dataset()profiles = profiles.assign_coords(x=profiles.x * 1e3)profiles.x.attrs.update(long_name="x", units="mm")with plasma_plots.figure(1, 3, figsize=(12, 3.6)) as fig: profiles.density.plasma.plot.profiles(x="x", over="species", ax=fig[0]) profiles.electron_temperature.plasma.plot.lineout(ax=fig[1]) profiles.potential.plasma.plot.lineout(ax=fig[2])