Parallel grids
Inspect the MPI decomposition of a structured grid. The first example runs on one process; the same constructor accepts an MPI communicator for parallel runs.
Decomposition metadata
Section titled “Decomposition metadata”Choose which axes may be split with domain_decomposition. On one process, the index bounds cover the full grid. num_ghost_points adds ghost nodes on both sides of each local axis.
from simgeometry.grid import Grid
grid = Grid(    ndim=2,    lower_bound=(0.0, 0.0),    upper_bound=(1.0, 1.0),    num_gridpoints=(18, 12),    domain_decomposition=(True, False),    num_ghost_points=1,    periodic=(True, False),)print("rank:", grid.mpi_rank)print("process grid:", grid.proc_sizes)print("global index bounds:", grid.proc_index_bounds)print("local shape with ghosts:", grid.num_gridpoints_local_with_ghosts)
rank: 0process grid: [1, 1]global index bounds: [(0, 18), (0, 12)]local shape with ghosts: (20, 14)For a multi-process run, install simgeometry[mpi], pass comm=MPI.COMM_WORLD, and launch the script with mpiexec -n 4 python script.py:
from mpi4py import MPIfrom simgeometry.grid import Grid
grid = Grid(    ndim=2,    lower_bound=(0.0, 0.0),    upper_bound=(1.0, 1.0),    num_gridpoints=(18, 12),    comm=MPI.COMM_WORLD,    domain_decomposition=(True, True),    num_ghost_points=1,)print(grid.mpi_rank, grid.proc_index_bounds, grid.num_gridpoints_local)
proc_index_bounds contains half-open global index ranges. neighbor_ranks gives lower and upper neighbors per axis, using MPI.PROC_NULL at nonperiodic walls. grid.domain_decomposition_class.layout(shape, halo=...) returns a matching mpiarray.Layout for field arrays.
Preview a decomposition
Section titled “Preview a decomposition”Without a communicator there is one process, so the grid above is never split. DomainDecomposition.preview(size, ...) builds the decomposition a size-rank run would use, without MPI: the same processes per axis, index ranges and subdomains, for every rank. It is for inspection and planning; nothing communicates, and it has no array layout. proc_sizes= fixes the processes per axis instead of size.
from simgeometry.domain_decomposition import DomainDecomposition
lower, upper, nodes = (0.0, 0.0, 0.0), (2.0, 1.0, 1.0), (33, 17, 17)preview = DomainDecomposition.preview(8, decompose=[True, True, True])print("process grid:", preview.proc_sizes)for rank in range(preview.mpi_size):    print(        f"rank {rank}: coordinate {preview.get_proc_coord(rank)},",        f"nodes {preview.get_index_bounds(nodes, rank)}",    )print(    "owner of (1.5, 0.2, 0.9):",    preview.owner_rank_for_position((1.5, 0.2, 0.9), lower, upper, nodes),)
process grid: [2, 2, 2]rank 0: coordinate (0, 0, 0), nodes [(0, 17), (0, 9), (0, 9)]rank 1: coordinate (0, 0, 1), nodes [(0, 17), (0, 9), (9, 17)]rank 2: coordinate (0, 1, 0), nodes [(0, 17), (9, 17), (0, 9)]rank 3: coordinate (0, 1, 1), nodes [(0, 17), (9, 17), (9, 17)]rank 4: coordinate (1, 0, 0), nodes [(17, 33), (0, 9), (0, 9)]rank 5: coordinate (1, 0, 1), nodes [(17, 33), (0, 9), (9, 17)]rank 6: coordinate (1, 1, 0), nodes [(17, 33), (9, 17), (0, 9)]rank 7: coordinate (1, 1, 1), nodes [(17, 33), (9, 17), (9, 17)]owner of (1.5, 0.2, 0.9): 5subdomain_boxes(lower, upper, num_gridpoints) returns every rank’s (lower, upper) corners. show_3d draws them as translucent boxes, one colour per rank, with an optional shape inside (click Interactive 3-D view below the picture to rotate it). Rank 0 sits at the lower corner; ranks are numbered row-major, so the last axis changes fastest.
import plasma_plotsimport pyvista as pv
from simgeometry import Sphere
pv.OFF_SCREEN = True  # render without a window, e.g. on a docs server
plotter = preview.show_3d(    lower, upper, nodes, shape=Sphere((1.0, 0.5, 0.5), 0.35), display=False)plasma_plots.scene(    plotter, alt="Eight subdomains, one colour per rank, around a sphere")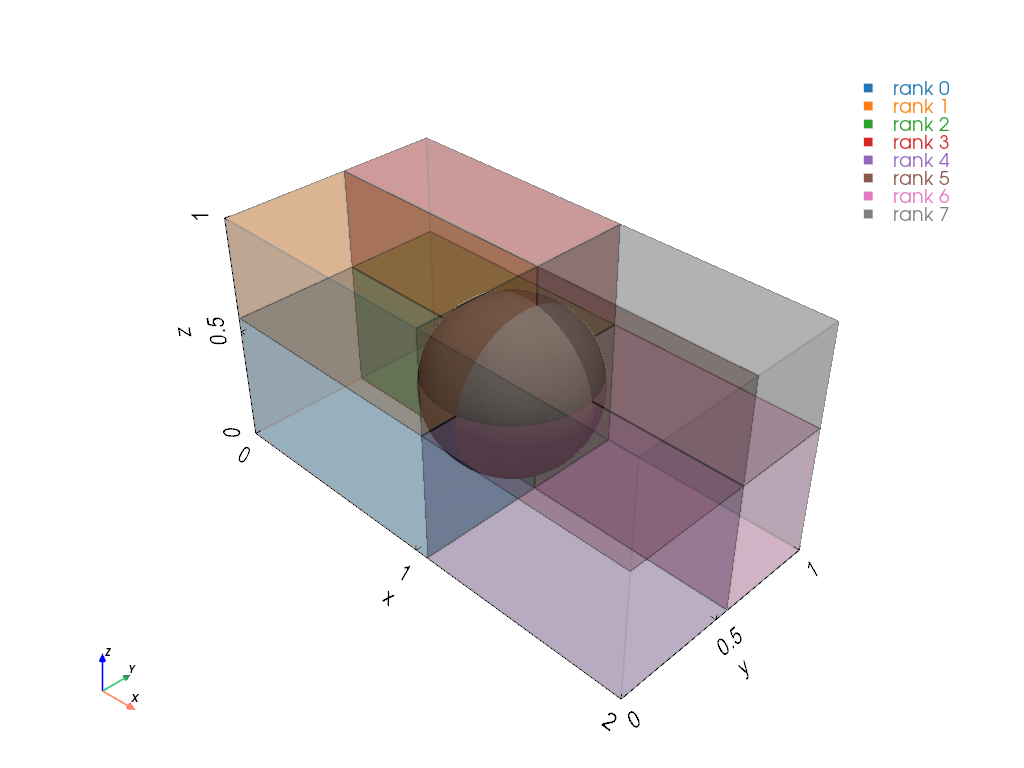
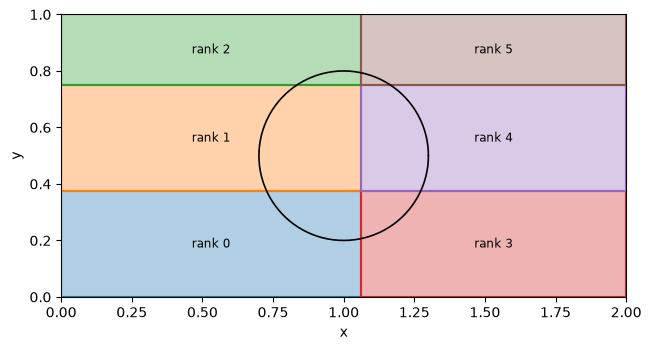
A 2D decomposition has a Matplotlib view, show: one rectangle per rank, with a shape outlined on top. Six ranks on a 2D grid make a 2 × 3 process grid.
from simgeometry import Circle
DomainDecomposition.preview(6, ndim=2).show(    (0.0, 0.0), (2.0, 1.0), (33, 17), shape=Circle((1.0, 0.5), 0.3));