Cut edges
Inspect the geometric input to a cut-cell solver: crossing positions, edge fractions, distances, object identity, and outward normals. Simgeometry computes geometry; Picnic applies its Shortley–Weller coefficients, boundary conditions and numerical minimum-distance clamp.
This notebook needs simgeometry[plot]. It does not solve a PDE. The companion Picnic cut-cell tutorial studies potential and electric-field accuracy.
import matplotlib.pyplot as pltimport numpy as np
from simgeometry import Circle, GeometryCollection, Gridfrom simgeometry.cut_edges import bracketed_edge_geometry
grid = Grid(ndim=2, lower_bound=(-1, -1), upper_bound=(1, 1), num_gridpoints=(17, 17))circle = Circle((0.03, 0.02), 0.37)geometry = GeometryCollection({"electrode": circle}, bounds=((-1, -1), (1, 1)))cuts = geometry.cut_edges(grid)assert cuts.exactassert set(cuts.object_names) == {"electrode"}np.testing.assert_allclose(    np.linalg.norm(cuts.points - np.array([[0.03], [0.02]]), axis=0), 0.37, atol=1e-10)ax = geometry.show(grid=grid, display=False)circle.plot(ax=ax, facecolor="none", edgecolor="black", linewidth=1)cuts.show(ax=ax, normals=True, display=False)ax.set_title("Exact circle crossings and outward normals")plt.show()print("Crossings:", len(cuts.fractions))print("First distances from lower edge nodes:", cuts.distances[:8])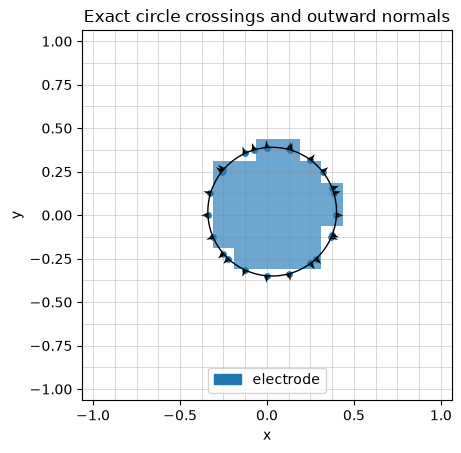
Crossings: 24First distances from lower edge nodes: [0.06459583 0.03554094 0.05021133 0.11517247 0.02701779 0.05071673 0.00928327 0.03298221]cut_edges() works on 3D grids too, and cuts.show_3d() draws the crossings over the translucent surface. Here a ball on a 9 × 9 × 9 grid: black points are the crossings on the grid edges, blue points the solid nodes (nodes=True), red arrows the outward normals there (normals=True). Click Interactive 3-D view and rotate the scene: the crossings lie on the grid lines, around the solid nodes.
import plasma_plotsimport pyvista as pv
from simgeometry import Sphere
pv.OFF_SCREEN = True  # render without a window, e.g. on a docs server
grid3 = Grid(    ndim=3, lower_bound=(-1, -1, -1), upper_bound=(1, 1, 1), num_gridpoints=(9, 9, 9))ball = Sphere((0.03, 0.02, -0.01), 0.62)cuts3 = ball.cut_edges(grid3)assert cuts3.exactnp.testing.assert_allclose(    np.linalg.norm(cuts3.points - np.array([[0.03], [0.02], [-0.01]]), axis=0),    0.62,    atol=1e-10,)print("Crossings in 3D:", len(cuts3.fractions))plotter = cuts3.show_3d(backend="pyvista", normals=True, nodes=True, display=False)plasma_plots.scene(    plotter,    alt="A ball on a 3D grid: solid nodes, grid-edge crossings and outward normals",)
Crossings in 3D: 126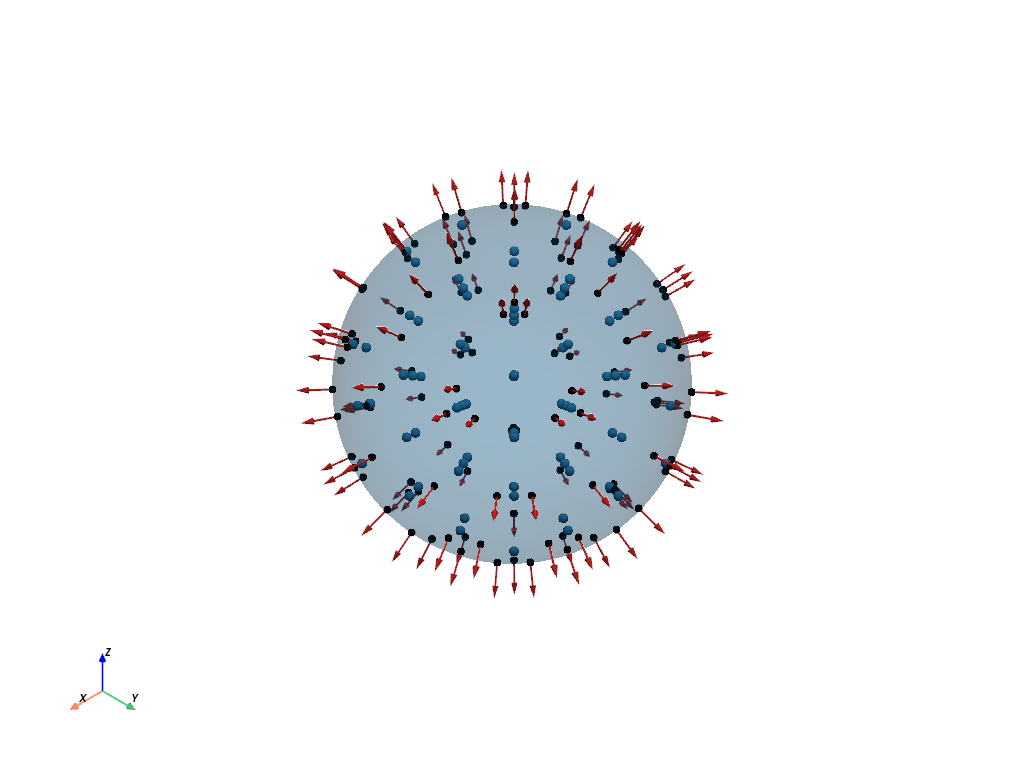
Solver-oriented brackets
Section titled “Solver-oriented brackets”bracketed_edge_geometry() batches the outside-to-inside edges adjacent to solid nodes. It returns grid-shaped arrays keyed by (axis, side), where side 0 means lower and side 1 means upper; uncut entries are NaN. Fractions are raw and unclamped. brackets.points and brackets.normals are the crossings in world coordinates and the outward normals there, (ndim, n) arrays like those of cut_edges(), and brackets.show_3d() draws them on a 3D grid.
This path assumes one crossing per bracket. It matches the geometry used by Picnic’s current stencil assembly. Its periodic option tests wrapped coordinates. It does not detect an object that lies entirely between fluid nodes.
brackets = bracketed_edge_geometry(grid, [circle])fractions = np.concatenate([f[np.isfinite(f)] for f in brackets.fractions.values()])assert np.all((fractions >= 0) & (fractions <= 1))np.testing.assert_allclose( np.linalg.norm(brackets.points - np.array([[0.03], [0.02]]), axis=0), 0.37, atol=1e-10,)print("Fluid nodes adjacent to a solid:", brackets.cut.sum())print("Smallest raw edge fraction:", fractions.min())plt.hist(fractions, bins=12, edgecolor="black")plt.xlabel("Raw outside-to-surface fraction")plt.ylabel("Number of directed cut edges")plt.show()Fluid nodes adjacent to a solid: 19Smallest raw edge fraction: 0.036766627701547976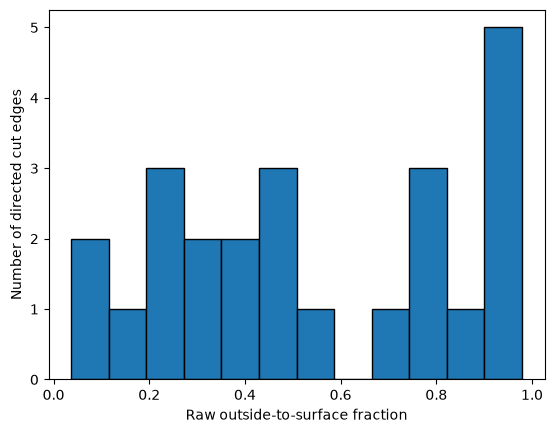
Detect a thin object between fluid nodes
Section titled “Detect a thin object between fluid nodes”The full cut_edges() inspection visits every edge and can return multiple hits on one edge. Analytic balls, boxes and polygons detect crossings even when both endpoints are outside. General membership functions scan a finite number of samples and may miss narrower features; check cuts.exact and refine samples.
An edge can also be tangent to a surface. intersect_segment() returns such a hit with entering=0; +1 means entering and -1 means leaving.
thin_grid = Grid( ndim=2, lower_bound=(0, -0.5), upper_bound=(1, 0.5), num_gridpoints=(2, 3))bead = Circle((0.5, 0), 0.025)assert not bead.node_mask(thin_grid).any()thin_cuts = bead.cut_edges(thin_grid)np.testing.assert_allclose(thin_cuts.fractions, [0.475, 0.525])print(bead.diagnose(thin_grid))ax = bead.show( bounds=((0, -0.2), (1, 0.2)), resolution=180, display=False, labels=False)ax.plot([0, 1], [0, 0], "k.-", label="edge with fluid endpoints")thin_cuts.show(ax=ax, normals=True, display=False)ax.legend()ax.set_title("Two crossings, no solid grid node")plt.show(){'overlap_nodes': {}, 'objects_without_solid_nodes': ['geometry'], 'multiple_hit_edges': 1, 'short_distance_hits': 0, 'intersection_search_exact': True, 'scope': 'node and edge samples; does not certify feature resolution'}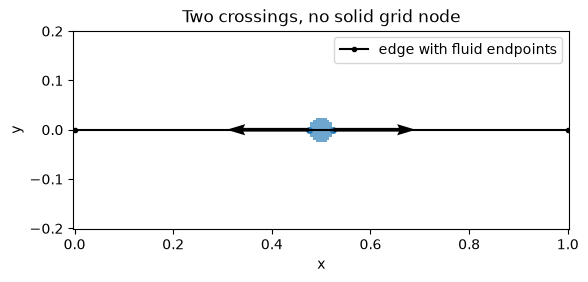
Approximate cell-volume and face-area fractions
Section titled “Approximate cell-volume and face-area fractions”cell_fractions() provides a separate geometric quantity: the fraction of each cell (and face) inside the solid. It uses midpoint subcell quadrature, not an exact interface reconstruction. Fluid fractions are one minus these arrays. Increase samples_per_axis to check convergence; features below the sample spacing can be missed.
for samples in (2, 4, 8): fractions = circle.cell_fractions(grid, samples_per_axis=samples) area = fractions.volume.sum() * np.prod(grid.grid_spacing) print( f"{samples} samples/axis: area={area:.6f}, exact={np.pi * circle.radius**2:.6f}" )xs, ys = grid.get_grid_points()plt.pcolormesh(xs, ys, fractions.volume.T, shading="flat", vmin=0, vmax=1, cmap="Blues")plt.colorbar(label="Solid cell fraction")plt.gca().set_aspect("equal")plt.title("Subcell occupancy estimates")plt.xlabel("x")plt.ylabel("y")plt.show()assert fractions.faces[0].shape == (17, 16)assert fractions.faces[1].shape == (16, 17)2 samples/axis: area=0.425781, exact=0.4300844 samples/axis: area=0.431641, exact=0.4300848 samples/axis: area=0.429688, exact=0.430084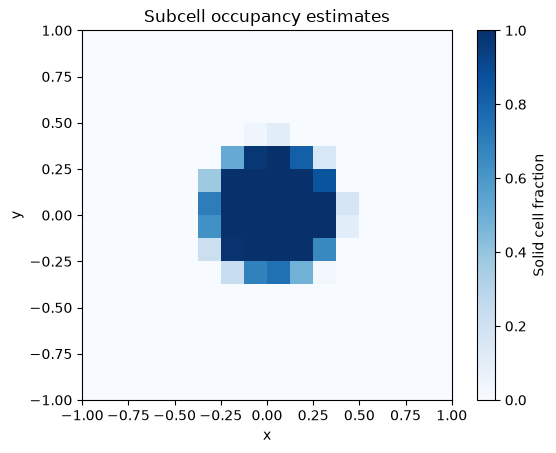
Try moving the circle by a small fraction of one cell and compare the edge fractions. Simgeometry leaves tiny physical distances unchanged. A solver may need to regularize them to control conditioning, which is a discretization decision rather than a geometry tolerance.