Conductors and level sets
Build an Einzel lens from ring electrodes, give the electrodes voltages, and read the Dirichlet values a field solver needs. The rings are Tube solids; their level sets locate the surface between grid nodes to round-off.
An Einzel lens is three coaxial rings: the outer two grounded, the middle one at a high voltage. A beam passing through the bore is focused without changing its final energy.
import matplotlib.pyplot as pltimport numpy as np
from simgeometry import GeometryCollection, Grid, Tube
bore, outer, length, gap = 1.0, 1.6, 0.8, 0.4

def ring(centre):    # a ring electrode along z, with rounded edges    return Tube(        (0, 0, centre - length / 2),        (0, 0, centre + length / 2),        bore,        outer,        fillet=0.1,    )

lens = GeometryCollection(    {        "entrance": ring(-(length + gap)),        "focus": ring(0.0),        "exit": ring(length + gap),    },    voltages={"entrance": 0.0, "focus": 10e3, "exit": 0.0},)print(lens.conductors, lens.voltages)
('entrance', 'focus', 'exit') {'entrance': 0.0, 'focus': 10000.0, 'exit': 0.0}The section through the axis shows the three rings in the plane y = 0, labelled in insertion order.
lens.slice(y=0).show(resolution=240, display=False)plt.title("Einzel lens, section y = 0")plt.show()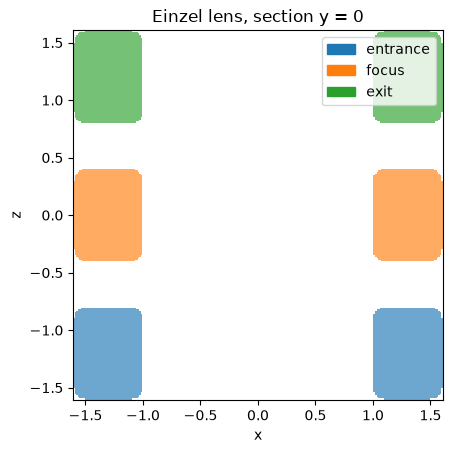
In 3D, color_by="voltage" colours each conductor by its voltage (needs simgeometry[interactive]); click Interactive 3-D view to look into the bore.
import plasma_plotsimport pyvista as pv
pv.OFF_SCREEN = Trueplotter = lens.show_3d(    backend="pyvista", display=False, color_by="voltage", resolution=48, opacity=0.8)plasma_plots.scene(plotter, alt="The Einzel lens, the middle ring at 10 kV")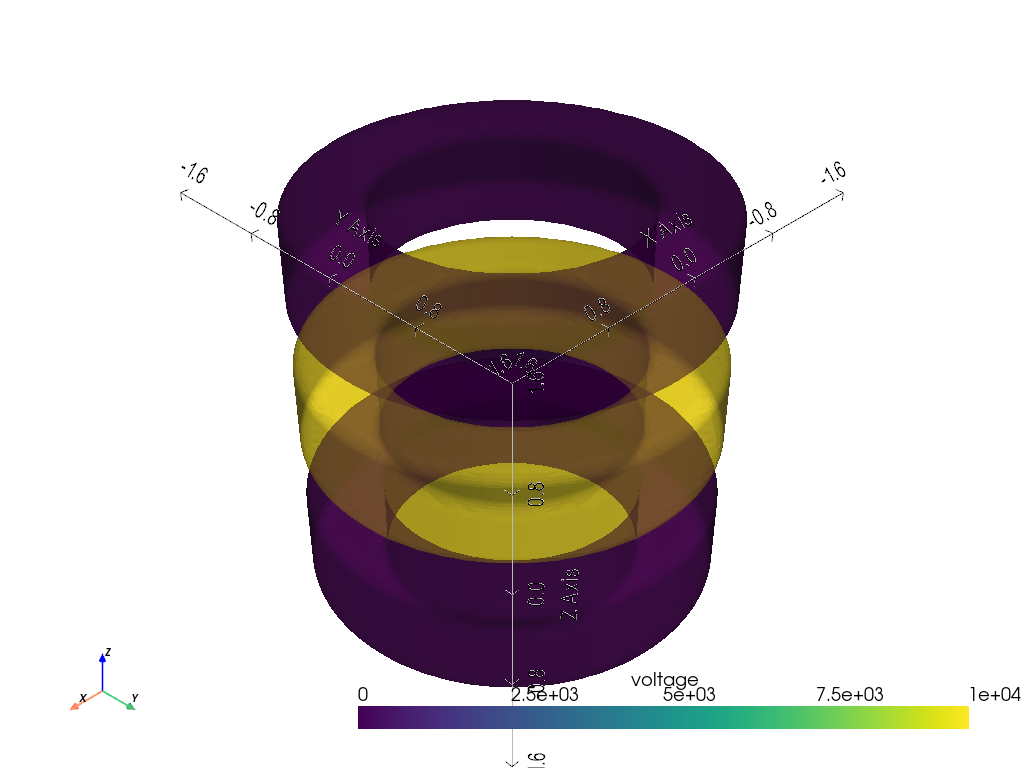
Dirichlet values on a grid
Section titled “Dirichlet values on a grid”dirichlet_values(grid) returns, for every node, the label of the object it is inside (0 outside every object) and that object’s voltage, NaN outside the conductors. Overlaps follow the labels: the last listed object wins. A solver fixes the nodes where values.conductor is true.
grid = Grid(    ndim=3,    lower_bound=(-2.0, -2.0, -3.0),    upper_bound=(2.0, 2.0, 3.0),    num_gridpoints=(41, 41, 61),)values = lens.dirichlet_values(grid)print(values.names, values.labels.shape, int(values.conductor.sum()), "fixed nodes")
y0 = 20  # the node plane y = 0x, _, z = grid.get_grid_points()fig, ax = plt.subplots(figsize=(7, 3.5), layout="constrained")image = ax.pcolormesh(    z, x, values.voltages[:, y0, :], shading="nearest", cmap="viridis")fig.colorbar(image, label="voltage [V]")ax.set_xlabel("z")ax.set_ylabel("x")ax.set_aspect("equal")ax.set_title("Dirichlet voltages at the nodes (white: free nodes)")plt.show()
('entrance', 'focus', 'exit') (41, 41, 61) 11256 fixed nodes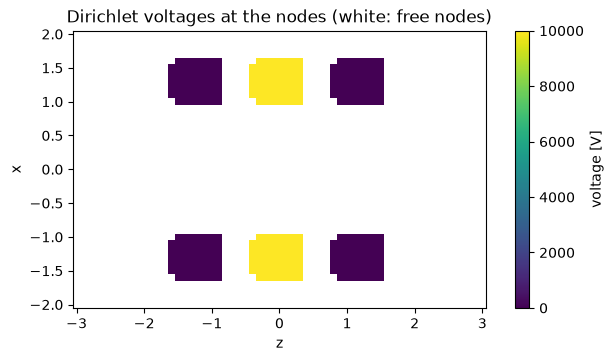
Other voltages without rebuilding the geometry
Section titled “Other voltages without rebuilding the geometry”with_voltages returns a collection with the same objects and other voltages, for a parameter scan. A voltage can also be a function of the time t, such as a ramp; voltages_at(t) and dirichlet_values(..., t=t) evaluate it.
scan = {v: lens.with_voltages(focus=v) for v in (2e3, 5e3, 10e3)}print({v: collection.voltages["focus"] for v, collection in scan.items()})
ramped = lens.with_voltages(focus=lambda t: 10e3 * min(t / 1e-6, 1.0))for t in (0.0, 0.25e-6, 2e-6):    print(f"t = {t:.2e} s:", ramped.voltages_at(t))assert lens["focus"] is ramped["focus"]  # the same geometry
{2000.0: 2000.0, 5000.0: 5000.0, 10000.0: 10000.0}t = 0.00e+00 s: {'entrance': 0.0, 'focus': 0.0, 'exit': 0.0}t = 2.50e-07 s: {'entrance': 0.0, 'focus': 2500.0, 'exit': 0.0}t = 2.00e-06 s: {'entrance': 0.0, 'focus': 10000.0, 'exit': 0.0}Level sets
Section titled “Level sets”Analytic shapes have a level_set(points): negative inside, positive outside, zero on the boundary, the same sign as signed_distance. Where level_set_exact is true it is the Euclidean signed distance, so signed_distance returns it directly. Booleans combine level sets by minimum and maximum, which bounds the distance without being exact; transforms keep them exact for rigid motions and uniform scaling.
focus = lens["focus"]points = np.array([[0.0, 1.3, 2.0], [0.0, 0.0, 0.0], [0.0, 0.0, 0.0]])print("exact:", focus.level_set_exact)print("level set:", focus.level_set(points))print("signed distance:", focus.signed_distance(points))exact: Truelevel set: [ 1. -0.3 0.4]signed distance: [ 1. -0.3 0.4]Cut a slot through the focus electrode and the level set becomes a bound. Below are its levels 0 (the surface) and 0.2 (a shell outside it); bounds leaves room for the shell. Where the shell dips into the slot it keeps sharp corners, where the shell of the exact distance would be rounded: the difference takes the maximum of two level sets. Click Interactive 3-D view and zoom into the slot.
from simgeometry import Cuboid
slotted = focus - Cuboid((0, 1.3, 0), (0.6, 1.0, 1.0))print("exact:", slotted.level_set_exact)field = slotted.level_set_field(resolution=64, bounds=((-2, -2, -0.8), (2, 2, 0.8)))plotter = field.plasma.plot.isosurface(    values=[0.0, 0.2], clim=(0.0, 0.3), opacity=0.5, show_domain=False)plotter.view_vector((0.5, 1, 0.8))  # look at the slotplotter.camera.zoom(1.3)plasma_plots.scene(    plotter, alt="A ring electrode with a slot, and its level set 0.2 outside it")
exact: False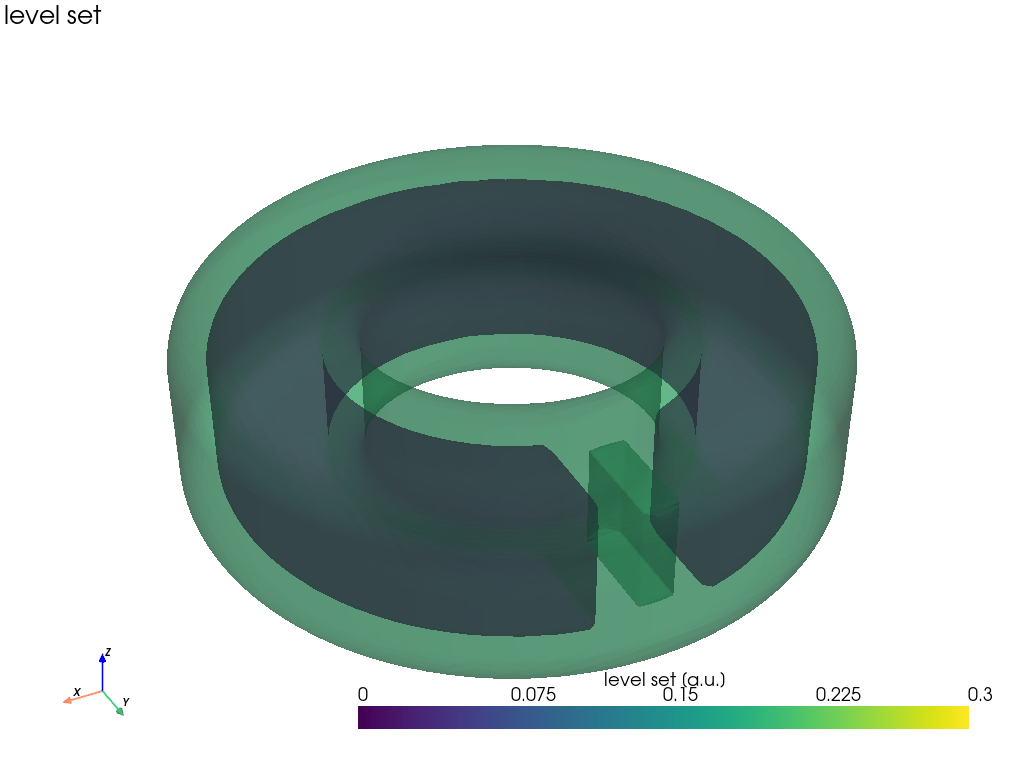
Grid-edge crossings (bracketed_edge_geometry, used by Picnic’s embedded-boundary stencil) interpolate the level set between the two nodes of a cut edge and refine the root with a few Illinois steps, instead of bisecting contains 48 times. edges.points holds the crossings in world coordinates (edges.normals the outward normals there); they lie on the bore surface to round-off.
from simgeometry.cut_edges import bracketed_edge_geometry
edges = bracketed_edge_geometry(grid, [focus])errors = np.abs(focus.level_set(edges.points))print(    f"{errors.size} cut edges, largest distance from the surface:",    f"{errors.max():.1e}",)
2640 cut edges, largest distance from the surface: 4.4e-16edges.show_3d() draws the crossings over the translucent electrode: they trace the bore, the outer wall and the end faces; each one sits on a grid line. Click Interactive 3-D view and zoom in on an edge to see the crossings follow its rounding.
plotter = edges.show_3d(backend="pyvista", display=False, opacity=0.3, point_size=3)plasma_plots.scene( plotter, alt="The grid-edge crossings on the surface of the focus electrode")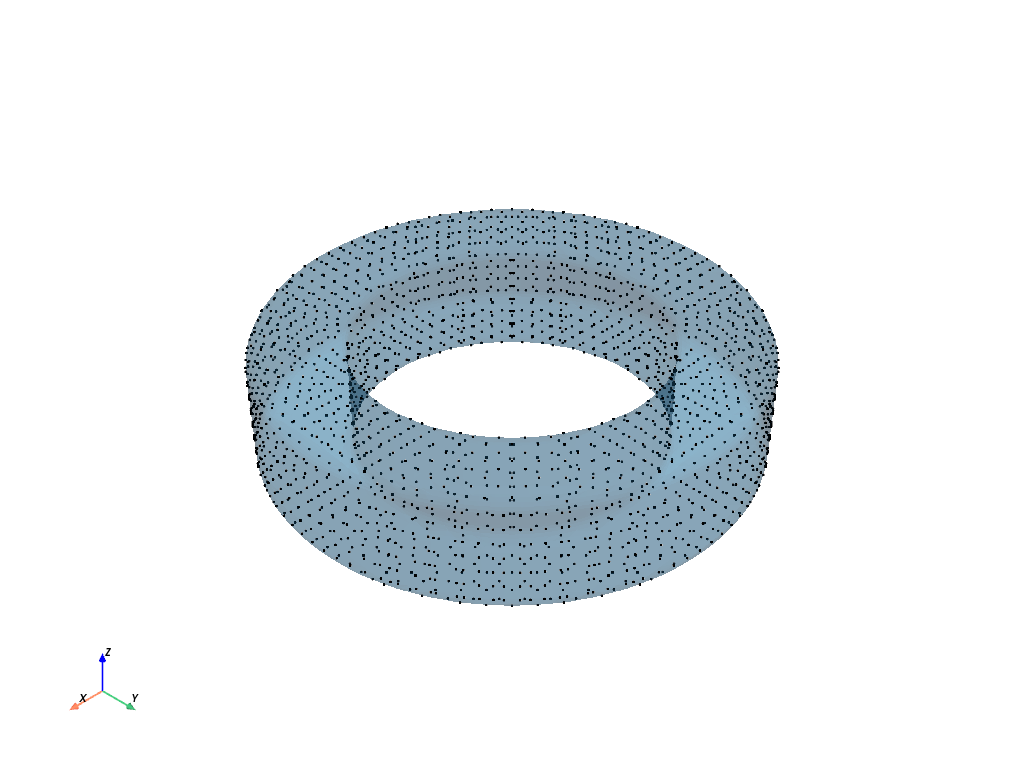
Shapes known only through their membership, such as FunctionObject3D, have no level set (has_level_set is false); every query then falls back to sampling and bisecting contains.