Einzel lens optimisation
A first design optimisation with beamtracer.optimization: an einzel lens focusing a
30 keV proton beam onto a plane downstream. The optimisation core only calls an evaluation
function, here a BeamOptics solve of the lens; any other model can take its place.
Differential evolution (SciPy) runs the search, every evaluation is recorded in a
JSON-lines file, and a search resumes from its record.
The steps, each checked before the next:
- one parameter, the middle voltage, without space charge: the optimiser against a scan and the thin-lens estimate;
- three parameters (voltage, gap, aperture) with a limit on the surface field;
- space charge on: how far the optimum moves.
import tempfilefrom dataclasses import replacefrom pathlib import Path
import matplotlib.pyplot as pltimport numpy as np
from beamtracer.optimization import load_record, optimize, scanfrom beamtracer.optimization.einzel import EinzelLens
BLUE, ORANGE, AQUA, YELLOW = "#2a78d6", "#eb6834", "#1baf7a", "#eda100"INK, MUTED, ELECTRODE = "#2b2a26", "#8a897f", "#b9b8b0"plt.rcParams.update(    {        "figure.dpi": 110,        "axes.edgecolor": MUTED,        "axes.labelcolor": INK,        "axes.grid": True,        "grid.color": "#e4e3dd",        "grid.linewidth": 0.6,        "xtick.color": MUTED,        "ytick.color": MUTED,        "legend.frameon": False,        "lines.linewidth": 2,    })WORKERS = 1  # processes per searchruns = Path(tempfile.mkdtemp())  # the records of this page's searches
The lens
Section titled “The lens”EinzelLens holds the fixed settings and builds the BeamOpticsConfig of a design. Three
tubes, 8 mm long and 2 mm thick with half-round ends, sit in a grounded tube of 20 mm radius
in cylindrical geometry; the outer two are at 0 V, the middle one at the voltage .
A parallel beam of 30 keV protons, 2 mm in radius, starts at mm, and the objective
is its rms size at the target plane mm. Lost
trajectories are a constraint; so is the largest field on the electrode surfaces.
A solve on the default 0.5 mm mesh takes a fraction of a second.
lens = EinzelLens()print( f"{lens.energy / 1e3:.0f} keV protons, beam radius {lens.beam_radius * 1e3} mm, " f"target at {lens.target * 1e3:.0f} mm, mesh {lens.cell * 1e3} mm")print( f"defaults: gap {lens.gap * 1e3} mm, aperture {lens.aperture * 1e3} mm, " f"field limit {lens.field_limit / 1e6} MV/m")30 keV protons, beam radius 2.0 mm, target at 120 mm, mesh 0.5 mmdefaults: gap 4.0 mm, aperture 5.0 mm, field limit 5.0 MV/mStep 1: the voltage
Section titled “Step 1: the voltage”The problem has one parameter. A scan over the voltage and differential evolution share the evaluation and the record: the search takes the designs the scan already evaluated from the record instead of solving them again.
step1 = lens.problem({"voltage": (12e3, 18e3)})record1 = runs / "step1.jsonl"voltages = np.linspace(13e3, 17e3, 33)grid = scan(step1, {"voltage": voltages}, workers=WORKERS, record=record1)search = optimize(    step1, seed=1, popsize=8, maxiter=25, tol=1e-6, workers=WORKERS, record=record1)thin = lens.thin_lens_voltage()paraxial = lens.paraxial_voltage()
step = voltages[1] - voltages[0]print(    f"scan:      V = {grid.x['voltage']:7.0f} V  spot {grid.fun * 1e6:5.1f} um  ({step:.0f} V steps)")print(    f"optimiser: V = {search.x['voltage']:7.0f} V  spot {search.fun * 1e6:5.1f} um  "    f"({search.evaluated} evaluations)")print(    f"thin lens: V = {thin:7.0f} V  ({thin / search.x['voltage'] - 1:+.1%} of the optimum)")print(f"paraxial:  V = {paraxial:7.0f} V  ({paraxial / search.x['voltage'] - 1:+.1%})")
scan: V = 14875 V spot 29.7 um (125 V steps)optimiser: V = 14924 V spot 28.4 um (121 evaluations)thin lens: V = 15172 V (+1.7% of the optimum)paraxial: V = 15401 V (+3.2%)def spot_and_voltage(evaluations): ok = [e for e in evaluations if e.feasible] return ( np.array([e.parameters["voltage"] for e in ok]) / 1e3, np.array([e.objectives["spot"] for e in ok]) * 1e6, )
fig, axes = plt.subplots(1, 2, figsize=(10, 3.8))for ax, zoom in zip(axes, (False, True), strict=True): v, s = spot_and_voltage(grid.evaluations) ax.plot(v, s, color=BLUE, marker="o", ms=4, lw=1.5, label="scan") v, s = spot_and_voltage(search.evaluations) ax.scatter( v, s, s=14, color=ORANGE, alpha=0.6, zorder=3, label="optimiser's evaluations" ) ax.scatter( [search.x["voltage"] / 1e3], [search.fun * 1e6], s=120, marker="*", color=ORANGE, edgecolor="white", zorder=4, label="optimum", ) ax.axvline(thin / 1e3, color=AQUA, ls="--", lw=1.5, label="thin lens") ax.axvline(paraxial / 1e3, color=MUTED, ls=":", lw=1.5, label="paraxial ray") ax.set_xlabel("middle voltage [kV]") ax.set_ylabel("rms spot at the target [µm]") if zoom: centre = search.x["voltage"] / 1e3 ax.set_xlim(centre - 0.6, centre + 0.9) ax.set_ylim(0, 160) ax.set_title("near the optimum", color=INK, fontsize=10) else: ax.set_yscale("log") ax.set_title("the scan and the search", color=INK, fontsize=10)axes[1].legend(fontsize=8, loc="upper center")fig.tight_layout()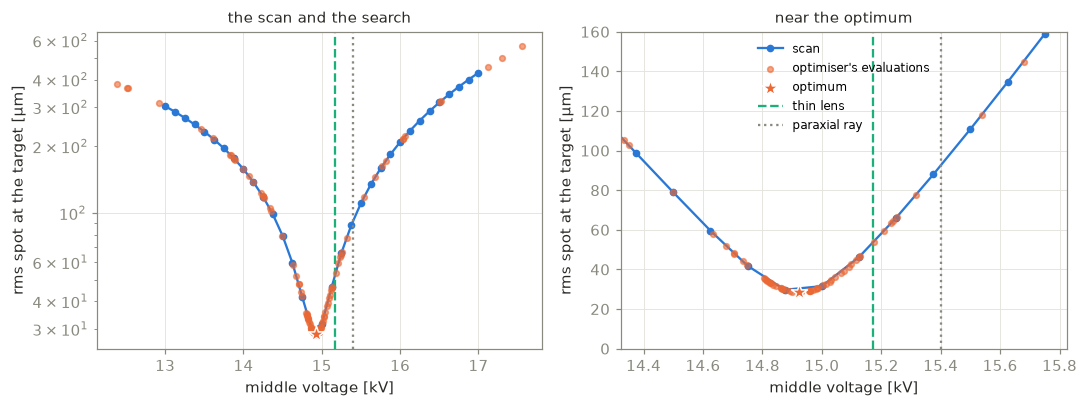
Every evaluation carries the generation of the evolution that asked for it (0 is the
initial population), and search.path holds the best design after each generation.
SciPy asks for some designs again (it checks the best one between generations); the search
answers those from memory, lists each design once and counts the repeats.
path = search.path_to_dataset()print( f"{len(search.path) - 1} generations, {len(search.evaluations)} designs: " f"{search.evaluated} solved, {search.reused} from the scan's record, " f"{search.repeats} asked for again")fig, ax = plt.subplots(figsize=(7, 3.2))ax.plot( path.generation, path.voltage / 1e3, color=ORANGE, marker="o", ms=4, label="best of each generation",)centre = grid.x["voltage"] / 1e3ax.axhspan(centre - step / 1e3, centre + step / 1e3, color=BLUE, alpha=0.15)ax.axhline(centre, color=BLUE, ls="--", lw=1.5, label="scan's minimum ± one step")ax.set_xlabel("generation")ax.set_ylabel("middle voltage [kV]")ax.legend(fontsize=8)fig.tight_layout()15 generations, 121 designs: 121 solved, 0 from the scan's record, 25 asked for again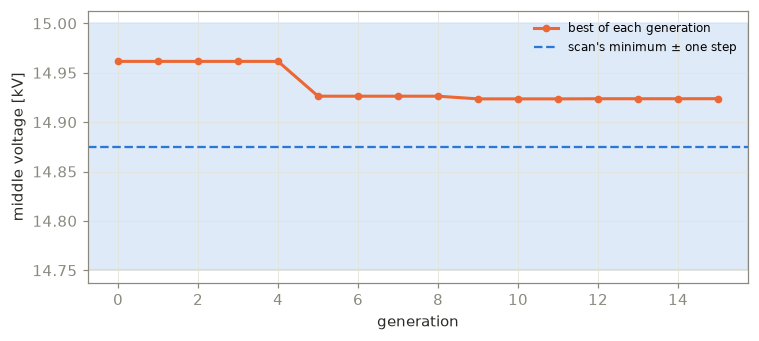
The optimiser lands on the scan’s minimum, within the 125 V step of the scan. The thin-lens estimate, on the solved axis potential ( the protons’ kinetic energy per charge), and the paraxial ray integrated through the lens both focus at slightly higher voltages: the 2 mm beam fills 40 % of the bore, its outer rays are focused more strongly (spherical aberration), and the smallest rms spot sits below the paraxial focus. The lens is far from weak, , yet the thin lens and the paraxial ray differ by only 1.5 %.
With a thin beam (0.5 mm) the aberration is gone, and the traced optimum approaches the paraxial focus; moving the target downstream makes the lens weaker, and the thin-lens estimate converges to it.
print("target V/U0 thin lens paraxial traced thin/traced - 1")for target in (120e-3, 180e-3, 250e-3): weak = replace( lens, beam_radius=0.5e-3, num_particles=10, target=target, length=target + 10e-3 ) v_thin, v_par = weak.thin_lens_voltage(), weak.paraxial_voltage() v = np.linspace(0.97, 1.03, 13) * v_par found = scan( weak.problem({"voltage": (0.9 * v_par, 1.1 * v_par)}), {"voltage": v}, workers=WORKERS, ) s = np.array([e.objectives["spot"] for e in found.evaluations]) k = int(np.argmin(s)) a, b, _ = np.polyfit(v[k - 1 : k + 2], s[k - 1 : k + 2], 2) traced = -b / (2 * a) print( f"{target * 1e3:4.0f} mm {traced / lens.energy:.2f} {v_thin:9.0f} {v_par:8.0f} {traced:7.0f} " f"{v_thin / traced - 1:+.2%}" )target V/U0 thin lens paraxial traced thin/traced - 1 120 mm 0.51 15172 15401 15347 -1.14% 180 mm 0.41 12299 12418 12366 -0.54% 250 mm 0.35 10460 10532 10483 -0.22%The trajectories at the optimum, over the potential:
model = replace(lens, save_trajectories=3).solve(search.x)potential = model.potential_field.evaluate()fig, ax = plt.subplots(figsize=(10, 3.6))mesh = ax.pcolormesh( potential.x * 1e3, potential.y * 1e3, potential.T / 1e3, cmap="Blues", shading="auto",)fig.colorbar(mesh, ax=ax, label="potential [kV]", pad=0.01)for params in model.config.objects.values(): # a tube is a rectangle and two circles for loop in params.build().outlines(): ax.fill(loop[0] * 1e3, loop[1] * 1e3, color=ELECTRODE, lw=0)for path in model.trajectories: ax.plot(path[:, 0] * 1e3, path[:, 1] * 1e3, color=ORANGE, lw=0.7)ax.axvline(lens.target * 1e3, color=INK, ls="--", lw=1)ax.text(lens.target * 1e3 + 1, 10.5, "target", color=INK, fontsize=9)ax.set_ylim(0, 12)ax.set_xlabel("x [mm]")ax.set_ylabel("r [mm]")ax.set_title( f"V = {search.x['voltage'] / 1e3:.2f} kV: every 3rd trajectory", color=INK, fontsize=10,)ax.grid(False)fig.tight_layout()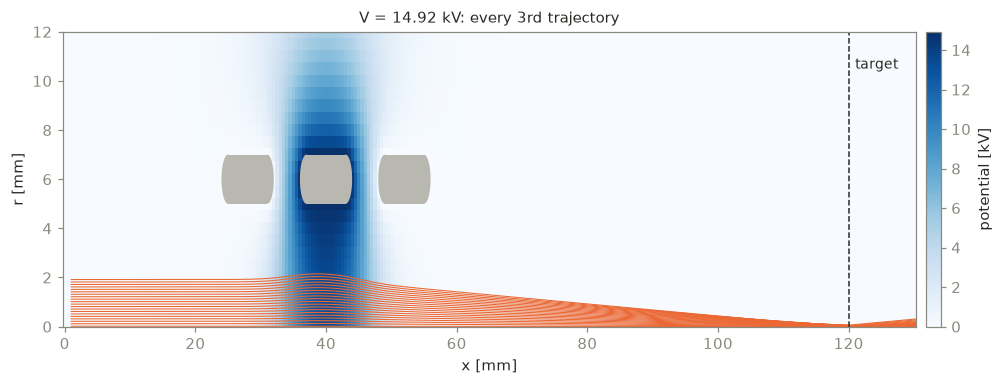
Step 2: voltage, gap and aperture, with a surface-field limit
Section titled “Step 2: voltage, gap and aperture, with a surface-field limit”Three parameters, and the largest field on the electrode surfaces at most 5 kV/mm. The
field is that of the solved potential at the nodes next to the electrodes
(BeamOptics.surface_fields()); the rounded tube ends keep it finite as the mesh is refined
(at a sharp corner it would grow without bound). The searches below are short (about 150
evaluations each, with and without the limit), so their optima are rough.
bounds = {"voltage": (5e3, 25e3), "gap": (1e-3, 12e-3), "aperture": (3e-3, 8e-3)}settings = dict(seed=1, popsize=4, maxiter=12, tol=1e-4, workers=WORKERS)free = optimize(lens.problem(bounds), record=runs / "free.jsonl", **settings)limited = optimize( lens.problem(bounds, constraints=("loss", "surface_field")), record=runs / "limited.jsonl", **settings,)for name, result in (("no field limit", free), ("5 kV/mm", limited)): x, d = result.x, result.best.diagnostics print( f"{name:15s} V = {x['voltage'] / 1e3:5.2f} kV gap {x['gap'] * 1e3:5.2f} mm " f"aperture {x['aperture'] * 1e3:4.2f} mm spot {result.fun * 1e6:5.1f} um " f"field {d['field'] / 1e6:4.2f} MV/m ({result.evaluated} evaluations)" )no field limit V = 14.75 kV gap 7.95 mm aperture 3.95 mm spot 23.0 um field 5.25 MV/m (155 evaluations)5 kV/mm V = 14.58 kV gap 10.40 mm aperture 3.45 mm spot 57.1 um field 4.97 MV/m (156 evaluations)data = load_record(runs / "limited.jsonl")fig, axes = plt.subplots(1, 2, figsize=(10, 3.8))ax = axes[0]ok = data.ok.valuesinside = ok & (data.surface_field.values <= 0)for mask, color, label in ( (inside, BLUE, "within the limit"), (ok & ~inside, ORANGE, "above the limit"),): ax.scatter( data.field[mask] / 1e6, data.spot[mask] * 1e6, s=10, color=color, alpha=0.6, label=label, )ax.axvline(lens.field_limit / 1e6, color=INK, ls="--", lw=1, label="limit")for result, marker, label in ( (free, "D", "optimum, no limit"), (limited, "*", "optimum, 5 kV/mm"),): ax.scatter( result.best.diagnostics["field"] / 1e6, result.fun * 1e6, s=180, marker=marker, color=INK, edgecolor="white", zorder=4, label=label, )ax.set_yscale("log")ax.set_xlim(1.5, 12) # a few designs above 12 MV/m are off the plotax.set_xlabel("largest surface field [MV/m]")ax.set_ylabel("rms spot [µm]")ax.legend(fontsize=8, loc="lower right")ax = axes[1]for result, color, label in ( (free, BLUE, "no field limit"), (limited, ORANGE, "5 kV/mm"),): path = result.path_to_dataset() ax.plot( path.generation, path.spot * 1e6, color=color, marker="o", ms=3, label=label )ax.set_yscale("log")ax.set_xlabel("generation")ax.set_ylabel("spot of the best design [µm]")ax.legend(fontsize=8)fig.tight_layout()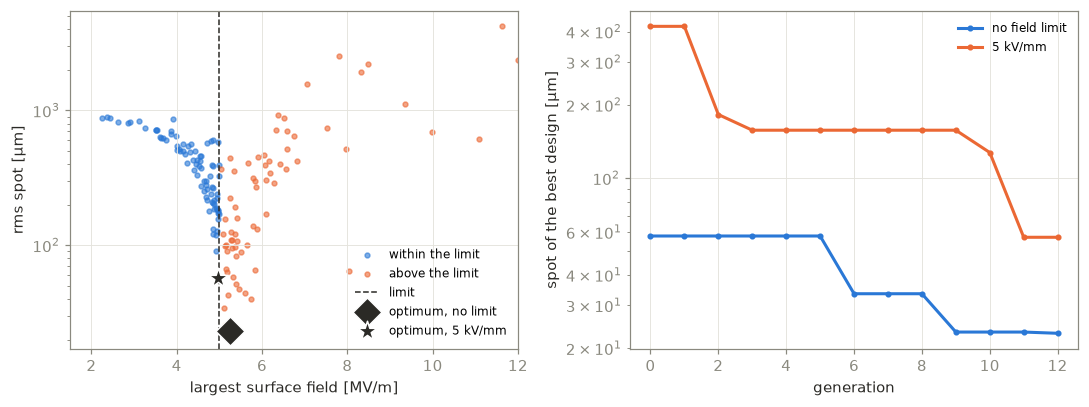
These short searches only start the job. Longer ones (population 30, 60 generations, three seeds, about 1800 evaluations each) settle it. Without a limit they widen the gap and the bore to their bounds (19.8 kV, 12 mm, 8 mm, a 13.9 µm spot): a wider bore keeps the beam nearer the axis (weaker aberrations) and a wider gap makes the potential step gentler, at the price of more voltage, and the field at the rounded tube ends reaches 6.5 MV/m. With the 5 kV/mm limit the constraint is active at the optimum (5.00 MV/m) and the search trades voltage against gap and bore: a narrow bore focuses with less voltage, and the gap settles where widening it further would need more voltage than it saves in field. The three seeds give 14.5–14.6 kV, a 9.6–10.0 mm gap, a 3.46 mm bore and a 36–38 µm spot; the optimum lies in a flat valley along the constraint, so they agree on the field and the bore better than on the gap.
On the 0.5 mm mesh the surface field is underestimated: the same design reads 5.0, 5.2 and 5.6 MV/m on 0.5, 0.25 and 0.125 mm meshes, so the limit given to the search needs a margin of 10–15 % (or a finer mesh for the final design).
Step 3: space charge
Section titled “Step 3: space charge”With a beam current the Vlasov iteration converges the field and the trajectories together (8–10 iterations, about a second per solve). The space charge defocuses the beam, so the lens needs more voltage, and the smallest spot grows: the optimum moves away from the one without space charge, by about 9 % at 1 mA and 22 % at 3 mA (7 % and 20 % above the thin-lens voltage). The stars are the optimiser’s minima, between the 1 kV steps of the scans; longer searches with three seeds find the same voltages to within 1 V.
fig, ax = plt.subplots(figsize=(7, 3.8))voltages = np.linspace(13e3, 20e3, 8)optima = {0.0: search}for current, color in ((0.0, BLUE), (1e-3, ORANGE), (3e-3, AQUA)): charged = replace(lens, current=current) problem = charged.problem({"voltage": (12e3, 21e3)}) record = runs / f"space_charge_{current * 1e3:.0f}mA.jsonl" swept = scan(problem, {"voltage": voltages}, workers=WORKERS, record=record) if current > 0.0: optima[current] = optimize( problem, seed=1, popsize=4, maxiter=6, tol=1e-5, workers=WORKERS, record=record, ) found = optima[current] v, s = spot_and_voltage(swept.evaluations) ax.plot( v, s, color=color, marker="o", ms=3, lw=1.5, label=f"{current * 1e3:.0f} mA" ) ax.scatter( found.x["voltage"] / 1e3, found.fun * 1e6, s=140, marker="*", color=color, edgecolor="white", zorder=4, )ax.scatter([], [], s=140, marker="*", color=MUTED, label="optimiser")ax.axvline( thin / 1e3, color=MUTED, ls="--", lw=1.5, label="thin lens (no space charge)")ax.set_yscale("log")ax.set_xlabel("middle voltage [kV]")ax.set_ylabel("rms spot at the target [µm]")ax.legend(fontsize=8, title="beam current", title_fontsize=8)fig.tight_layout()for current, found in optima.items(): shift = found.x["voltage"] / optima[0.0].x["voltage"] - 1 print( f"{current * 1e3:.0f} mA: V = {found.x['voltage']:6.0f} V ({shift:+.1%}), " f"spot {found.fun * 1e6:5.1f} um, " f"{found.best.diagnostics['iterations']} Vlasov iterations" )0 mA: V = 14924 V (+0.0%), spot 28.4 um, 1 Vlasov iterations1 mA: V = 16260 V (+9.0%), spot 58.6 um, 8 Vlasov iterations3 mA: V = 17946 V (+20.3%), spot 167.8 um, 10 Vlasov iterations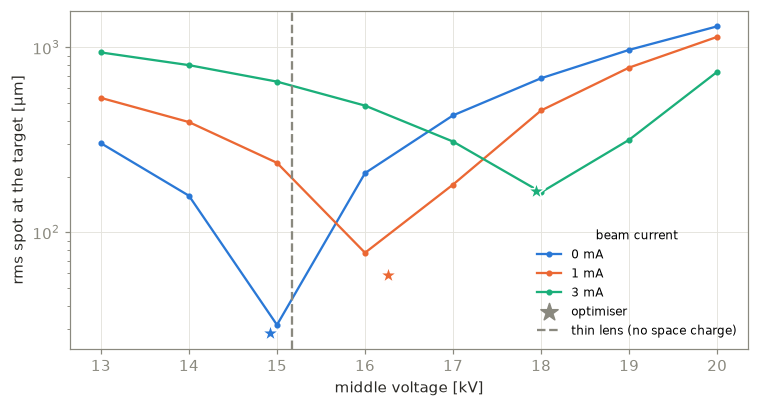
The record
Section titled “The record”Every evaluation of a search is a line of its record, with the parameters, objectives,
constraints, the converged flag, the wall time, diagnostics and the generation that asked
for it (-1 for the scan’s designs). load_record reads it as an
xarray Dataset (.to_dataframe() for pandas), and a search given the same record and seed
continues from it without solving the recorded designs again.
data = load_record(record1)print( data[["voltage", "spot", "loss", "converged", "generation"]].to_dataframe().tail())again = optimize(step1, seed=1, popsize=8, maxiter=25, tol=1e-6, record=record1)print(f"rerun: {again.evaluated} new evaluations, {again.reused} from the record") voltage spot loss converged generationevaluation149 14923.175701 0.000028 0.0 True 15150 14923.911827 0.000028 0.0 True 15151 14923.778181 0.000028 0.0 True 15152 14923.374953 0.000028 0.0 True 15153 14923.603731 0.000028 0.0 True 15rerun: 0 new evaluations, 121 from the record