Calorimeter
In a test facility the beam ends on a calorimeter: a plate of tiles whose temperature rise
gives the power on each. From the map the experiments infer the beam’s width (a Gaussian
fit of the footprint) and, from the widths at several distances or against the size of the
grid, its divergence. Calorimeter records such a map from the markers, and
fit_footprint and divergence_from_widths repeat the analysis, so the inferred
divergence can be set against the markers’ own rms angle.
The beam is the group of 5 by 16 beamlets of the grid tutorial, each a Gaussian beamlet of 5 mrad.
import numpy as npimport plasma_plots as ppimport xarray as xrfrom scipy import constants
from beamtracer.beamline import (    ApertureGrid,    Calorimeter,    divergence_from_widths,    fit_footprint,    gaussian_beam,)
mass = 2.014 * constants.atomic_massspeed = np.sqrt(2 * 1e6 * constants.e / mass)beamlet = gaussian_beam(2000, power=1e4, speed=speed, width=2e-3, divergence=5e-3)flat = ApertureGrid.regular(16, 5, (0.020, 0.022)).markers(beamlet)print(    f"{len(flat)} markers, {flat.total_power / 1e6:.1f} MW, "    f"rms angle of the markers {flat.rms_angle * 1e3} mrad")
160000 markers, 0.8 MW, rms angle of the markers [4.9481817 5.11957346] mradThe maps
Section titled “The maps”The calorimeter, 0.8 m square in 2 cm tiles, at 3, 5 and 7 m from the grid. Close to the grid the footprint is the group’s rectangle blurred by the beamlets; further away it rounds.
distances = (3.0, 5.0, 7.0)maps = [ Calorimeter(d, (-0.4, 0.4, -0.4, 0.4), (40, 40)).measure(flat) for d in distances]with pp.figure(1, 3, figsize=(12, 3.8)) as fig: for k, (d, power_map) in enumerate(zip(distances, maps, strict=True)): (power_map / 1e6).assign_attrs(units="MW/m²").plasma.plot.slice( x="y", y="z", equal_aspect=True, ax=fig[k], title=f"x = {d} m", colorbar_label="MW/m²", )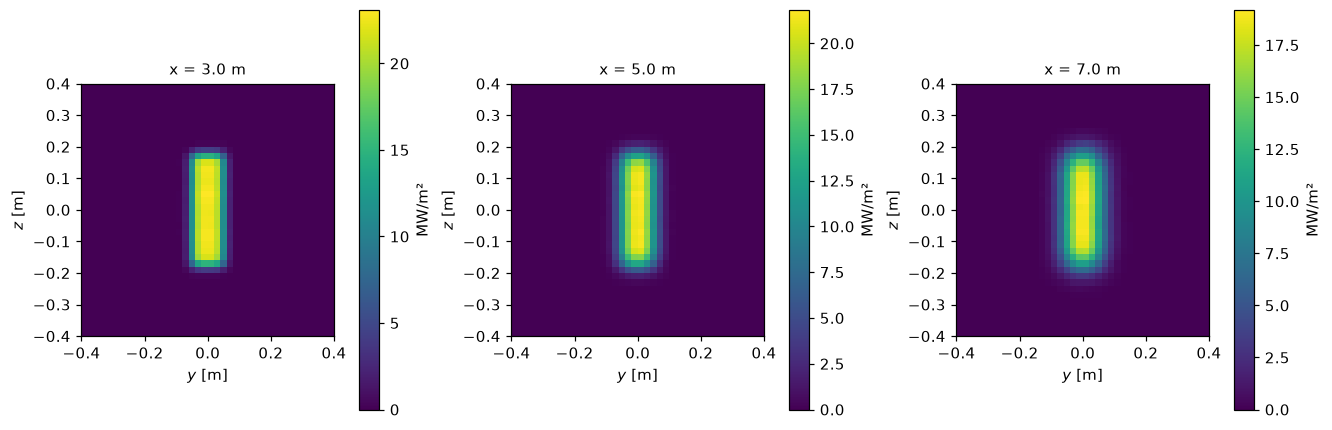
The fit
Section titled “The fit”A 2D Gaussian fitted to each map, and its profile through the centre against the map’s (, along ; and , along ):
fits = [fit_footprint(power_map) for power_map in maps]for d, fit in zip(distances, fits, strict=True):    print(        f"x = {d} m: width {fit['width_y'] * 1e3:.1f} mm in y, "        f"{fit['width_z'] * 1e3:.1f} mm in z"    )
power_map, fit = maps[-1], fits[-1]with pp.figure(1, 2, figsize=(10, 3.6)) as fig:    for k, (along, width) in enumerate((("y", "width_y"), ("z", "width_z"))):        other = "z" if along == "y" else "y"        centre = fit[f"centre_{along}"]        profile = (power_map / 1e6).assign_attrs(            units="MW/m²", long_name="power density"        )        profile.plasma.plot.lineout(            x=along,            ax=fig[k],            reference=lambda s, c=centre, w=fit[width]: (                fit["peak"] / 1e6 * np.exp(-0.5 * ((s - c) / w) ** 2)            ),            **{other: 0.0},        )        fig[k].set_title(f"x = 7 m, along {along}")        fig[k].legend(["the map", "the Gaussian fit"], fontsize=8)
x = 3.0 m: width 37.2 mm in y, 126.1 mm in zx = 5.0 m: width 40.8 mm in y, 126.8 mm in zx = 7.0 m: width 46.6 mm in y, 127.9 mm in z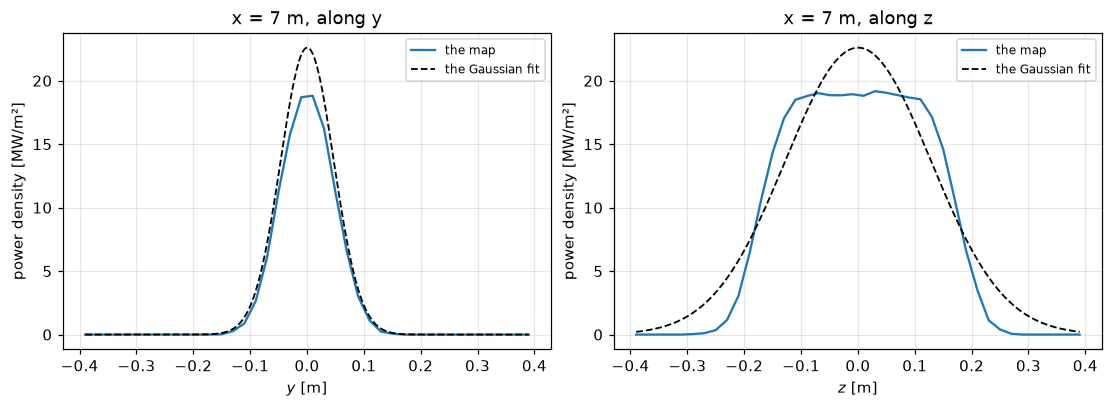
The group is 0.08 m wide in and 0.33 m in : in its flat top is still visible at 7 m and the Gaussian fits it only roughly.
The divergence
Section titled “The divergence”The widths against the distance, fitted with :
rows = []for direction in ("y", "z"): widths = [fit[f"width_{direction}"] for fit in fits] w0, theta = divergence_from_widths(distances, widths) rows.append((direction, w0, theta)) print(f"in {direction}: w0 {w0 * 1e3:.0f} mm, divergence {theta * 1e3:.2f} mrad")print( f"the markers: {flat.rms_angle[0] * 1e3:.2f} mrad in y, {flat.rms_angle[1] * 1e3:.2f} in z")in y: w0 34 mm, divergence 4.46 mradin z: w0 126 mm, divergence 3.38 mradthe markers: 4.95 mrad in y, 5.12 in zFor a flat grid every beamlet keeps its axis, so the spread of the slopes is the beamlet’s, 5 mrad. The analysis of the maps gets close to it in , where the group is narrow (4.5 mrad, 10 % low), and far below it in (3.4 mrad): the group’s flat top makes the fitted Gaussian too wide at short distances, and its width grows more slowly than the beam’s rms width, so the fit’s takes up part of the growth. This is the bias of the experiments’ analysis when the footprint is far from Gaussian, which the markers make visible.
A curved grid
Section titled “A curved grid”Curved to 7 m, the beamlets converge: the slopes now include the aim, and the rms angle of the markers grows, while the footprint shrinks with the distance. The fit of the widths no longer measures a divergence:
curved = ApertureGrid.regular(16, 5, (0.020, 0.022), focal_length=(7.0, 7.0)).markers( beamlet)widths = xr.DataArray( [ [ fit_footprint( Calorimeter(d, (-0.4, 0.4, -0.4, 0.4), (40, 40)).measure(curved) )[f"width_{a}"] for d in np.linspace(1.0, 9.0, 9) ] for a in ("y", "z") ], dims=("direction", "x"), coords={ "direction": ["y", "z"], "x": ("x", np.linspace(1.0, 9.0, 9), {"units": "m"}), }, name="width", attrs={"units": "m", "long_name": "fitted width"},)with pp.figure(figsize=(7, 3.4)) as fig: for k in range(2): widths.plasma.plot.lineout(x="x", direction=k, ax=fig[0]) fig[0].legend(["in y", "in z"], fontsize=8)print(f"the markers' rms angle: {curved.rms_angle * 1e3} mrad (beamlet: 5 mrad)")the markers' rms angle: [ 6.3888788 15.36653616] mrad (beamlet: 5 mrad)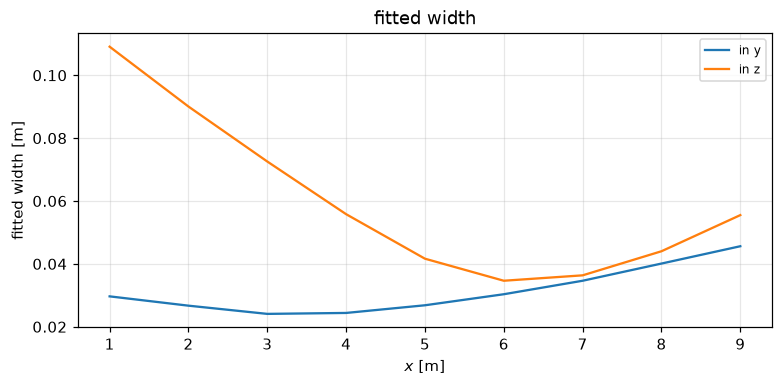
The fitted width falls to the focus at 7 m and grows beyond it: the beamlet divergence shows only near the focus, where the width is that of one beamlet, mm. This is why the experiments measure the divergence on a single beamlet group with a known aim, or at the focus.