Duct
Beyond the accelerator and the neutralizer no field acts on the neutrals: they fly on straight
lines to the port. beamtracer.beamline.Duct intersects each line with the duct walls, given
as simgeometry shapes, without a mesh, and samples where the duct gas reionizes a neutral
(an exponential free path). A reionized neutral is deposited where it is born, a bound on
where its power goes until the stray field that bends it is added.
The beam here is a round Gaussian beam of 1 MeV deuterium atoms, as Markers in 3D; the duct
a rectangular channel of four plates. The cross section is a placeholder: plasmacoll holds no
beam stripping data, so it is an input.
import matplotlib.patches as patchesimport numpy as npimport plasma_plots as ppimport xarray as xrfrom plasmacoll import ChargeStateTransitionsfrom scipy import constantsfrom simgeometry import Cuboid, SlantedTube
from beamtracer.beamline import Duct, gaussian_beam
BLUE, ORANGE, AQUA, MUTED = "#2a78d6", "#eb6834", "#1baf7a", "#8a897f"
energy = 1e6 * constants.e  # 1 MeVmass = 2.014 * constants.atomic_massspeed = np.sqrt(2 * energy / mass)beam = gaussian_beam(    200_000, power=16e6, speed=speed, width=0.06, divergence=0.007, seed=1)
length, half_y, half_z, wall = 3.0, 0.15, 0.3, 0.05walls = [    Cuboid(        (length / 2, s * (half_y + wall / 2), 0), (length, wall, 2 * (half_z + wall))    )    for s in (1, -1)] + [    Cuboid((length / 2, 0, s * (half_z + wall / 2)), (length, 2 * half_y, wall))    for s in (1, -1)]transitions = ChargeStateTransitions({"D2": {("0", "+"): 1.5e-20}})duct = Duct(walls, port=length, transitions=transitions, gas={"D2": 1e18})result = duct.trace(beam)result.summary()
<xarray.Dataset> Size: 48B
Dimensions: ()
Data variables:
power_in float64 8B 1.6e+07
power_port float64 8B 1.498e+07
power_wall float64 8B 3.262e+05
power_reionized float64 8B 6.889e+05
transmission float64 8B 0.9366
reionized_fraction float64 8B 0.04306Where the beam goes
Section titled “Where the beam goes”A side view: a few hundred of the lines, coloured by where they end, and the two plates at m. Most of the beam reaches the port; its tails scrape the plates over the last metre, where the beam has spread; a few percent are reionized anywhere along the duct.
def lines(markers, start, count):    take = np.arange(min(count, len(markers)))    return start.position[:, take], markers.position[:, take]

rng = np.random.default_rng(0)order = rng.permutation(len(beam))first = beam.subset(order)traced = duct.trace(first.subset(slice(0, 400)))start = first.subset(slice(0, 400))fates = {    "port": (traced.port, BLUE),    "wall": (traced.wall, ORANGE),    "reionized": (traced.reionized, AQUA),}with pp.figure(figsize=(8, 3.2)) as fig:    ax = fig[0]    for s in (1, -1):        y0 = half_y if s > 0 else -half_y - wall        ax.add_patch(patches.Rectangle((0, y0), length, wall, color=MUTED, alpha=0.4))    # the start of each fate's lines, matched through their velocity    for label, (markers, color) in fates.items():        if len(markers) == 0:            continue        x1, y1 = markers.position[0], markers.position[1]        slope = markers.velocity[1] / markers.velocity[0]        y0 = y1 - slope * x1        ax.plot([np.zeros_like(x1), x1], [y0, y1], color=color, lw=0.5, alpha=0.6)        ax.plot([], [], color=color, label=f"{label} ({len(markers)})")    ax.set_xlabel("x [m]")    ax.set_ylabel("y [m]")    ax.set_ylim(-0.25, 0.25)    ax.legend(loc="lower left", fontsize=8)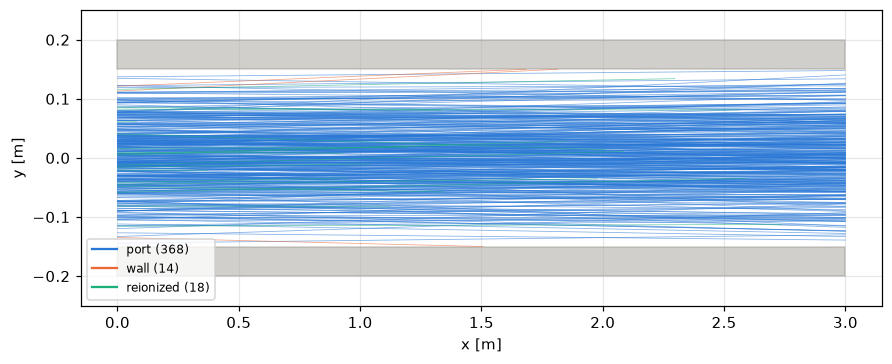
The footprint at the port
Section titled “The footprint at the port”The power density of the neutrals in the port plane: the round beam, clipped at m by the narrow plates; the wide ones ( m) take almost nothing.
footprint = result.port.footprint(bins=60, extent=(-0.3, 0.3, -0.3, 0.3))(footprint / 1e6).assign_attrs( units="MW/m²", long_name="power density").plasma.plot.slice( x="y", y="z", equal_aspect=True, colorbar_label="power density [MW/m²]")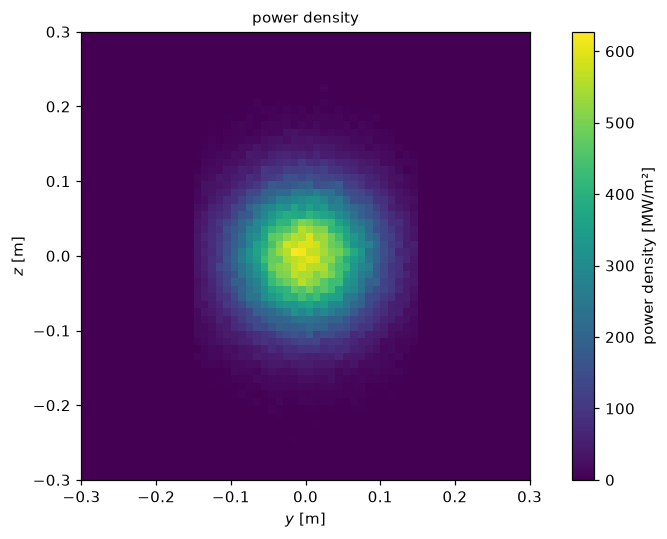
The power on the walls
Section titled “The power on the walls”The power per metre of duct on the plates, against . The peak at the entrance is the beam’s tails outside the bore there (beyond m, 2.5 widths out): they start in the plates and stop on their front faces. Along the duct the power grows towards the port, where the beam is widest.
edges = np.linspace(0, length, 31)on_walls = (result.wall.along_x(edges) / 1e3).assign_attrs( units="kW/m", long_name="power on the walls")on_walls.plasma.plot.lineout(x="x")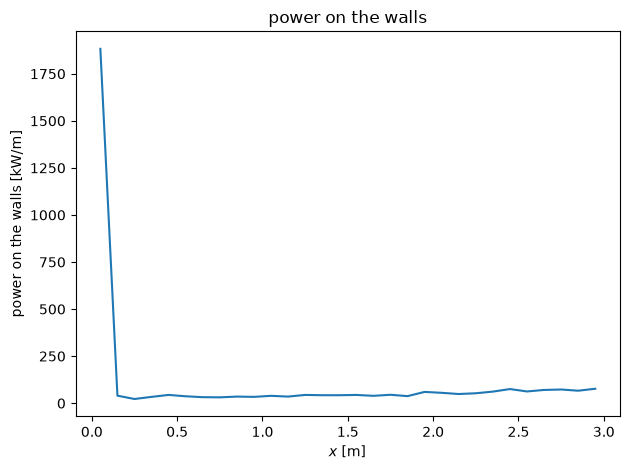
Transmission against the closed form
Section titled “Transmission against the closed form”The lines are straight and the duct is convex, so a line inside at both ends is inside all the way: the transmission is the share of the beam inside the bore at the port. For a round bore of radius that is , with the beam’s width at the port, as long as the beam starts inside the bore. Without gas, a narrow beam (5 mm, 20 mrad) through circular ducts of a range of bores (a tube cut square at its end):
narrow = gaussian_beam( 200_000, power=16e6, speed=speed, width=0.005, divergence=0.02, seed=2)sigma = np.hypot(0.005, length * 0.02)bores = np.linspace(0.02, 0.15, 9)measured = []for bore in bores: tube = SlantedTube((0, 0, 0), (length, 0, 0), bore, 1.0, (1, 0, 0)) measured.append(Duct([tube], port=length).trace(narrow).transmission)transmission = xr.DataArray( measured, dims="bore", coords={"bore": bores}, name="transmission")transmission.plasma.plot.against_theory( lambda a: 1 - np.exp(-(a**2) / (2 * sigma**2)), xlabel="bore radius [m]", ylabel="transmission",)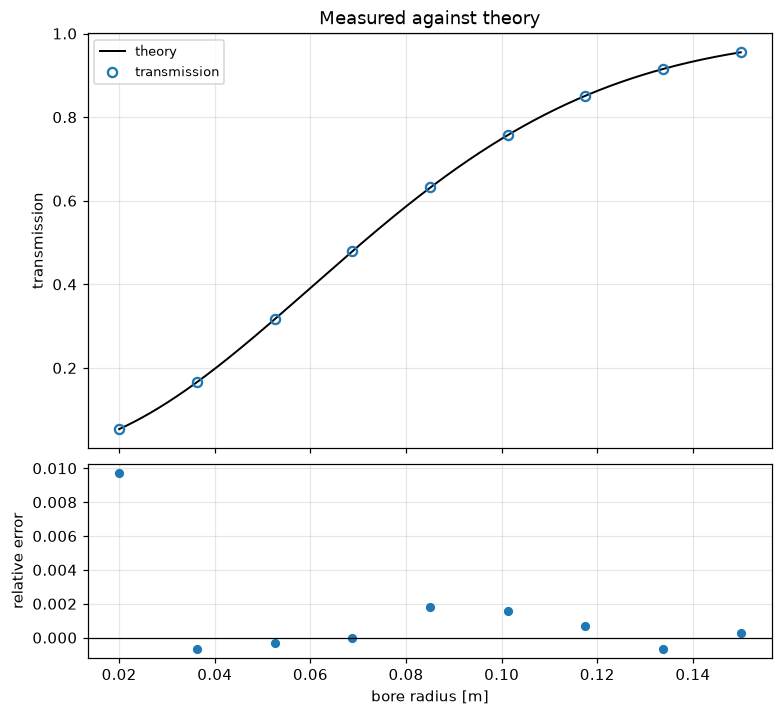
The relative error stays at the sampling noise of 200 000 markers. The square duct is checked
the same way in the tests, against , the formula of
freeofcharge’s duct_transmission.
Reionization along the duct
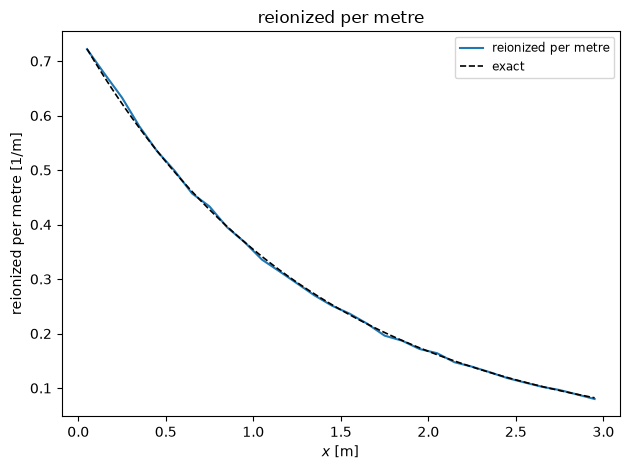
Section titled “Reionization along the duct”Where the neutrals are reionized, per metre: with a uniform gas the rate falls as of the power entering. A denser gas than above (5e19 m⁻³) makes the fall visible over the duct:
dense = Duct([], port=length, transitions=transitions, gas={"D2": 5e19})reionized = dense.trace(beam).reionizedk = 5e19 * 1.5e-20per_length = (reionized.along_x(edges) / beam.total_power).assign_attrs( units="1/m", long_name="reionized per metre")per_length.plasma.plot.lineout(x="x", reference=lambda x: k * np.exp(-k * x))print( f"reionized: {reionized.total_power / beam.total_power:.1%}, " f"expected {1 - np.exp(-k * length):.1%}")reionized: 89.4%, expected 89.5%